
|
市場調査レポート
商品コード
1414793
防弾チョッキ市場:タイプ別、保護レベル別、エンドユーザー別:世界の機会分析と産業予測、2023年~2032年Bulletproof Vests Market By Type (Soft Bulletproof Vest, Hard Bulletproof Vest), By Protection Level (II, IIA, III, IIIA, IV), By End User (Military and Law Enforcement, Civil): Global Opportunity Analysis and Industry Forecast, 2023-2032 |
||||||
|
|||||||

| 防弾チョッキ市場:タイプ別、保護レベル別、エンドユーザー別:世界の機会分析と産業予測、2023年~2032年 |
|
出版日: 2023年11月30日
発行: Allied Market Research
ページ情報: 英文 330 Pages
納期: 2~3営業日
|

- 全表示
- 概要
- 図表
- 目次
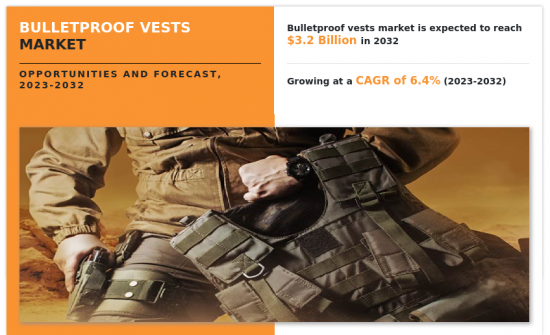
防弾チョッキ市場は、反乱活動や地政学的紛争の増加、軽量で耐久性のある弾道材料の進歩、軍事費の増加などにより、2023年から2032年にかけて6.4%の成長率を記録すると見られています。
防弾チョッキ市場は、世界中の地政学的紛争や脅威の増加により、世界的に大きな成長が見込まれています。防弾チョッキ市場は、起業家のイニシアチブ、民間資金の増加、製品、サービス、運用プロセスにわたる技術革新への注目の高まりにより、変革期を迎えています。
さらに、市場は防弾チョッキ内にスマート・テキスタイル、センサー、通信デバイスを統合する方向へのシフトを経験しています。この動向は、ウェアラブル技術におけるより広範な進歩と一致しており、防弾チョッキを装備した人員の状況認識と通信能力を強化しています。このようなスマート機能の統合は、防弾チョッキの防護能力を強化するだけでなく、警備・防衛分野における個人防護具の全体的な進化にも寄与しています。
軍用および法執行機関用の防弾チョッキは、ダイニーマ超高分子量ポリエチレン混合物や軽量複合セラミックプレートのような先端素材を統合して進化しており、快適性と機動性を向上させながら防弾性能を高めています。また、統合冷却システム、生体認証センサー、リアルタイム・コネクティビティを戦術ベストに組み込んだスマート・ベスト技術も登場しています。モジュール式ベストは、脅威レベルや任務要件に基づく装甲プレート、襟、サイドパネルのカスタマイズを可能にします。
対反乱および都市戦闘作戦を実施する部隊が直面する小火器、榴散弾、徹甲弾による脅威の増加は、市場の主要な成長促進要因です。警察署によって制定されたボディアーマーの義務政策もまた、調達を増加させています。軽量化、冷却、連結ベストを可能にする継続的な技術進歩は、老朽化した防護具のアップグレードを検討している部隊からの採用を促進します。
目次
第1章 イントロダクション
第2章 エグゼクティブサマリー
第3章 市場概要
- 市場の定義と範囲
- 主な調査結果
- 影響要因
- 主な投資機会
- ポーターのファイブフォース分析
- 市場力学
- 促進要因
- 反政府活動や地政学的紛争の増加
- 軽量で耐久性のある弾道材料の進歩
- 防衛費の増加
- 抑制要因
- 高度な防護服素材の高コスト
- 重量と熱負担
- 機会
- スマートテキスタイル、センサー、通信機器の統合
- 特定の産業ニーズに合わせた特殊防弾チョッキの需要増加
- 促進要因
第4章 防弾チョッキ市場:タイプ別
- 概要
- ソフト防弾チョッキ
- 硬質防弾チョッキ
第5章 防弾チョッキ市場:保護レベル別
- 概要
- II、IIA
- III、IIIA
- IV
第6章 防弾チョッキ市場:エンドユーザー別
- 概要
- 軍事および法執行機関
- 民事
第7章 防弾チョッキ市場:地域別
- 概要
- 北米
- 米国
- カナダ
- メキシコ
- 欧州
- 英国
- ドイツ
- フランス
- イタリア
- その他
- アジア太平洋
- 中国
- インド
- 日本
- 韓国
- その他
- ラテンアメリカ
- ラテンアメリカ
- 中東
- アフリカ
第8章 競合情勢
- イントロダクション
- 主要成功戦略
- 主要10社の製品マッピング
- 競合ダッシュボード
- 競合ヒートマップ
- 主要企業のポジショニング、2022年
第9章 企業プロファイル
- Point Blank Enterprises, Inc.
- MARS Armor Ltd.
- U.S. Armor Corporation
- Armor Express
- EnGarde Body Armor
- Safariland, LLC.
- Slate Solutions
- MKU LIMITED
- VestGuard UK Ltd.
- ARGUN s.r.o.
LIST OF TABLES
- TABLE 01. GLOBAL BULLETPROOF VESTS MARKET, BY TYPE, 2022-2032 ($MILLION)
- TABLE 02. BULLETPROOF VESTS MARKET FOR SOFT BULLETPROOF VEST, BY REGION, 2022-2032 ($MILLION)
- TABLE 03. BULLETPROOF VESTS MARKET FOR HARD BULLETPROOF VEST, BY REGION, 2022-2032 ($MILLION)
- TABLE 04. GLOBAL BULLETPROOF VESTS MARKET, BY PROTECTION LEVEL, 2022-2032 ($MILLION)
- TABLE 05. BULLETPROOF VESTS MARKET FOR II, IIA, BY REGION, 2022-2032 ($MILLION)
- TABLE 06. BULLETPROOF VESTS MARKET FOR III, IIIA, BY REGION, 2022-2032 ($MILLION)
- TABLE 07. BULLETPROOF VESTS MARKET FOR IV, BY REGION, 2022-2032 ($MILLION)
- TABLE 08. GLOBAL BULLETPROOF VESTS MARKET, BY END USER, 2022-2032 ($MILLION)
- TABLE 09. BULLETPROOF VESTS MARKET FOR MILITARY AND LAW ENFORCEMENT, BY REGION, 2022-2032 ($MILLION)
- TABLE 10. BULLETPROOF VESTS MARKET FOR CIVIL, BY REGION, 2022-2032 ($MILLION)
- TABLE 11. BULLETPROOF VESTS MARKET, BY REGION, 2022-2032 ($MILLION)
- TABLE 12. NORTH AMERICA BULLETPROOF VESTS MARKET, BY TYPE, 2022-2032 ($MILLION)
- TABLE 13. NORTH AMERICA BULLETPROOF VESTS MARKET, BY PROTECTION LEVEL, 2022-2032 ($MILLION)
- TABLE 14. NORTH AMERICA BULLETPROOF VESTS MARKET, BY END USER, 2022-2032 ($MILLION)
- TABLE 15. NORTH AMERICA BULLETPROOF VESTS MARKET, BY COUNTRY, 2022-2032 ($MILLION)
- TABLE 16. U.S. BULLETPROOF VESTS MARKET, BY TYPE, 2022-2032 ($MILLION)
- TABLE 17. U.S. BULLETPROOF VESTS MARKET, BY PROTECTION LEVEL, 2022-2032 ($MILLION)
- TABLE 18. U.S. BULLETPROOF VESTS MARKET, BY END USER, 2022-2032 ($MILLION)
- TABLE 19. CANADA BULLETPROOF VESTS MARKET, BY TYPE, 2022-2032 ($MILLION)
- TABLE 20. CANADA BULLETPROOF VESTS MARKET, BY PROTECTION LEVEL, 2022-2032 ($MILLION)
- TABLE 21. CANADA BULLETPROOF VESTS MARKET, BY END USER, 2022-2032 ($MILLION)
- TABLE 22. MEXICO BULLETPROOF VESTS MARKET, BY TYPE, 2022-2032 ($MILLION)
- TABLE 23. MEXICO BULLETPROOF VESTS MARKET, BY PROTECTION LEVEL, 2022-2032 ($MILLION)
- TABLE 24. MEXICO BULLETPROOF VESTS MARKET, BY END USER, 2022-2032 ($MILLION)
- TABLE 25. EUROPE BULLETPROOF VESTS MARKET, BY TYPE, 2022-2032 ($MILLION)
- TABLE 26. EUROPE BULLETPROOF VESTS MARKET, BY PROTECTION LEVEL, 2022-2032 ($MILLION)
- TABLE 27. EUROPE BULLETPROOF VESTS MARKET, BY END USER, 2022-2032 ($MILLION)
- TABLE 28. EUROPE BULLETPROOF VESTS MARKET, BY COUNTRY, 2022-2032 ($MILLION)
- TABLE 29. UK BULLETPROOF VESTS MARKET, BY TYPE, 2022-2032 ($MILLION)
- TABLE 30. UK BULLETPROOF VESTS MARKET, BY PROTECTION LEVEL, 2022-2032 ($MILLION)
- TABLE 31. UK BULLETPROOF VESTS MARKET, BY END USER, 2022-2032 ($MILLION)
- TABLE 32. GERMANY BULLETPROOF VESTS MARKET, BY TYPE, 2022-2032 ($MILLION)
- TABLE 33. GERMANY BULLETPROOF VESTS MARKET, BY PROTECTION LEVEL, 2022-2032 ($MILLION)
- TABLE 34. GERMANY BULLETPROOF VESTS MARKET, BY END USER, 2022-2032 ($MILLION)
- TABLE 35. FRANCE BULLETPROOF VESTS MARKET, BY TYPE, 2022-2032 ($MILLION)
- TABLE 36. FRANCE BULLETPROOF VESTS MARKET, BY PROTECTION LEVEL, 2022-2032 ($MILLION)
- TABLE 37. FRANCE BULLETPROOF VESTS MARKET, BY END USER, 2022-2032 ($MILLION)
- TABLE 38. ITALY BULLETPROOF VESTS MARKET, BY TYPE, 2022-2032 ($MILLION)
- TABLE 39. ITALY BULLETPROOF VESTS MARKET, BY PROTECTION LEVEL, 2022-2032 ($MILLION)
- TABLE 40. ITALY BULLETPROOF VESTS MARKET, BY END USER, 2022-2032 ($MILLION)
- TABLE 41. REST OF EUROPE BULLETPROOF VESTS MARKET, BY TYPE, 2022-2032 ($MILLION)
- TABLE 42. REST OF EUROPE BULLETPROOF VESTS MARKET, BY PROTECTION LEVEL, 2022-2032 ($MILLION)
- TABLE 43. REST OF EUROPE BULLETPROOF VESTS MARKET, BY END USER, 2022-2032 ($MILLION)
- TABLE 44. ASIA-PACIFIC BULLETPROOF VESTS MARKET, BY TYPE, 2022-2032 ($MILLION)
- TABLE 45. ASIA-PACIFIC BULLETPROOF VESTS MARKET, BY PROTECTION LEVEL, 2022-2032 ($MILLION)
- TABLE 46. ASIA-PACIFIC BULLETPROOF VESTS MARKET, BY END USER, 2022-2032 ($MILLION)
- TABLE 47. ASIA-PACIFIC BULLETPROOF VESTS MARKET, BY COUNTRY, 2022-2032 ($MILLION)
- TABLE 48. CHINA BULLETPROOF VESTS MARKET, BY TYPE, 2022-2032 ($MILLION)
- TABLE 49. CHINA BULLETPROOF VESTS MARKET, BY PROTECTION LEVEL, 2022-2032 ($MILLION)
- TABLE 50. CHINA BULLETPROOF VESTS MARKET, BY END USER, 2022-2032 ($MILLION)
- TABLE 51. INDIA BULLETPROOF VESTS MARKET, BY TYPE, 2022-2032 ($MILLION)
- TABLE 52. INDIA BULLETPROOF VESTS MARKET, BY PROTECTION LEVEL, 2022-2032 ($MILLION)
- TABLE 53. INDIA BULLETPROOF VESTS MARKET, BY END USER, 2022-2032 ($MILLION)
- TABLE 54. JAPAN BULLETPROOF VESTS MARKET, BY TYPE, 2022-2032 ($MILLION)
- TABLE 55. JAPAN BULLETPROOF VESTS MARKET, BY PROTECTION LEVEL, 2022-2032 ($MILLION)
- TABLE 56. JAPAN BULLETPROOF VESTS MARKET, BY END USER, 2022-2032 ($MILLION)
- TABLE 57. SOUTH KOREA BULLETPROOF VESTS MARKET, BY TYPE, 2022-2032 ($MILLION)
- TABLE 58. SOUTH KOREA BULLETPROOF VESTS MARKET, BY PROTECTION LEVEL, 2022-2032 ($MILLION)
- TABLE 59. SOUTH KOREA BULLETPROOF VESTS MARKET, BY END USER, 2022-2032 ($MILLION)
- TABLE 60. REST OF ASIA-PACIFIC BULLETPROOF VESTS MARKET, BY TYPE, 2022-2032 ($MILLION)
- TABLE 61. REST OF ASIA-PACIFIC BULLETPROOF VESTS MARKET, BY PROTECTION LEVEL, 2022-2032 ($MILLION)
- TABLE 62. REST OF ASIA-PACIFIC BULLETPROOF VESTS MARKET, BY END USER, 2022-2032 ($MILLION)
- TABLE 63. LAMEA BULLETPROOF VESTS MARKET, BY TYPE, 2022-2032 ($MILLION)
- TABLE 64. LAMEA BULLETPROOF VESTS MARKET, BY PROTECTION LEVEL, 2022-2032 ($MILLION)
- TABLE 65. LAMEA BULLETPROOF VESTS MARKET, BY END USER, 2022-2032 ($MILLION)
- TABLE 66. LAMEA BULLETPROOF VESTS MARKET, BY COUNTRY, 2022-2032 ($MILLION)
- TABLE 67. LATIN AMERICA BULLETPROOF VESTS MARKET, BY TYPE, 2022-2032 ($MILLION)
- TABLE 68. LATIN AMERICA BULLETPROOF VESTS MARKET, BY PROTECTION LEVEL, 2022-2032 ($MILLION)
- TABLE 69. LATIN AMERICA BULLETPROOF VESTS MARKET, BY END USER, 2022-2032 ($MILLION)
- TABLE 70. MIDDLE EAST BULLETPROOF VESTS MARKET, BY TYPE, 2022-2032 ($MILLION)
- TABLE 71. MIDDLE EAST BULLETPROOF VESTS MARKET, BY PROTECTION LEVEL, 2022-2032 ($MILLION)
- TABLE 72. MIDDLE EAST BULLETPROOF VESTS MARKET, BY END USER, 2022-2032 ($MILLION)
- TABLE 73. AFRICA BULLETPROOF VESTS MARKET, BY TYPE, 2022-2032 ($MILLION)
- TABLE 74. AFRICA BULLETPROOF VESTS MARKET, BY PROTECTION LEVEL, 2022-2032 ($MILLION)
- TABLE 75. AFRICA BULLETPROOF VESTS MARKET, BY END USER, 2022-2032 ($MILLION)
- TABLE 76. POINT BLANK ENTERPRISES, INC.: KEY EXECUTIVES
- TABLE 77. POINT BLANK ENTERPRISES, INC.: COMPANY SNAPSHOT
- TABLE 78. POINT BLANK ENTERPRISES, INC.: PRODUCT SEGMENTS
- TABLE 79. POINT BLANK ENTERPRISES, INC.: PRODUCT PORTFOLIO
- TABLE 80. POINT BLANK ENTERPRISES, INC.: KEY STRATERGIES
- TABLE 81. MARS ARMOR LTD.: KEY EXECUTIVES
- TABLE 82. MARS ARMOR LTD.: COMPANY SNAPSHOT
- TABLE 83. MARS ARMOR LTD.: PRODUCT SEGMENTS
- TABLE 84. MARS ARMOR LTD.: PRODUCT PORTFOLIO
- TABLE 85. U.S. ARMOR CORPORATION: KEY EXECUTIVES
- TABLE 86. U.S. ARMOR CORPORATION: COMPANY SNAPSHOT
- TABLE 87. U.S. ARMOR CORPORATION: PRODUCT SEGMENTS
- TABLE 88. U.S. ARMOR CORPORATION: PRODUCT PORTFOLIO
- TABLE 89. ARMOR EXPRESS: KEY EXECUTIVES
- TABLE 90. ARMOR EXPRESS: COMPANY SNAPSHOT
- TABLE 91. ARMOR EXPRESS: PRODUCT SEGMENTS
- TABLE 92. ARMOR EXPRESS: PRODUCT PORTFOLIO
- TABLE 93. ARMOR EXPRESS: KEY STRATERGIES
- TABLE 94. ENGARDE BODY ARMOR: KEY EXECUTIVES
- TABLE 95. ENGARDE BODY ARMOR: COMPANY SNAPSHOT
- TABLE 96. ENGARDE BODY ARMOR: PRODUCT SEGMENTS
- TABLE 97. ENGARDE BODY ARMOR: PRODUCT PORTFOLIO
- TABLE 98. SAFARILAND, LLC.: KEY EXECUTIVES
- TABLE 99. SAFARILAND, LLC.: COMPANY SNAPSHOT
- TABLE 100. SAFARILAND, LLC.: PRODUCT SEGMENTS
- TABLE 101. SAFARILAND, LLC.: PRODUCT PORTFOLIO
- TABLE 102. SAFARILAND, LLC.: KEY STRATERGIES
- TABLE 103. SLATE SOLUTIONS: KEY EXECUTIVES
- TABLE 104. SLATE SOLUTIONS: COMPANY SNAPSHOT
- TABLE 105. SLATE SOLUTIONS: PRODUCT SEGMENTS
- TABLE 106. SLATE SOLUTIONS: PRODUCT PORTFOLIO
- TABLE 107. MKU LIMITED: KEY EXECUTIVES
- TABLE 108. MKU LIMITED: COMPANY SNAPSHOT
- TABLE 109. MKU LIMITED: PRODUCT SEGMENTS
- TABLE 110. MKU LIMITED: PRODUCT PORTFOLIO
- TABLE 111. MKU LIMITED: KEY STRATERGIES
- TABLE 112. VESTGUARD UK LTD.: KEY EXECUTIVES
- TABLE 113. VESTGUARD UK LTD.: COMPANY SNAPSHOT
- TABLE 114. VESTGUARD UK LTD.: PRODUCT SEGMENTS
- TABLE 115. VESTGUARD UK LTD.: PRODUCT PORTFOLIO
- TABLE 116. ARGUN S.R.O.: KEY EXECUTIVES
- TABLE 117. ARGUN S.R.O.: COMPANY SNAPSHOT
- TABLE 118. ARGUN S.R.O.: PRODUCT SEGMENTS
- TABLE 119. ARGUN S.R.O.: PRODUCT PORTFOLIO
LIST OF FIGURES
- FIGURE 01. BULLETPROOF VESTS MARKET, 2022-2032
- FIGURE 02. SEGMENTATION OF BULLETPROOF VESTS MARKET,2022-2032
- FIGURE 03. TOP IMPACTING FACTORS IN BULLETPROOF VESTS MARKET (2022 TO 2032)
- FIGURE 04. TOP INVESTMENT POCKETS IN BULLETPROOF VESTS MARKET (2023-2032)
- FIGURE 05. LOW BARGAINING POWER OF SUPPLIERS
- FIGURE 06. LOW THREAT OF NEW ENTRANTS
- FIGURE 07. LOW THREAT OF SUBSTITUTES
- FIGURE 08. LOW INTENSITY OF RIVALRY
- FIGURE 09. LOW BARGAINING POWER OF BUYERS
- FIGURE 10. GLOBAL BULLETPROOF VESTS MARKET:DRIVERS, RESTRAINTS AND OPPORTUNITIES
- FIGURE 11. BULLETPROOF VESTS MARKET, BY TYPE, 2022 AND 2032(%)
- FIGURE 12. COMPARATIVE SHARE ANALYSIS OF BULLETPROOF VESTS MARKET FOR SOFT BULLETPROOF VEST, BY COUNTRY 2022 AND 2032(%)
- FIGURE 13. COMPARATIVE SHARE ANALYSIS OF BULLETPROOF VESTS MARKET FOR HARD BULLETPROOF VEST, BY COUNTRY 2022 AND 2032(%)
- FIGURE 14. BULLETPROOF VESTS MARKET, BY PROTECTION LEVEL, 2022 AND 2032(%)
- FIGURE 15. COMPARATIVE SHARE ANALYSIS OF BULLETPROOF VESTS MARKET FOR II, IIA, BY COUNTRY 2022 AND 2032(%)
- FIGURE 16. COMPARATIVE SHARE ANALYSIS OF BULLETPROOF VESTS MARKET FOR III, IIIA, BY COUNTRY 2022 AND 2032(%)
- FIGURE 17. COMPARATIVE SHARE ANALYSIS OF BULLETPROOF VESTS MARKET FOR IV, BY COUNTRY 2022 AND 2032(%)
- FIGURE 18. BULLETPROOF VESTS MARKET, BY END USER, 2022 AND 2032(%)
- FIGURE 19. COMPARATIVE SHARE ANALYSIS OF BULLETPROOF VESTS MARKET FOR MILITARY AND LAW ENFORCEMENT, BY COUNTRY 2022 AND 2032(%)
- FIGURE 20. COMPARATIVE SHARE ANALYSIS OF BULLETPROOF VESTS MARKET FOR CIVIL, BY COUNTRY 2022 AND 2032(%)
- FIGURE 21. BULLETPROOF VESTS MARKET BY REGION, 2022 AND 2032(%)
- FIGURE 22. U.S. BULLETPROOF VESTS MARKET, 2022-2032 ($MILLION)
- FIGURE 23. CANADA BULLETPROOF VESTS MARKET, 2022-2032 ($MILLION)
- FIGURE 24. MEXICO BULLETPROOF VESTS MARKET, 2022-2032 ($MILLION)
- FIGURE 25. UK BULLETPROOF VESTS MARKET, 2022-2032 ($MILLION)
- FIGURE 26. GERMANY BULLETPROOF VESTS MARKET, 2022-2032 ($MILLION)
- FIGURE 27. FRANCE BULLETPROOF VESTS MARKET, 2022-2032 ($MILLION)
- FIGURE 28. ITALY BULLETPROOF VESTS MARKET, 2022-2032 ($MILLION)
- FIGURE 29. REST OF EUROPE BULLETPROOF VESTS MARKET, 2022-2032 ($MILLION)
- FIGURE 30. CHINA BULLETPROOF VESTS MARKET, 2022-2032 ($MILLION)
- FIGURE 31. INDIA BULLETPROOF VESTS MARKET, 2022-2032 ($MILLION)
- FIGURE 32. JAPAN BULLETPROOF VESTS MARKET, 2022-2032 ($MILLION)
- FIGURE 33. SOUTH KOREA BULLETPROOF VESTS MARKET, 2022-2032 ($MILLION)
- FIGURE 34. REST OF ASIA-PACIFIC BULLETPROOF VESTS MARKET, 2022-2032 ($MILLION)
- FIGURE 35. LATIN AMERICA BULLETPROOF VESTS MARKET, 2022-2032 ($MILLION)
- FIGURE 36. MIDDLE EAST BULLETPROOF VESTS MARKET, 2022-2032 ($MILLION)
- FIGURE 37. AFRICA BULLETPROOF VESTS MARKET, 2022-2032 ($MILLION)
- FIGURE 38. TOP WINNING STRATEGIES, BY YEAR (2020-2022)
- FIGURE 39. TOP WINNING STRATEGIES, BY DEVELOPMENT (2020-2022)
- FIGURE 40. TOP WINNING STRATEGIES, BY COMPANY (2020-2022)
- FIGURE 41. PRODUCT MAPPING OF TOP 10 PLAYERS
- FIGURE 42. COMPETITIVE DASHBOARD
- FIGURE 43. COMPETITIVE HEATMAP: BULLETPROOF VESTS MARKET
- FIGURE 44. TOP PLAYER POSITIONING, 2022
The bulletproof vests market is likely to experience a growth rate of 6.4% from 2023-2032 owing to rise in insurgency activities and geopolitical conflicts, advancements in lightweight and durable ballistic materials, and increase in military spending- Allied Market Research
The bulletproof vests market is expected to witness significant growth globally due to rise in geopolitical conflicts and threats across the globe. The bulletproof vests market is undergoing transformations owing to entrepreneurial initiatives, increased private funding, and increased focus on innovation across products, services, and operational processes.
Furthermore, the market is experiencing a shift towards the integration of smart textiles, sensors, and communication devices within bulletproof vests. This trend aligns with the broader advancements in wearable technologies, enhancing the situational awareness and communication capabilities of personnel equipped with these vests. The integration of such smart features not only augments the protective capabilities of vests but also contributes to the overall evolution of personal protective equipment in the security and defense sectors.
Military and law enforcement bulletproof vests are evolving with the integration of advanced materials like Dyneema ultra-high molecular weight polyethylene blends and lightweight composite ceramic plates to enhance ballistic protection while improving comfort and mobility. Smart vest technologies are also emerging, with integrated cooling systems, biometrics sensors, and real-time connectivity incorporated into tactical vests. Modular vests allow customization of armor plates, collars, and side panels based on threat levels and mission requirements.
The rise in threats from small arms, shrapnel, and armor-piercing ammunitions faced by forces conducting counterinsurgency and urban combat operations are key growth drivers of the market. Mandatory body armor policies instituted by police departments are also increasing procurement. Ongoing technological advances enabling lighter, cooled, connected vests drive adoption from forces looking to upgrade aging protective gear.
The bulletproof vests market is segmented on the basis of type, end user, protection level, and region. On the basis of type, the market is divided into soft bulletproof vest and hard bulletproof vest. On the basis of end user, the market is classified into military and law enforcement, and civil. On the basis of protection level, the market is categorized into II, IIA, III, IIIA, and IV. On the basis of region, the market is analyzed across North America, Europe, Asia-Pacific, and LAMEA.
The leading companies profiled in the report include Point Blank Enterprises, Inc., MARS Armor Ltd., U.S. Armor Corporation, VestGuard UK Ltd., Armor Express, MKU Limited, Slate Solutions, Safariland, LLC., EnGarde Body Armor, and ARGUN s.r.o.
Key Benefits For Stakeholders
- This report provides a quantitative analysis of the market segments, current trends, estimations, and dynamics of the bulletproof vests market analysis from 2022 to 2032 to identify the prevailing bulletproof vests market opportunities.
- The market research is offered along with information related to key drivers, restraints, and opportunities.
- Porter's five forces analysis highlights the potency of buyers and suppliers to enable stakeholders make profit-oriented business decisions and strengthen their supplier-buyer network.
- In-depth analysis of the bulletproof vests market segmentation assists to determine the prevailing market opportunities.
- Major countries in each region are mapped according to their revenue contribution to the global market.
- Market player positioning facilitates benchmarking and provides a clear understanding of the present position of the market players.
- The report includes the analysis of the regional as well as global bulletproof vests market trends, key players, market segments, application areas, and market growth strategies.
Additional benefits you will get with this purchase are:
- Quarterly Update and* (only available with a corporate license, on listed price)
- 5 additional Company Profile of client Choice pre- or Post-purchase, as a free update.
- Free Upcoming Version on the Purchase of Five and Enterprise User License.
- 16 analyst hours of support* (post-purchase, if you find additional data requirements upon review of the report, you may receive support amounting to 16 analyst hours to solve questions, and post-sale queries)
- 15% Free Customization* (in case the scope or segment of the report does not match your requirements, 15% is equivalent to 3 working days of free work, applicable once)
- Free data Pack on the Five and Enterprise User License. (Excel version of the report)
- Free Updated report if the report is 6-12 months old or older.
- 24-hour priority response*
- Free Industry updates and white papers.
Possible Customization with this report (with additional cost and timeline, please talk to the sales executive to know more)
- Additional company profiles with specific to client's interest
- Additional country or region analysis- market size and forecast
- Expanded list for Company Profiles
- Historic market data
Key Market Segments
By Type
- Soft Bulletproof Vest
- Hard Bulletproof Vest
By Protection Level
- II, IIA
- III, IIIA
- IV
By End User
- Military and Law Enforcement
- Civil
By Region
- North America
- U.S.
- Canada
- Mexico
- Europe
- UK
- Germany
- France
- Italy
- Rest of Europe
- Asia-Pacific
- China
- India
- Japan
- South Korea
- Rest of Asia-Pacific
- LAMEA
- Latin America
- Middle East
- Africa
Key Market Players:
- Point Blank Enterprises, Inc.
- MARS Armor Ltd.
- VestGuard UK Ltd.
- Armor Express
- Slate Solutions
- Safariland, LLC.
- ARGUN s.r.o.
- U.S. Armor Corporation
- MKU LIMITED
- EnGarde Body Armor
TABLE OF CONTENTS
CHAPTER 1: INTRODUCTION
- 1.1. Report description
- 1.2. Key market segments
- 1.3. Key benefits to the stakeholders
- 1.4. Research methodology
- 1.4.1. Primary research
- 1.4.2. Secondary research
- 1.4.3. Analyst tools and models
CHAPTER 2: EXECUTIVE SUMMARY
- 2.1. CXO Perspective
CHAPTER 3: MARKET OVERVIEW
- 3.1. Market definition and scope
- 3.2. Key findings
- 3.2.1. Top impacting factors
- 3.2.2. Top investment pockets
- 3.3. Porter's five forces analysis
- 3.3.1. Low bargaining power of suppliers
- 3.3.2. Low threat of new entrants
- 3.3.3. Low threat of substitutes
- 3.3.4. Low intensity of rivalry
- 3.3.5. Low bargaining power of buyers
- 3.4. Market dynamics
- 3.4.1. Drivers
- 3.4.1.1. Rise in insurgency activities and geopolitical conflicts
- 3.4.1.2. Advancements in lightweight and durable ballistic materials
- 3.4.1.3. Increase in defense spending
- 3.4.2. Restraints
- 3.4.2.1. High cost of advanced body armor materials
- 3.4.2.2. Weight and thermal burden
- 3.4.3. Opportunities
- 3.4.3.1. Integration of smart textiles, sensors, and communication devices
- 3.4.3.2. Increase in demand for specialized bulletproof vests tailored to specific industry needs
- 3.4.1. Drivers
CHAPTER 4: BULLETPROOF VESTS MARKET, BY TYPE
- 4.1. Overview
- 4.1.1. Market size and forecast
- 4.2. Soft Bulletproof Vest
- 4.2.1. Key market trends, growth factors and opportunities
- 4.2.2. Market size and forecast, by region
- 4.2.3. Market share analysis by country
- 4.3. Hard Bulletproof Vest
- 4.3.1. Key market trends, growth factors and opportunities
- 4.3.2. Market size and forecast, by region
- 4.3.3. Market share analysis by country
CHAPTER 5: BULLETPROOF VESTS MARKET, BY PROTECTION LEVEL
- 5.1. Overview
- 5.1.1. Market size and forecast
- 5.2. II, IIA
- 5.2.1. Key market trends, growth factors and opportunities
- 5.2.2. Market size and forecast, by region
- 5.2.3. Market share analysis by country
- 5.3. III, IIIA
- 5.3.1. Key market trends, growth factors and opportunities
- 5.3.2. Market size and forecast, by region
- 5.3.3. Market share analysis by country
- 5.4. IV
- 5.4.1. Key market trends, growth factors and opportunities
- 5.4.2. Market size and forecast, by region
- 5.4.3. Market share analysis by country
CHAPTER 6: BULLETPROOF VESTS MARKET, BY END USER
- 6.1. Overview
- 6.1.1. Market size and forecast
- 6.2. Military and Law Enforcement
- 6.2.1. Key market trends, growth factors and opportunities
- 6.2.2. Market size and forecast, by region
- 6.2.3. Market share analysis by country
- 6.3. Civil
- 6.3.1. Key market trends, growth factors and opportunities
- 6.3.2. Market size and forecast, by region
- 6.3.3. Market share analysis by country
CHAPTER 7: BULLETPROOF VESTS MARKET, BY REGION
- 7.1. Overview
- 7.1.1. Market size and forecast By Region
- 7.2. North America
- 7.2.1. Key market trends, growth factors and opportunities
- 7.2.2. Market size and forecast, by Type
- 7.2.3. Market size and forecast, by Protection Level
- 7.2.4. Market size and forecast, by End User
- 7.2.5. Market size and forecast, by country
- 7.2.5.1. U.S.
- 7.2.5.1.1. Market size and forecast, by Type
- 7.2.5.1.2. Market size and forecast, by Protection Level
- 7.2.5.1.3. Market size and forecast, by End User
- 7.2.5.2. Canada
- 7.2.5.2.1. Market size and forecast, by Type
- 7.2.5.2.2. Market size and forecast, by Protection Level
- 7.2.5.2.3. Market size and forecast, by End User
- 7.2.5.3. Mexico
- 7.2.5.3.1. Market size and forecast, by Type
- 7.2.5.3.2. Market size and forecast, by Protection Level
- 7.2.5.3.3. Market size and forecast, by End User
- 7.3. Europe
- 7.3.1. Key market trends, growth factors and opportunities
- 7.3.2. Market size and forecast, by Type
- 7.3.3. Market size and forecast, by Protection Level
- 7.3.4. Market size and forecast, by End User
- 7.3.5. Market size and forecast, by country
- 7.3.5.1. UK
- 7.3.5.1.1. Market size and forecast, by Type
- 7.3.5.1.2. Market size and forecast, by Protection Level
- 7.3.5.1.3. Market size and forecast, by End User
- 7.3.5.2. Germany
- 7.3.5.2.1. Market size and forecast, by Type
- 7.3.5.2.2. Market size and forecast, by Protection Level
- 7.3.5.2.3. Market size and forecast, by End User
- 7.3.5.3. France
- 7.3.5.3.1. Market size and forecast, by Type
- 7.3.5.3.2. Market size and forecast, by Protection Level
- 7.3.5.3.3. Market size and forecast, by End User
- 7.3.5.4. Italy
- 7.3.5.4.1. Market size and forecast, by Type
- 7.3.5.4.2. Market size and forecast, by Protection Level
- 7.3.5.4.3. Market size and forecast, by End User
- 7.3.5.5. Rest of Europe
- 7.3.5.5.1. Market size and forecast, by Type
- 7.3.5.5.2. Market size and forecast, by Protection Level
- 7.3.5.5.3. Market size and forecast, by End User
- 7.4. Asia-Pacific
- 7.4.1. Key market trends, growth factors and opportunities
- 7.4.2. Market size and forecast, by Type
- 7.4.3. Market size and forecast, by Protection Level
- 7.4.4. Market size and forecast, by End User
- 7.4.5. Market size and forecast, by country
- 7.4.5.1. China
- 7.4.5.1.1. Market size and forecast, by Type
- 7.4.5.1.2. Market size and forecast, by Protection Level
- 7.4.5.1.3. Market size and forecast, by End User
- 7.4.5.2. India
- 7.4.5.2.1. Market size and forecast, by Type
- 7.4.5.2.2. Market size and forecast, by Protection Level
- 7.4.5.2.3. Market size and forecast, by End User
- 7.4.5.3. Japan
- 7.4.5.3.1. Market size and forecast, by Type
- 7.4.5.3.2. Market size and forecast, by Protection Level
- 7.4.5.3.3. Market size and forecast, by End User
- 7.4.5.4. South Korea
- 7.4.5.4.1. Market size and forecast, by Type
- 7.4.5.4.2. Market size and forecast, by Protection Level
- 7.4.5.4.3. Market size and forecast, by End User
- 7.4.5.5. Rest of Asia-Pacific
- 7.4.5.5.1. Market size and forecast, by Type
- 7.4.5.5.2. Market size and forecast, by Protection Level
- 7.4.5.5.3. Market size and forecast, by End User
- 7.5. LAMEA
- 7.5.1. Key market trends, growth factors and opportunities
- 7.5.2. Market size and forecast, by Type
- 7.5.3. Market size and forecast, by Protection Level
- 7.5.4. Market size and forecast, by End User
- 7.5.5. Market size and forecast, by country
- 7.5.5.1. Latin America
- 7.5.5.1.1. Market size and forecast, by Type
- 7.5.5.1.2. Market size and forecast, by Protection Level
- 7.5.5.1.3. Market size and forecast, by End User
- 7.5.5.2. Middle East
- 7.5.5.2.1. Market size and forecast, by Type
- 7.5.5.2.2. Market size and forecast, by Protection Level
- 7.5.5.2.3. Market size and forecast, by End User
- 7.5.5.3. Africa
- 7.5.5.3.1. Market size and forecast, by Type
- 7.5.5.3.2. Market size and forecast, by Protection Level
- 7.5.5.3.3. Market size and forecast, by End User
CHAPTER 8: COMPETITIVE LANDSCAPE
- 8.1. Introduction
- 8.2. Top winning strategies
- 8.3. Product mapping of top 10 player
- 8.4. Competitive dashboard
- 8.5. Competitive heatmap
- 8.6. Top player positioning, 2022
CHAPTER 9: COMPANY PROFILES
- 9.1. Point Blank Enterprises, Inc.
- 9.1.1. Company overview
- 9.1.2. Key executives
- 9.1.3. Company snapshot
- 9.1.4. Operating business segments
- 9.1.5. Product portfolio
- 9.1.6. Key strategic moves and developments
- 9.2. MARS Armor Ltd.
- 9.2.1. Company overview
- 9.2.2. Key executives
- 9.2.3. Company snapshot
- 9.2.4. Operating business segments
- 9.2.5. Product portfolio
- 9.3. U.S. Armor Corporation
- 9.3.1. Company overview
- 9.3.2. Key executives
- 9.3.3. Company snapshot
- 9.3.4. Operating business segments
- 9.3.5. Product portfolio
- 9.4. Armor Express
- 9.4.1. Company overview
- 9.4.2. Key executives
- 9.4.3. Company snapshot
- 9.4.4. Operating business segments
- 9.4.5. Product portfolio
- 9.4.6. Key strategic moves and developments
- 9.5. EnGarde Body Armor
- 9.5.1. Company overview
- 9.5.2. Key executives
- 9.5.3. Company snapshot
- 9.5.4. Operating business segments
- 9.5.5. Product portfolio
- 9.6. Safariland, LLC.
- 9.6.1. Company overview
- 9.6.2. Key executives
- 9.6.3. Company snapshot
- 9.6.4. Operating business segments
- 9.6.5. Product portfolio
- 9.6.6. Key strategic moves and developments
- 9.7. Slate Solutions
- 9.7.1. Company overview
- 9.7.2. Key executives
- 9.7.3. Company snapshot
- 9.7.4. Operating business segments
- 9.7.5. Product portfolio
- 9.8. MKU LIMITED
- 9.8.1. Company overview
- 9.8.2. Key executives
- 9.8.3. Company snapshot
- 9.8.4. Operating business segments
- 9.8.5. Product portfolio
- 9.8.6. Key strategic moves and developments
- 9.9. VestGuard UK Ltd.
- 9.9.1. Company overview
- 9.9.2. Key executives
- 9.9.3. Company snapshot
- 9.9.4. Operating business segments
- 9.9.5. Product portfolio
- 9.10. ARGUN s.r.o.
- 9.10.1. Company overview
- 9.10.2. Key executives
- 9.10.3. Company snapshot
- 9.10.4. Operating business segments
- 9.10.5. Product portfolio
