
|
市場調査レポート
商品コード
1414780
止水市場:製品別、用途別、最終用途別:世界の機会分析と産業予測、2023年~2032年Waterstop Market By Product, By Application, By End Use : Global Opportunity Analysis and Industry Forecast, 2023-2032 |
||||||
|
|||||||

| 止水市場:製品別、用途別、最終用途別:世界の機会分析と産業予測、2023年~2032年 |
|
出版日: 2023年11月30日
発行: Allied Market Research
ページ情報: 英文 379 Pages
納期: 2~3営業日
|

- 全表示
- 概要
- 図表
- 目次
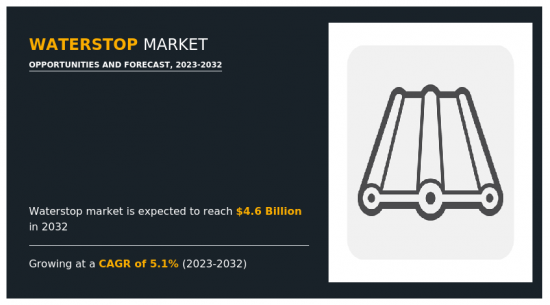
止水市場の2022年の市場規模は28億米ドルで、2032年には46億米ドルに達し、2023年から2032年までのCAGRは5.1%で成長すると予測されています。
技術の進歩は既存の製品や材料を陳腐化させることで市場を混乱させる可能性がある一方、技術の進歩は市場の成長を促進する可能性があります。持続可能性と環境に配慮した建築慣行が重視されるようになると、より環境に優しい止水材の開発が必要になるが、これは複雑さとコストを増大させる可能性があります。この要因は、予測期間中の市場成長を妨げると予測されます。世界市場と国際貿易の拡大は、産業部門がより多くの顧客層を開拓する機会を生み出し、生産量の増加と止水市場の成長につながった。
以下のような産業
1 鉱業、化学処理、製造業などでは、水や薬液を管理するために封じ込めシステムが必要になることが多いです。止水栓は、工業用途において封じ込めを確実にし、漏れを防止する役割を果たします。これらの要因が相まって、工業分野における止水栓の成長と潜在的な売上が拡大しています。
目次
第1章 イントロダクション
第2章 エグゼクティブサマリー
第3章 市場概要
- 市場の定義と範囲
- 主な調査結果
- 影響要因
- 主な投資機会
- ポーターのファイブフォース分析
- 市場力学
- 促進要因
- インフラにおける止水材の普及拡大
- 商業部門からの旺盛な需要
- 抑制要因
- サプライチェーンの混乱、環境基準、技術の進歩
- 機会
- 産業部門からの需要の増加
- 促進要因
- バリューチェーン分析
- 主要規制分析
- 特許情勢
第4章 止水市場:製品別
- 概要
- PVC止水栓
- ゴム製止水栓
- 金属製止水材
- その他
第5章 止水市場:用途別
- 概要
- 建築目地
- パイプ貫通部
- 伸縮継手
- トンネルと地下構造物
- その他
第6章 止水市場:用途別
- 概要
- 商業用
- 住宅用
- その他
第7章 止水市場:地域別
- 概要
- 北米
- 米国
- カナダ
- メキシコ
- 欧州
- ドイツ
- 英国
- フランス
- スペイン
- イタリア
- その他
- アジア太平洋
- 中国
- 日本
- インド
- 韓国
- オーストラリア
- その他
- ラテンアメリカ・中東・アフリカ
- ブラジル
- 南アフリカ
- サウジアラビア
- その他
第8章 競争情勢
- イントロダクション
- 主要成功戦略
- 主要10社の製品マッピング
- 競合ダッシュボード
- 競合ヒートマップ
- 主要企業のポジショニング、2022年
第9章 企業プロファイル
- Trelleborg Marine and Infrastructure
- Henry Company, LLC
- M/S Metro Rubber Corporation
- CE Construction Solutions
- BoMetals, Inc.
- Foshan Nanhai Fufujing Plastic & Hardware Co.,ltd.
- MCT GROUP OF COMPANIES
- Mapei Construction Products India Pvt Ltd
- Kantaflex(India)Private Ltd.
- W. R. Meadows, Inc.
LIST OF TABLES
- TABLE 01. GLOBAL WATERSTOP MARKET, BY PRODUCT, 2022-2032 ($MILLION)
- TABLE 02. WATERSTOP MARKET FOR PVC WATERSTOP, BY REGION, 2022-2032 ($MILLION)
- TABLE 03. WATERSTOP MARKET FOR RUBBER WATERSTOP, BY REGION, 2022-2032 ($MILLION)
- TABLE 04. WATERSTOP MARKET FOR METAL WATERSTOP, BY REGION, 2022-2032 ($MILLION)
- TABLE 05. WATERSTOP MARKET FOR OTHERS, BY REGION, 2022-2032 ($MILLION)
- TABLE 06. GLOBAL WATERSTOP MARKET, BY APPLICATION, 2022-2032 ($MILLION)
- TABLE 07. WATERSTOP MARKET FOR CONSTRUCTION JOINTS, BY REGION, 2022-2032 ($MILLION)
- TABLE 08. WATERSTOP MARKET FOR PIPE PENETRATION, BY REGION, 2022-2032 ($MILLION)
- TABLE 09. WATERSTOP MARKET FOR EXPANSION JOINTS, BY REGION, 2022-2032 ($MILLION)
- TABLE 10. WATERSTOP MARKET FOR TUNNELS AND UNDERGROUND STRUCTURES, BY REGION, 2022-2032 ($MILLION)
- TABLE 11. WATERSTOP MARKET FOR OTHERS, BY REGION, 2022-2032 ($MILLION)
- TABLE 12. GLOBAL WATERSTOP MARKET, BY END USE, 2022-2032 ($MILLION)
- TABLE 13. WATERSTOP MARKET FOR COMMERCIAL, BY REGION, 2022-2032 ($MILLION)
- TABLE 14. WATERSTOP MARKET FOR RESIDENTIAL, BY REGION, 2022-2032 ($MILLION)
- TABLE 15. WATERSTOP MARKET FOR OTHERS, BY REGION, 2022-2032 ($MILLION)
- TABLE 16. WATERSTOP MARKET, BY REGION, 2022-2032 ($MILLION)
- TABLE 17. NORTH AMERICA WATERSTOP MARKET, BY PRODUCT, 2022-2032 ($MILLION)
- TABLE 18. NORTH AMERICA WATERSTOP MARKET, BY APPLICATION, 2022-2032 ($MILLION)
- TABLE 19. NORTH AMERICA WATERSTOP MARKET, BY END USE, 2022-2032 ($MILLION)
- TABLE 20. NORTH AMERICA WATERSTOP MARKET, BY COUNTRY, 2022-2032 ($MILLION)
- TABLE 21. U.S. WATERSTOP MARKET, BY PRODUCT, 2022-2032 ($MILLION)
- TABLE 22. U.S. WATERSTOP MARKET, BY APPLICATION, 2022-2032 ($MILLION)
- TABLE 23. U.S. WATERSTOP MARKET, BY END USE, 2022-2032 ($MILLION)
- TABLE 24. CANADA WATERSTOP MARKET, BY PRODUCT, 2022-2032 ($MILLION)
- TABLE 25. CANADA WATERSTOP MARKET, BY APPLICATION, 2022-2032 ($MILLION)
- TABLE 26. CANADA WATERSTOP MARKET, BY END USE, 2022-2032 ($MILLION)
- TABLE 27. MEXICO WATERSTOP MARKET, BY PRODUCT, 2022-2032 ($MILLION)
- TABLE 28. MEXICO WATERSTOP MARKET, BY APPLICATION, 2022-2032 ($MILLION)
- TABLE 29. MEXICO WATERSTOP MARKET, BY END USE, 2022-2032 ($MILLION)
- TABLE 30. EUROPE WATERSTOP MARKET, BY PRODUCT, 2022-2032 ($MILLION)
- TABLE 31. EUROPE WATERSTOP MARKET, BY APPLICATION, 2022-2032 ($MILLION)
- TABLE 32. EUROPE WATERSTOP MARKET, BY END USE, 2022-2032 ($MILLION)
- TABLE 33. EUROPE WATERSTOP MARKET, BY COUNTRY, 2022-2032 ($MILLION)
- TABLE 34. GERMANY WATERSTOP MARKET, BY PRODUCT, 2022-2032 ($MILLION)
- TABLE 35. GERMANY WATERSTOP MARKET, BY APPLICATION, 2022-2032 ($MILLION)
- TABLE 36. GERMANY WATERSTOP MARKET, BY END USE, 2022-2032 ($MILLION)
- TABLE 37. UK WATERSTOP MARKET, BY PRODUCT, 2022-2032 ($MILLION)
- TABLE 38. UK WATERSTOP MARKET, BY APPLICATION, 2022-2032 ($MILLION)
- TABLE 39. UK WATERSTOP MARKET, BY END USE, 2022-2032 ($MILLION)
- TABLE 40. FRANCE WATERSTOP MARKET, BY PRODUCT, 2022-2032 ($MILLION)
- TABLE 41. FRANCE WATERSTOP MARKET, BY APPLICATION, 2022-2032 ($MILLION)
- TABLE 42. FRANCE WATERSTOP MARKET, BY END USE, 2022-2032 ($MILLION)
- TABLE 43. SPAIN WATERSTOP MARKET, BY PRODUCT, 2022-2032 ($MILLION)
- TABLE 44. SPAIN WATERSTOP MARKET, BY APPLICATION, 2022-2032 ($MILLION)
- TABLE 45. SPAIN WATERSTOP MARKET, BY END USE, 2022-2032 ($MILLION)
- TABLE 46. ITALY WATERSTOP MARKET, BY PRODUCT, 2022-2032 ($MILLION)
- TABLE 47. ITALY WATERSTOP MARKET, BY APPLICATION, 2022-2032 ($MILLION)
- TABLE 48. ITALY WATERSTOP MARKET, BY END USE, 2022-2032 ($MILLION)
- TABLE 49. REST OF EUROPE WATERSTOP MARKET, BY PRODUCT, 2022-2032 ($MILLION)
- TABLE 50. REST OF EUROPE WATERSTOP MARKET, BY APPLICATION, 2022-2032 ($MILLION)
- TABLE 51. REST OF EUROPE WATERSTOP MARKET, BY END USE, 2022-2032 ($MILLION)
- TABLE 52. ASIA-PACIFIC WATERSTOP MARKET, BY PRODUCT, 2022-2032 ($MILLION)
- TABLE 53. ASIA-PACIFIC WATERSTOP MARKET, BY APPLICATION, 2022-2032 ($MILLION)
- TABLE 54. ASIA-PACIFIC WATERSTOP MARKET, BY END USE, 2022-2032 ($MILLION)
- TABLE 55. ASIA-PACIFIC WATERSTOP MARKET, BY COUNTRY, 2022-2032 ($MILLION)
- TABLE 56. CHINA WATERSTOP MARKET, BY PRODUCT, 2022-2032 ($MILLION)
- TABLE 57. CHINA WATERSTOP MARKET, BY APPLICATION, 2022-2032 ($MILLION)
- TABLE 58. CHINA WATERSTOP MARKET, BY END USE, 2022-2032 ($MILLION)
- TABLE 59. JAPAN WATERSTOP MARKET, BY PRODUCT, 2022-2032 ($MILLION)
- TABLE 60. JAPAN WATERSTOP MARKET, BY APPLICATION, 2022-2032 ($MILLION)
- TABLE 61. JAPAN WATERSTOP MARKET, BY END USE, 2022-2032 ($MILLION)
- TABLE 62. INDIA WATERSTOP MARKET, BY PRODUCT, 2022-2032 ($MILLION)
- TABLE 63. INDIA WATERSTOP MARKET, BY APPLICATION, 2022-2032 ($MILLION)
- TABLE 64. INDIA WATERSTOP MARKET, BY END USE, 2022-2032 ($MILLION)
- TABLE 65. SOUTH KOREA WATERSTOP MARKET, BY PRODUCT, 2022-2032 ($MILLION)
- TABLE 66. SOUTH KOREA WATERSTOP MARKET, BY APPLICATION, 2022-2032 ($MILLION)
- TABLE 67. SOUTH KOREA WATERSTOP MARKET, BY END USE, 2022-2032 ($MILLION)
- TABLE 68. AUSTRALIA WATERSTOP MARKET, BY PRODUCT, 2022-2032 ($MILLION)
- TABLE 69. AUSTRALIA WATERSTOP MARKET, BY APPLICATION, 2022-2032 ($MILLION)
- TABLE 70. AUSTRALIA WATERSTOP MARKET, BY END USE, 2022-2032 ($MILLION)
- TABLE 71. REST OF ASIA-PACIFIC WATERSTOP MARKET, BY PRODUCT, 2022-2032 ($MILLION)
- TABLE 72. REST OF ASIA-PACIFIC WATERSTOP MARKET, BY APPLICATION, 2022-2032 ($MILLION)
- TABLE 73. REST OF ASIA-PACIFIC WATERSTOP MARKET, BY END USE, 2022-2032 ($MILLION)
- TABLE 74. LAMEA WATERSTOP MARKET, BY PRODUCT, 2022-2032 ($MILLION)
- TABLE 75. LAMEA WATERSTOP MARKET, BY APPLICATION, 2022-2032 ($MILLION)
- TABLE 76. LAMEA WATERSTOP MARKET, BY END USE, 2022-2032 ($MILLION)
- TABLE 77. LAMEA WATERSTOP MARKET, BY COUNTRY, 2022-2032 ($MILLION)
- TABLE 78. BRAZIL WATERSTOP MARKET, BY PRODUCT, 2022-2032 ($MILLION)
- TABLE 79. BRAZIL WATERSTOP MARKET, BY APPLICATION, 2022-2032 ($MILLION)
- TABLE 80. BRAZIL WATERSTOP MARKET, BY END USE, 2022-2032 ($MILLION)
- TABLE 81. SOUTH AFRICA, WATERSTOP MARKET, BY PRODUCT, 2022-2032 ($MILLION)
- TABLE 82. SOUTH AFRICA, WATERSTOP MARKET, BY APPLICATION, 2022-2032 ($MILLION)
- TABLE 83. SOUTH AFRICA, WATERSTOP MARKET, BY END USE, 2022-2032 ($MILLION)
- TABLE 84. SAUDI ARABIA WATERSTOP MARKET, BY PRODUCT, 2022-2032 ($MILLION)
- TABLE 85. SAUDI ARABIA WATERSTOP MARKET, BY APPLICATION, 2022-2032 ($MILLION)
- TABLE 86. SAUDI ARABIA WATERSTOP MARKET, BY END USE, 2022-2032 ($MILLION)
- TABLE 87. REST OF LAMEA WATERSTOP MARKET, BY PRODUCT, 2022-2032 ($MILLION)
- TABLE 88. REST OF LAMEA WATERSTOP MARKET, BY APPLICATION, 2022-2032 ($MILLION)
- TABLE 89. REST OF LAMEA WATERSTOP MARKET, BY END USE, 2022-2032 ($MILLION)
- TABLE 90. TRELLEBORG MARINE AND INFRASTRUCTURE: KEY EXECUTIVES
- TABLE 91. TRELLEBORG MARINE AND INFRASTRUCTURE: COMPANY SNAPSHOT
- TABLE 92. TRELLEBORG MARINE AND INFRASTRUCTURE: SERVICE SEGMENTS
- TABLE 93. TRELLEBORG MARINE AND INFRASTRUCTURE: PRODUCT PORTFOLIO
- TABLE 94. HENRY COMPANY, LLC: KEY EXECUTIVES
- TABLE 95. HENRY COMPANY, LLC: COMPANY SNAPSHOT
- TABLE 96. HENRY COMPANY, LLC: PRODUCT SEGMENTS
- TABLE 97. HENRY COMPANY, LLC: PRODUCT PORTFOLIO
- TABLE 98. M/S METRO RUBBER CORPORATION: KEY EXECUTIVES
- TABLE 99. M/S METRO RUBBER CORPORATION: COMPANY SNAPSHOT
- TABLE 100. M/S METRO RUBBER CORPORATION: PRODUCT SEGMENTS
- TABLE 101. M/S METRO RUBBER CORPORATION: PRODUCT PORTFOLIO
- TABLE 102. CE CONSTRUCTION SOLUTIONS: KEY EXECUTIVES
- TABLE 103. CE CONSTRUCTION SOLUTIONS: COMPANY SNAPSHOT
- TABLE 104. CE CONSTRUCTION SOLUTIONS: PRODUCT SEGMENTS
- TABLE 105. CE CONSTRUCTION SOLUTIONS: PRODUCT PORTFOLIO
- TABLE 106. BOMETALS, INC.: KEY EXECUTIVES
- TABLE 107. BOMETALS, INC.: COMPANY SNAPSHOT
- TABLE 108. BOMETALS, INC.: PRODUCT SEGMENTS
- TABLE 109. BOMETALS, INC.: PRODUCT PORTFOLIO
- TABLE 110. FOSHAN NANHAI FUFUJING PLASTIC & HARDWARE CO.,LTD.: KEY EXECUTIVES
- TABLE 111. FOSHAN NANHAI FUFUJING PLASTIC & HARDWARE CO.,LTD.: COMPANY SNAPSHOT
- TABLE 112. FOSHAN NANHAI FUFUJING PLASTIC & HARDWARE CO.,LTD.: PRODUCT SEGMENTS
- TABLE 113. FOSHAN NANHAI FUFUJING PLASTIC & HARDWARE CO.,LTD.: PRODUCT PORTFOLIO
- TABLE 114. MCT GROUP OF COMPANIES: KEY EXECUTIVES
- TABLE 115. MCT GROUP OF COMPANIES: COMPANY SNAPSHOT
- TABLE 116. MCT GROUP OF COMPANIES: PRODUCT SEGMENTS
- TABLE 117. MCT GROUP OF COMPANIES: PRODUCT PORTFOLIO
- TABLE 118. MAPEI CONSTRUCTION PRODUCTS INDIA PVT LTD: KEY EXECUTIVES
- TABLE 119. MAPEI CONSTRUCTION PRODUCTS INDIA PVT LTD: COMPANY SNAPSHOT
- TABLE 120. MAPEI CONSTRUCTION PRODUCTS INDIA PVT LTD: PRODUCT SEGMENTS
- TABLE 121. MAPEI CONSTRUCTION PRODUCTS INDIA PVT LTD: PRODUCT PORTFOLIO
- TABLE 122. KANTAFLEX (INDIA) PRIVATE LTD.: KEY EXECUTIVES
- TABLE 123. KANTAFLEX (INDIA) PRIVATE LTD.: COMPANY SNAPSHOT
- TABLE 124. KANTAFLEX (INDIA) PRIVATE LTD.: PRODUCT SEGMENTS
- TABLE 125. KANTAFLEX (INDIA) PRIVATE LTD.: PRODUCT PORTFOLIO
- TABLE 126. W. R. MEADOWS, INC.: KEY EXECUTIVES
- TABLE 127. W. R. MEADOWS, INC.: COMPANY SNAPSHOT
- TABLE 128. W. R. MEADOWS, INC.: PRODUCT SEGMENTS
- TABLE 129. W. R. MEADOWS, INC.: PRODUCT PORTFOLIO
- TABLE 130. W. R. MEADOWS, INC.: KEY STRATERGIES
LIST OF FIGURES
- FIGURE 01. WATERSTOP MARKET, 2022-2032
- FIGURE 02. SEGMENTATION OF WATERSTOP MARKET,2022-2032
- FIGURE 03. TOP IMPACTING FACTORS IN WATERSTOP MARKET (2022 TO 2032)
- FIGURE 04. TOP INVESTMENT POCKETS IN WATERSTOP MARKET (2023-2032)
- FIGURE 05. LOW BARGAINING POWER OF SUPPLIERS
- FIGURE 06. LOW THREAT OF NEW ENTRANTS
- FIGURE 07. LOW THREAT OF SUBSTITUTES
- FIGURE 08. LOW INTENSITY OF RIVALRY
- FIGURE 09. LOW BARGAINING POWER OF BUYERS
- FIGURE 10. GLOBAL WATERSTOP MARKET:DRIVERS, RESTRAINTS AND OPPORTUNITIES
- FIGURE 11. IMPACT OF KEY REGULATION: WATERSTOP MARKET
- FIGURE 12. PATENT ANALYSIS BY COMPANY
- FIGURE 13. PATENT ANALYSIS BY COUNTRY
- FIGURE 14. WATERSTOP MARKET, BY PRODUCT, 2022 AND 2032(%)
- FIGURE 15. COMPARATIVE SHARE ANALYSIS OF WATERSTOP MARKET FOR PVC WATERSTOP, BY COUNTRY 2022 AND 2032(%)
- FIGURE 16. COMPARATIVE SHARE ANALYSIS OF WATERSTOP MARKET FOR RUBBER WATERSTOP, BY COUNTRY 2022 AND 2032(%)
- FIGURE 17. COMPARATIVE SHARE ANALYSIS OF WATERSTOP MARKET FOR METAL WATERSTOP, BY COUNTRY 2022 AND 2032(%)
- FIGURE 18. COMPARATIVE SHARE ANALYSIS OF WATERSTOP MARKET FOR OTHERS, BY COUNTRY 2022 AND 2032(%)
- FIGURE 19. WATERSTOP MARKET, BY APPLICATION, 2022 AND 2032(%)
- FIGURE 20. COMPARATIVE SHARE ANALYSIS OF WATERSTOP MARKET FOR CONSTRUCTION JOINTS, BY COUNTRY 2022 AND 2032(%)
- FIGURE 21. COMPARATIVE SHARE ANALYSIS OF WATERSTOP MARKET FOR PIPE PENETRATION, BY COUNTRY 2022 AND 2032(%)
- FIGURE 22. COMPARATIVE SHARE ANALYSIS OF WATERSTOP MARKET FOR EXPANSION JOINTS, BY COUNTRY 2022 AND 2032(%)
- FIGURE 23. COMPARATIVE SHARE ANALYSIS OF WATERSTOP MARKET FOR TUNNELS AND UNDERGROUND STRUCTURES, BY COUNTRY 2022 AND 2032(%)
- FIGURE 24. COMPARATIVE SHARE ANALYSIS OF WATERSTOP MARKET FOR OTHERS, BY COUNTRY 2022 AND 2032(%)
- FIGURE 25. WATERSTOP MARKET, BY END USE, 2022 AND 2032(%)
- FIGURE 26. COMPARATIVE SHARE ANALYSIS OF WATERSTOP MARKET FOR COMMERCIAL, BY COUNTRY 2022 AND 2032(%)
- FIGURE 27. COMPARATIVE SHARE ANALYSIS OF WATERSTOP MARKET FOR RESIDENTIAL, BY COUNTRY 2022 AND 2032(%)
- FIGURE 28. COMPARATIVE SHARE ANALYSIS OF WATERSTOP MARKET FOR OTHERS, BY COUNTRY 2022 AND 2032(%)
- FIGURE 29. WATERSTOP MARKET BY REGION, 2022 AND 2032(%)
- FIGURE 30. U.S. WATERSTOP MARKET, 2022-2032 ($MILLION)
- FIGURE 31. CANADA WATERSTOP MARKET, 2022-2032 ($MILLION)
- FIGURE 32. MEXICO WATERSTOP MARKET, 2022-2032 ($MILLION)
- FIGURE 33. GERMANY WATERSTOP MARKET, 2022-2032 ($MILLION)
- FIGURE 34. UK WATERSTOP MARKET, 2022-2032 ($MILLION)
- FIGURE 35. FRANCE WATERSTOP MARKET, 2022-2032 ($MILLION)
- FIGURE 36. SPAIN WATERSTOP MARKET, 2022-2032 ($MILLION)
- FIGURE 37. ITALY WATERSTOP MARKET, 2022-2032 ($MILLION)
- FIGURE 38. REST OF EUROPE WATERSTOP MARKET, 2022-2032 ($MILLION)
- FIGURE 39. CHINA WATERSTOP MARKET, 2022-2032 ($MILLION)
- FIGURE 40. JAPAN WATERSTOP MARKET, 2022-2032 ($MILLION)
- FIGURE 41. INDIA WATERSTOP MARKET, 2022-2032 ($MILLION)
- FIGURE 42. SOUTH KOREA WATERSTOP MARKET, 2022-2032 ($MILLION)
- FIGURE 43. AUSTRALIA WATERSTOP MARKET, 2022-2032 ($MILLION)
- FIGURE 44. REST OF ASIA-PACIFIC WATERSTOP MARKET, 2022-2032 ($MILLION)
- FIGURE 45. BRAZIL WATERSTOP MARKET, 2022-2032 ($MILLION)
- FIGURE 46. SOUTH AFRICA, WATERSTOP MARKET, 2022-2032 ($MILLION)
- FIGURE 47. SAUDI ARABIA WATERSTOP MARKET, 2022-2032 ($MILLION)
- FIGURE 48. REST OF LAMEA WATERSTOP MARKET, 2022-2032 ($MILLION)
- FIGURE 49. TOP WINNING STRATEGIES, BY YEAR (2022)
- FIGURE 50. TOP WINNING STRATEGIES, BY DEVELOPMENT (2022)
- FIGURE 51. TOP WINNING STRATEGIES, BY COMPANY (2022)
- FIGURE 52. PRODUCT MAPPING OF TOP 10 PLAYERS
- FIGURE 53. COMPETITIVE DASHBOARD
- FIGURE 54. COMPETITIVE HEATMAP: WATERSTOP MARKET
- FIGURE 55. TOP PLAYER POSITIONING, 2022
- FIGURE 56. TRELLEBORG MARINE AND INFRASTRUCTURE: NET SALES, 2020-2022 ($MILLION)
- FIGURE 57. TRELLEBORG MARINE AND INFRASTRUCTURE: REVENUE SHARE BY REGION, 2022 (%)
- FIGURE 58. TRELLEBORG MARINE AND INFRASTRUCTURE: REVENUE SHARE BY SEGMENT, 2022 (%)
According to a new report published by Allied Market Research, titled, "Waterstop Market," The waterstop market was valued at $2.8 billion in 2022, and is estimated to reach $4.6 billion by 2032, growing at a CAGR of 5.1% from 2023 to 2032.
Technological advancements can disrupt the market by making existing products or materials obsolete while technological advancements can drive market growth. Increase in emphasis on sustainability and green building practices require the development of more eco-friendly waterstop materials, which can add complexity and costs. This factor is projected to hamper market growth during the forecast period. The expansion of global markets and international trade has created opportunities for industrial sectors to tap into a larger customer base, leading to increased production and waterstop market growth.
Industries such as mining, chemical processing, and manufacturing often require containment systems to manage water or chemical solutions. Waterstops play a role in ensuring containment and preventing leakage in industrial applications. These factors together escalate the growth and potential sales of waterstop in the industrial sectors.
The waterstop market is segmented on the basis of product, application, end use, and region. On the basis of product, it is categorized into PVC waterstop, rubber waterstop, metal waterstop, and others. On the basis of application, the market is categorized into construction joints, pipe penetration, expansion joints, tunnels and underground structures, and others. On the basis of end use, it is divided into commercial, residential, and others. On the basis of region, the market is studied across North America, Europe, Asia-Pacific, and LAMEA.
The report covers the strategies adopted by key players in the market to sustain the competitive environment and increase their market share. The key players operating in the global waterstop market include Trelleborg Ridderkerk BV, Henry Company, LLC.. Metro Rubber Corporation, Kantaflex (India) Private Ltd., , Krystol Group, CE construction solution, Bo Metals, Inc., Foshan NanhaiFufujing Plastic and Hardware Company Limited., MCT Group of Companies, and Mapei Construction Products India Pvt. Ltd. In addition, the market drivers, restraints, and opportunities are explained in the report.
Key Benefits For Stakeholders
- This report provides a quantitative analysis of the market segments, current trends, estimations, and dynamics of the waterstop market analysis from 2022 to 2032 to identify the prevailing waterstop market opportunities.
- The market research is offered along with information related to key drivers, restraints, and opportunities.
- Porter's five forces analysis highlights the potency of buyers and suppliers to enable stakeholders make profit-oriented business decisions and strengthen their supplier-buyer network.
- In-depth analysis of the waterstop market segmentation assists to determine the prevailing market opportunities.
- Major countries in each region are mapped according to their revenue contribution to the global market.
- Market player positioning facilitates benchmarking and provides a clear understanding of the present position of the market players.
- The report includes the analysis of the regional as well as global waterstop market trends, key players, market segments, application areas, and market growth strategies.
Additional benefits you will get with this purchase are:
- Quarterly Update and* (only available with a corporate license, on listed price)
- 5 additional Company Profile of client Choice pre- or Post-purchase, as a free update.
- Free Upcoming Version on the Purchase of Five and Enterprise User License.
- 16 analyst hours of support* (post-purchase, if you find additional data requirements upon review of the report, you may receive support amounting to 16 analyst hours to solve questions, and post-sale queries)
- 15% Free Customization* (in case the scope or segment of the report does not match your requirements, 15% is equivalent to 3 working days of free work, applicable once)
- Free data Pack on the Five and Enterprise User License. (Excel version of the report)
- Free Updated report if the report is 6-12 months old or older.
- 24-hour priority response*
- Free Industry updates and white papers.
Possible Customization with this report (with additional cost and timeline, please talk to the sales executive to know more)
- Investment Opportunities
- Product Benchmarking / Product specification and applications
- Product Life Cycles
- Patient/epidemiology data at country, region, global level
- Strategic Recommedations
- Historic market data
- Key player details (including location, contact details, supplier/vendor network etc. in excel format)
- List of customers/consumers/raw material suppliers- value chain analysis
- Per Capita Consumption Trends
- Product Consumption Analysis
Key Market Segments
By Application
- Construction joints
- Pipe penetration
- Expansion joints
- Tunnels and Underground Structures
- Others
By Product
- PVC Waterstop
- Rubber Waterstop
- Metal Waterstop
- Others
By End Use
- Commercial
- Residential
- Others
By Region
- North America
- U.S.
- Canada
- Mexico
- Europe
- Germany
- UK
- France
- Spain
- Italy
- Rest of Europe
- Asia-Pacific
- China
- Japan
- India
- South Korea
- Australia
- Rest of Asia-Pacific
- LAMEA
- Brazil
- South Africa,
- Saudi Arabia
- Rest of LAMEA
Key Market Players:
- Henry Company, LLC
- M/S Metro Rubber Corporation
- BoMetals, Inc.
- MCT GROUP OF COMPANIES
- Kantaflex (India) Private Ltd.
- Foshan Nanhai Fufujing Plastic & Hardware Co.,ltd.
- CE Construction Solutions
- Trelleborg Marine and Infrastructure
- W. R. Meadows, Inc.
- Mapei Construction Products India Pvt Ltd
TABLE OF CONTENTS
CHAPTER 1: INTRODUCTION
- 1.1. Report description
- 1.2. Key market segments
- 1.3. Key benefits to the stakeholders
- 1.4. Research methodology
- 1.4.1. Primary research
- 1.4.2. Secondary research
- 1.4.3. Analyst tools and models
CHAPTER 2: EXECUTIVE SUMMARY
- 2.1. CXO Perspective
CHAPTER 3: MARKET OVERVIEW
- 3.1. Market definition and scope
- 3.2. Key findings
- 3.2.1. Top impacting factors
- 3.2.2. Top investment pockets
- 3.3. Porter's five forces analysis
- 3.3.1. Low bargaining power of suppliers
- 3.3.2. Low threat of new entrants
- 3.3.3. Low threat of substitutes
- 3.3.4. Low intensity of rivalry
- 3.3.5. Low bargaining power of buyers
- 3.4. Market dynamics
- 3.4.1. Drivers
- 3.4.1.1. Increase in penetration of waterstop in infrastructure
- 3.4.1.2. Robust demand from commercial sectors
- 3.4.2. Restraints
- 3.4.2.1. Supply chain disruption, environmental standards, and technological advancements
- 3.4.3. Opportunities
- 3.4.3.1. Escalation in demand from industrial sectors
- 3.4.1. Drivers
- 3.5. Value Chain Analysis
- 3.6. Key Regulation Analysis
- 3.7. Patent Landscape
CHAPTER 4: WATERSTOP MARKET, BY PRODUCT
- 4.1. Overview
- 4.1.1. Market size and forecast
- 4.2. PVC Waterstop
- 4.2.1. Key market trends, growth factors and opportunities
- 4.2.2. Market size and forecast, by region
- 4.2.3. Market share analysis by country
- 4.3. Rubber Waterstop
- 4.3.1. Key market trends, growth factors and opportunities
- 4.3.2. Market size and forecast, by region
- 4.3.3. Market share analysis by country
- 4.4. Metal Waterstop
- 4.4.1. Key market trends, growth factors and opportunities
- 4.4.2. Market size and forecast, by region
- 4.4.3. Market share analysis by country
- 4.5. Others
- 4.5.1. Key market trends, growth factors and opportunities
- 4.5.2. Market size and forecast, by region
- 4.5.3. Market share analysis by country
CHAPTER 5: WATERSTOP MARKET, BY APPLICATION
- 5.1. Overview
- 5.1.1. Market size and forecast
- 5.2. Construction joints
- 5.2.1. Key market trends, growth factors and opportunities
- 5.2.2. Market size and forecast, by region
- 5.2.3. Market share analysis by country
- 5.3. Pipe penetration
- 5.3.1. Key market trends, growth factors and opportunities
- 5.3.2. Market size and forecast, by region
- 5.3.3. Market share analysis by country
- 5.4. Expansion joints
- 5.4.1. Key market trends, growth factors and opportunities
- 5.4.2. Market size and forecast, by region
- 5.4.3. Market share analysis by country
- 5.5. Tunnels and Underground Structures
- 5.5.1. Key market trends, growth factors and opportunities
- 5.5.2. Market size and forecast, by region
- 5.5.3. Market share analysis by country
- 5.6. Others
- 5.6.1. Key market trends, growth factors and opportunities
- 5.6.2. Market size and forecast, by region
- 5.6.3. Market share analysis by country
CHAPTER 6: WATERSTOP MARKET, BY END USE
- 6.1. Overview
- 6.1.1. Market size and forecast
- 6.2. Commercial
- 6.2.1. Key market trends, growth factors and opportunities
- 6.2.2. Market size and forecast, by region
- 6.2.3. Market share analysis by country
- 6.3. Residential
- 6.3.1. Key market trends, growth factors and opportunities
- 6.3.2. Market size and forecast, by region
- 6.3.3. Market share analysis by country
- 6.4. Others
- 6.4.1. Key market trends, growth factors and opportunities
- 6.4.2. Market size and forecast, by region
- 6.4.3. Market share analysis by country
CHAPTER 7: WATERSTOP MARKET, BY REGION
- 7.1. Overview
- 7.1.1. Market size and forecast By Region
- 7.2. North America
- 7.2.1. Key market trends, growth factors and opportunities
- 7.2.2. Market size and forecast, by Product
- 7.2.3. Market size and forecast, by Application
- 7.2.4. Market size and forecast, by End Use
- 7.2.5. Market size and forecast, by country
- 7.2.5.1. U.S.
- 7.2.5.1.1. Market size and forecast, by Product
- 7.2.5.1.2. Market size and forecast, by Application
- 7.2.5.1.3. Market size and forecast, by End Use
- 7.2.5.2. Canada
- 7.2.5.2.1. Market size and forecast, by Product
- 7.2.5.2.2. Market size and forecast, by Application
- 7.2.5.2.3. Market size and forecast, by End Use
- 7.2.5.3. Mexico
- 7.2.5.3.1. Market size and forecast, by Product
- 7.2.5.3.2. Market size and forecast, by Application
- 7.2.5.3.3. Market size and forecast, by End Use
- 7.3. Europe
- 7.3.1. Key market trends, growth factors and opportunities
- 7.3.2. Market size and forecast, by Product
- 7.3.3. Market size and forecast, by Application
- 7.3.4. Market size and forecast, by End Use
- 7.3.5. Market size and forecast, by country
- 7.3.5.1. Germany
- 7.3.5.1.1. Market size and forecast, by Product
- 7.3.5.1.2. Market size and forecast, by Application
- 7.3.5.1.3. Market size and forecast, by End Use
- 7.3.5.2. UK
- 7.3.5.2.1. Market size and forecast, by Product
- 7.3.5.2.2. Market size and forecast, by Application
- 7.3.5.2.3. Market size and forecast, by End Use
- 7.3.5.3. France
- 7.3.5.3.1. Market size and forecast, by Product
- 7.3.5.3.2. Market size and forecast, by Application
- 7.3.5.3.3. Market size and forecast, by End Use
- 7.3.5.4. Spain
- 7.3.5.4.1. Market size and forecast, by Product
- 7.3.5.4.2. Market size and forecast, by Application
- 7.3.5.4.3. Market size and forecast, by End Use
- 7.3.5.5. Italy
- 7.3.5.5.1. Market size and forecast, by Product
- 7.3.5.5.2. Market size and forecast, by Application
- 7.3.5.5.3. Market size and forecast, by End Use
- 7.3.5.6. Rest of Europe
- 7.3.5.6.1. Market size and forecast, by Product
- 7.3.5.6.2. Market size and forecast, by Application
- 7.3.5.6.3. Market size and forecast, by End Use
- 7.4. Asia-Pacific
- 7.4.1. Key market trends, growth factors and opportunities
- 7.4.2. Market size and forecast, by Product
- 7.4.3. Market size and forecast, by Application
- 7.4.4. Market size and forecast, by End Use
- 7.4.5. Market size and forecast, by country
- 7.4.5.1. China
- 7.4.5.1.1. Market size and forecast, by Product
- 7.4.5.1.2. Market size and forecast, by Application
- 7.4.5.1.3. Market size and forecast, by End Use
- 7.4.5.2. Japan
- 7.4.5.2.1. Market size and forecast, by Product
- 7.4.5.2.2. Market size and forecast, by Application
- 7.4.5.2.3. Market size and forecast, by End Use
- 7.4.5.3. India
- 7.4.5.3.1. Market size and forecast, by Product
- 7.4.5.3.2. Market size and forecast, by Application
- 7.4.5.3.3. Market size and forecast, by End Use
- 7.4.5.4. South Korea
- 7.4.5.4.1. Market size and forecast, by Product
- 7.4.5.4.2. Market size and forecast, by Application
- 7.4.5.4.3. Market size and forecast, by End Use
- 7.4.5.5. Australia
- 7.4.5.5.1. Market size and forecast, by Product
- 7.4.5.5.2. Market size and forecast, by Application
- 7.4.5.5.3. Market size and forecast, by End Use
- 7.4.5.6. Rest of Asia-Pacific
- 7.4.5.6.1. Market size and forecast, by Product
- 7.4.5.6.2. Market size and forecast, by Application
- 7.4.5.6.3. Market size and forecast, by End Use
- 7.5. LAMEA
- 7.5.1. Key market trends, growth factors and opportunities
- 7.5.2. Market size and forecast, by Product
- 7.5.3. Market size and forecast, by Application
- 7.5.4. Market size and forecast, by End Use
- 7.5.5. Market size and forecast, by country
- 7.5.5.1. Brazil
- 7.5.5.1.1. Market size and forecast, by Product
- 7.5.5.1.2. Market size and forecast, by Application
- 7.5.5.1.3. Market size and forecast, by End Use
- 7.5.5.2. South Africa,
- 7.5.5.2.1. Market size and forecast, by Product
- 7.5.5.2.2. Market size and forecast, by Application
- 7.5.5.2.3. Market size and forecast, by End Use
- 7.5.5.3. Saudi Arabia
- 7.5.5.3.1. Market size and forecast, by Product
- 7.5.5.3.2. Market size and forecast, by Application
- 7.5.5.3.3. Market size and forecast, by End Use
- 7.5.5.4. Rest of LAMEA
- 7.5.5.4.1. Market size and forecast, by Product
- 7.5.5.4.2. Market size and forecast, by Application
- 7.5.5.4.3. Market size and forecast, by End Use
CHAPTER 8: COMPETITIVE LANDSCAPE
- 8.1. Introduction
- 8.2. Top winning strategies
- 8.3. Product mapping of top 10 player
- 8.4. Competitive dashboard
- 8.5. Competitive heatmap
- 8.6. Top player positioning, 2022
CHAPTER 9: COMPANY PROFILES
- 9.1. Trelleborg Marine and Infrastructure
- 9.1.1. Company overview
- 9.1.2. Key executives
- 9.1.3. Company snapshot
- 9.1.4. Operating business segments
- 9.1.5. Product portfolio
- 9.1.6. Business performance
- 9.2. Henry Company, LLC
- 9.2.1. Company overview
- 9.2.2. Key executives
- 9.2.3. Company snapshot
- 9.2.4. Operating business segments
- 9.2.5. Product portfolio
- 9.3. M/S Metro Rubber Corporation
- 9.3.1. Company overview
- 9.3.2. Key executives
- 9.3.3. Company snapshot
- 9.3.4. Operating business segments
- 9.3.5. Product portfolio
- 9.4. CE Construction Solutions
- 9.4.1. Company overview
- 9.4.2. Key executives
- 9.4.3. Company snapshot
- 9.4.4. Operating business segments
- 9.4.5. Product portfolio
- 9.5. BoMetals, Inc.
- 9.5.1. Company overview
- 9.5.2. Key executives
- 9.5.3. Company snapshot
- 9.5.4. Operating business segments
- 9.5.5. Product portfolio
- 9.6. Foshan Nanhai Fufujing Plastic & Hardware Co.,ltd.
- 9.6.1. Company overview
- 9.6.2. Key executives
- 9.6.3. Company snapshot
- 9.6.4. Operating business segments
- 9.6.5. Product portfolio
- 9.7. MCT GROUP OF COMPANIES
- 9.7.1. Company overview
- 9.7.2. Key executives
- 9.7.3. Company snapshot
- 9.7.4. Operating business segments
- 9.7.5. Product portfolio
- 9.8. Mapei Construction Products India Pvt Ltd
- 9.8.1. Company overview
- 9.8.2. Key executives
- 9.8.3. Company snapshot
- 9.8.4. Operating business segments
- 9.8.5. Product portfolio
- 9.9. Kantaflex (India) Private Ltd.
- 9.9.1. Company overview
- 9.9.2. Key executives
- 9.9.3. Company snapshot
- 9.9.4. Operating business segments
- 9.9.5. Product portfolio
- 9.10. W. R. Meadows, Inc.
- 9.10.1. Company overview
- 9.10.2. Key executives
- 9.10.3. Company snapshot
- 9.10.4. Operating business segments
- 9.10.5. Product portfolio
- 9.10.6. Key strategic moves and developments
