 |
市場調査レポート
商品コード
1414759
子供向け娯楽施設市場:訪問者層別、施設規模別、収益源別、活動エリア別:世界の機会分析と産業予測、2023年~2032年Children Entertainment Centers Market By Visitor Demographic, By Facility Size, By Revenue Source, By Activity Area : Global Opportunity Analysis and Industry Forecast, 2023-2032 |
||||||

| 子供向け娯楽施設市場:訪問者層別、施設規模別、収益源別、活動エリア別:世界の機会分析と産業予測、2023年~2032年 |
|
出版日: 2023年11月30日
発行: Allied Market Research
ページ情報: 英文 439 Pages
納期: 2~3営業日
|
- 全表示
- 概要
- 図表
- 目次
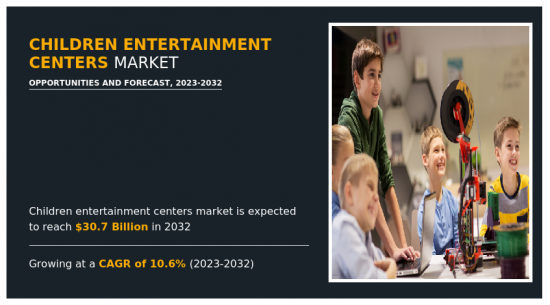
子供向け娯楽施設市場は、2022年には115億米ドルと評価され、2023年から2032年までのCAGRは10.6%で成長し、2032年には307億米ドルに達すると推定されます。
子供向け娯楽施設は設備が整っており、企業イベント、誕生日パーティー、個人的な達成祝いなどのようなプライベートな祝賀会を開催するのに適しています。
一人当たりの可処分所得の増加、多様なゲームやエンターテインメントの選択肢の利用可能性、屋内エンターテインメントへの嗜好の高まり、アジア太平洋地域における良好な若者人口統計が、市場の成長を大きく後押ししています。しかし、家庭用ゲーム機やモバイル機器、初期コストの高さ、チケット価格の上昇が市場成長の妨げになると予想されます。
子供向け娯楽施設は、屋外娯楽施設よりも家族の間でレクリエーションや娯楽として広く好まれています。これは、世界市場の成長を促進すると予想される主な要因のひとつです。しかし、スマートフォン、 ビデオゲームなどの家庭用ゲーム、高額な初期投資が必要であることなどが、市場の成長をある程度阻害すると予想される主な要因です。
目次
第1章 イントロダクション
第2章 エグゼクティブサマリー
第3章 市場概要
- 市場の定義と範囲
- 主な調査結果
- 影響要因
- 主な投資機会
- ポーターのファイブフォース分析
- 市場力学
- 促進要因
- 家族向けアクティビティ、飲食との融合、参加型の遊びをサポートする新しいエンターテインメント・センターの継続的立ち上げ。
- モール数の増加
- 良好な若者人口統計
- 抑制要因
- チケット価格の上昇
- 機会
- 新しいゲームやアトラクションへの投資急増
- 促進要因
第4章 子供向け娯楽施設市場:訪問者層別
- 概要
- 子どものいる家族(0~9歳)
- 子どものいる家族(9~12歳)
- ティーンエイジャー(12~18歳)
- ヤングアダルト(18~24歳)
- 成人(24歳以上)
第5章 子供向け娯楽施設市場:施設規模別
- 概要
- 5,000平方フィート以下
- 5,001~10,000平方フィート
- 10,001~20,000平方フィート
- 20,001~40,000平方フィート
- 1~10エーカー
- 11~30エーカー
- 30エーカー以上
第6章 子供向け娯楽施設市場:収益源別
- 概要
- 入場料およびチケット販売
- 飲食品
- マーチャンダイジング
- 広告収入
- その他
第7章 子供向け娯楽施設市場:活動エリア別
- 概要
- アーケードスタジオ
- ARおよびVRゲームゾーン
- フィジカル・プレイ・アクティビティ
- スキル/競合ゲーム
- その他
第8章 子供向け娯楽施設市場:地域別
- 概要
- 北米
- 米国
- カナダ
- 欧州
- 英国
- ドイツ
- フランス
- イタリア
- スペイン
- その他
- アジア太平洋
- 中国
- 日本
- インド
- オーストラリア
- 韓国
- その他
- ラテンアメリカ
- ラテンアメリカ
- 中東
- アフリカ
第9章 競合情勢
- イントロダクション
- 主要成功戦略
- 主要10社の製品マッピング
- 競合ダッシュボード
- 競合ヒートマップ
- 主要企業のポジショニング、2022年
第10章 企業プロファイル
- The Walt Disney Company
- LEGO System A/S
- Dave and Buster's, Inc.
- LANDMARK GROUP
- Funriders
- KidZania
- SCENE75 ENTERTAINMENT CENTERS LLC
- SMAAASH
- CEC Entertainment Concepts, LP.
- Cinergy Entertainment Group
LIST OF TABLES
- TABLE 01. GLOBAL CHILDREN ENTERTAINMENT CENTERS MARKET, BY VISITOR DEMOGRAPHIC, 2022-2032 ($MILLION)
- TABLE 02. CHILDREN ENTERTAINMENT CENTERS MARKET FOR FAMILIES WITH CHILDREN (0-9), BY REGION, 2022-2032 ($MILLION)
- TABLE 03. CHILDREN ENTERTAINMENT CENTERS MARKET FOR FAMILIES WITH CHILDREN (9-12), BY REGION, 2022-2032 ($MILLION)
- TABLE 04. CHILDREN ENTERTAINMENT CENTERS MARKET FOR TEENAGERS (12-18), BY REGION, 2022-2032 ($MILLION)
- TABLE 05. CHILDREN ENTERTAINMENT CENTERS MARKET FOR YOUNG ADULTS (18-24), BY REGION, 2022-2032 ($MILLION)
- TABLE 06. CHILDREN ENTERTAINMENT CENTERS MARKET FOR ADULTS (AGES 24+), BY REGION, 2022-2032 ($MILLION)
- TABLE 07. GLOBAL CHILDREN ENTERTAINMENT CENTERS MARKET, BY FACILITY SIZE, 2022-2032 ($MILLION)
- TABLE 08. CHILDREN ENTERTAINMENT CENTERS MARKET FOR UP TO 5,000 SQ. FT., BY REGION, 2022-2032 ($MILLION)
- TABLE 09. CHILDREN ENTERTAINMENT CENTERS MARKET FOR 5,001 TO 10,000 SQ. FT., BY REGION, 2022-2032 ($MILLION)
- TABLE 10. CHILDREN ENTERTAINMENT CENTERS MARKET FOR 10,001 TO 20,000 SQ. FT., BY REGION, 2022-2032 ($MILLION)
- TABLE 11. CHILDREN ENTERTAINMENT CENTERS MARKET FOR 20,001 TO 40,000 SQ. FT., BY REGION, 2022-2032 ($MILLION)
- TABLE 12. CHILDREN ENTERTAINMENT CENTERS MARKET FOR 1 TO 10 ACRES, BY REGION, 2022-2032 ($MILLION)
- TABLE 13. CHILDREN ENTERTAINMENT CENTERS MARKET FOR 11 TO 30 ACRES, BY REGION, 2022-2032 ($MILLION)
- TABLE 14. CHILDREN ENTERTAINMENT CENTERS MARKET FOR OVER 30 ACRES, BY REGION, 2022-2032 ($MILLION)
- TABLE 15. GLOBAL CHILDREN ENTERTAINMENT CENTERS MARKET, BY REVENUE SOURCE, 2022-2032 ($MILLION)
- TABLE 16. CHILDREN ENTERTAINMENT CENTERS MARKET FOR ENTRY FEES AND TICKET SALES, BY REGION, 2022-2032 ($MILLION)
- TABLE 17. CHILDREN ENTERTAINMENT CENTERS MARKET FOR FOOD AND BEVERAGES, BY REGION, 2022-2032 ($MILLION)
- TABLE 18. CHILDREN ENTERTAINMENT CENTERS MARKET FOR MERCHANDISING, BY REGION, 2022-2032 ($MILLION)
- TABLE 19. CHILDREN ENTERTAINMENT CENTERS MARKET FOR ADVERTISEMENT, BY REGION, 2022-2032 ($MILLION)
- TABLE 20. CHILDREN ENTERTAINMENT CENTERS MARKET FOR OTHERS, BY REGION, 2022-2032 ($MILLION)
- TABLE 21. GLOBAL CHILDREN ENTERTAINMENT CENTERS MARKET, BY ACTIVITY AREA, 2022-2032 ($MILLION)
- TABLE 22. CHILDREN ENTERTAINMENT CENTERS MARKET FOR ARCADE STUDIOS, BY REGION, 2022-2032 ($MILLION)
- TABLE 23. CHILDREN ENTERTAINMENT CENTERS MARKET FOR AR AND VR GAMING ZONES, BY REGION, 2022-2032 ($MILLION)
- TABLE 24. CHILDREN ENTERTAINMENT CENTERS MARKET FOR PHYSICAL PLAY ACTIVITIES, BY REGION, 2022-2032 ($MILLION)
- TABLE 25. CHILDREN ENTERTAINMENT CENTERS MARKET FOR SKILL/COMPETITION GAMES, BY REGION, 2022-2032 ($MILLION)
- TABLE 26. CHILDREN ENTERTAINMENT CENTERS MARKET FOR OTHERS, BY REGION, 2022-2032 ($MILLION)
- TABLE 27. CHILDREN ENTERTAINMENT CENTERS MARKET, BY REGION, 2022-2032 ($MILLION)
- TABLE 28. NORTH AMERICA CHILDREN ENTERTAINMENT CENTERS MARKET, BY VISITOR DEMOGRAPHIC, 2022-2032 ($MILLION)
- TABLE 29. NORTH AMERICA CHILDREN ENTERTAINMENT CENTERS MARKET, BY FACILITY SIZE, 2022-2032 ($MILLION)
- TABLE 30. NORTH AMERICA CHILDREN ENTERTAINMENT CENTERS MARKET, BY REVENUE SOURCE, 2022-2032 ($MILLION)
- TABLE 31. NORTH AMERICA CHILDREN ENTERTAINMENT CENTERS MARKET, BY ACTIVITY AREA, 2022-2032 ($MILLION)
- TABLE 32. NORTH AMERICA CHILDREN ENTERTAINMENT CENTERS MARKET, BY COUNTRY, 2022-2032 ($MILLION)
- TABLE 33. U.S. CHILDREN ENTERTAINMENT CENTERS MARKET, BY VISITOR DEMOGRAPHIC, 2022-2032 ($MILLION)
- TABLE 34. U.S. CHILDREN ENTERTAINMENT CENTERS MARKET, BY FACILITY SIZE, 2022-2032 ($MILLION)
- TABLE 35. U.S. CHILDREN ENTERTAINMENT CENTERS MARKET, BY REVENUE SOURCE, 2022-2032 ($MILLION)
- TABLE 36. U.S. CHILDREN ENTERTAINMENT CENTERS MARKET, BY ACTIVITY AREA, 2022-2032 ($MILLION)
- TABLE 37. CANADA CHILDREN ENTERTAINMENT CENTERS MARKET, BY VISITOR DEMOGRAPHIC, 2022-2032 ($MILLION)
- TABLE 38. CANADA CHILDREN ENTERTAINMENT CENTERS MARKET, BY FACILITY SIZE, 2022-2032 ($MILLION)
- TABLE 39. CANADA CHILDREN ENTERTAINMENT CENTERS MARKET, BY REVENUE SOURCE, 2022-2032 ($MILLION)
- TABLE 40. CANADA CHILDREN ENTERTAINMENT CENTERS MARKET, BY ACTIVITY AREA, 2022-2032 ($MILLION)
- TABLE 41. EUROPE CHILDREN ENTERTAINMENT CENTERS MARKET, BY VISITOR DEMOGRAPHIC, 2022-2032 ($MILLION)
- TABLE 42. EUROPE CHILDREN ENTERTAINMENT CENTERS MARKET, BY FACILITY SIZE, 2022-2032 ($MILLION)
- TABLE 43. EUROPE CHILDREN ENTERTAINMENT CENTERS MARKET, BY REVENUE SOURCE, 2022-2032 ($MILLION)
- TABLE 44. EUROPE CHILDREN ENTERTAINMENT CENTERS MARKET, BY ACTIVITY AREA, 2022-2032 ($MILLION)
- TABLE 45. EUROPE CHILDREN ENTERTAINMENT CENTERS MARKET, BY COUNTRY, 2022-2032 ($MILLION)
- TABLE 46. UK CHILDREN ENTERTAINMENT CENTERS MARKET, BY VISITOR DEMOGRAPHIC, 2022-2032 ($MILLION)
- TABLE 47. UK CHILDREN ENTERTAINMENT CENTERS MARKET, BY FACILITY SIZE, 2022-2032 ($MILLION)
- TABLE 48. UK CHILDREN ENTERTAINMENT CENTERS MARKET, BY REVENUE SOURCE, 2022-2032 ($MILLION)
- TABLE 49. UK CHILDREN ENTERTAINMENT CENTERS MARKET, BY ACTIVITY AREA, 2022-2032 ($MILLION)
- TABLE 50. GERMANY CHILDREN ENTERTAINMENT CENTERS MARKET, BY VISITOR DEMOGRAPHIC, 2022-2032 ($MILLION)
- TABLE 51. GERMANY CHILDREN ENTERTAINMENT CENTERS MARKET, BY FACILITY SIZE, 2022-2032 ($MILLION)
- TABLE 52. GERMANY CHILDREN ENTERTAINMENT CENTERS MARKET, BY REVENUE SOURCE, 2022-2032 ($MILLION)
- TABLE 53. GERMANY CHILDREN ENTERTAINMENT CENTERS MARKET, BY ACTIVITY AREA, 2022-2032 ($MILLION)
- TABLE 54. FRANCE CHILDREN ENTERTAINMENT CENTERS MARKET, BY VISITOR DEMOGRAPHIC, 2022-2032 ($MILLION)
- TABLE 55. FRANCE CHILDREN ENTERTAINMENT CENTERS MARKET, BY FACILITY SIZE, 2022-2032 ($MILLION)
- TABLE 56. FRANCE CHILDREN ENTERTAINMENT CENTERS MARKET, BY REVENUE SOURCE, 2022-2032 ($MILLION)
- TABLE 57. FRANCE CHILDREN ENTERTAINMENT CENTERS MARKET, BY ACTIVITY AREA, 2022-2032 ($MILLION)
- TABLE 58. ITALY CHILDREN ENTERTAINMENT CENTERS MARKET, BY VISITOR DEMOGRAPHIC, 2022-2032 ($MILLION)
- TABLE 59. ITALY CHILDREN ENTERTAINMENT CENTERS MARKET, BY FACILITY SIZE, 2022-2032 ($MILLION)
- TABLE 60. ITALY CHILDREN ENTERTAINMENT CENTERS MARKET, BY REVENUE SOURCE, 2022-2032 ($MILLION)
- TABLE 61. ITALY CHILDREN ENTERTAINMENT CENTERS MARKET, BY ACTIVITY AREA, 2022-2032 ($MILLION)
- TABLE 62. SPAIN CHILDREN ENTERTAINMENT CENTERS MARKET, BY VISITOR DEMOGRAPHIC, 2022-2032 ($MILLION)
- TABLE 63. SPAIN CHILDREN ENTERTAINMENT CENTERS MARKET, BY FACILITY SIZE, 2022-2032 ($MILLION)
- TABLE 64. SPAIN CHILDREN ENTERTAINMENT CENTERS MARKET, BY REVENUE SOURCE, 2022-2032 ($MILLION)
- TABLE 65. SPAIN CHILDREN ENTERTAINMENT CENTERS MARKET, BY ACTIVITY AREA, 2022-2032 ($MILLION)
- TABLE 66. REST OF EUROPE CHILDREN ENTERTAINMENT CENTERS MARKET, BY VISITOR DEMOGRAPHIC, 2022-2032 ($MILLION)
- TABLE 67. REST OF EUROPE CHILDREN ENTERTAINMENT CENTERS MARKET, BY FACILITY SIZE, 2022-2032 ($MILLION)
- TABLE 68. REST OF EUROPE CHILDREN ENTERTAINMENT CENTERS MARKET, BY REVENUE SOURCE, 2022-2032 ($MILLION)
- TABLE 69. REST OF EUROPE CHILDREN ENTERTAINMENT CENTERS MARKET, BY ACTIVITY AREA, 2022-2032 ($MILLION)
- TABLE 70. ASIA-PACIFIC CHILDREN ENTERTAINMENT CENTERS MARKET, BY VISITOR DEMOGRAPHIC, 2022-2032 ($MILLION)
- TABLE 71. ASIA-PACIFIC CHILDREN ENTERTAINMENT CENTERS MARKET, BY FACILITY SIZE, 2022-2032 ($MILLION)
- TABLE 72. ASIA-PACIFIC CHILDREN ENTERTAINMENT CENTERS MARKET, BY REVENUE SOURCE, 2022-2032 ($MILLION)
- TABLE 73. ASIA-PACIFIC CHILDREN ENTERTAINMENT CENTERS MARKET, BY ACTIVITY AREA, 2022-2032 ($MILLION)
- TABLE 74. ASIA-PACIFIC CHILDREN ENTERTAINMENT CENTERS MARKET, BY COUNTRY, 2022-2032 ($MILLION)
- TABLE 75. CHINA CHILDREN ENTERTAINMENT CENTERS MARKET, BY VISITOR DEMOGRAPHIC, 2022-2032 ($MILLION)
- TABLE 76. CHINA CHILDREN ENTERTAINMENT CENTERS MARKET, BY FACILITY SIZE, 2022-2032 ($MILLION)
- TABLE 77. CHINA CHILDREN ENTERTAINMENT CENTERS MARKET, BY REVENUE SOURCE, 2022-2032 ($MILLION)
- TABLE 78. CHINA CHILDREN ENTERTAINMENT CENTERS MARKET, BY ACTIVITY AREA, 2022-2032 ($MILLION)
- TABLE 79. JAPAN CHILDREN ENTERTAINMENT CENTERS MARKET, BY VISITOR DEMOGRAPHIC, 2022-2032 ($MILLION)
- TABLE 80. JAPAN CHILDREN ENTERTAINMENT CENTERS MARKET, BY FACILITY SIZE, 2022-2032 ($MILLION)
- TABLE 81. JAPAN CHILDREN ENTERTAINMENT CENTERS MARKET, BY REVENUE SOURCE, 2022-2032 ($MILLION)
- TABLE 82. JAPAN CHILDREN ENTERTAINMENT CENTERS MARKET, BY ACTIVITY AREA, 2022-2032 ($MILLION)
- TABLE 83. INDIA CHILDREN ENTERTAINMENT CENTERS MARKET, BY VISITOR DEMOGRAPHIC, 2022-2032 ($MILLION)
- TABLE 84. INDIA CHILDREN ENTERTAINMENT CENTERS MARKET, BY FACILITY SIZE, 2022-2032 ($MILLION)
- TABLE 85. INDIA CHILDREN ENTERTAINMENT CENTERS MARKET, BY REVENUE SOURCE, 2022-2032 ($MILLION)
- TABLE 86. INDIA CHILDREN ENTERTAINMENT CENTERS MARKET, BY ACTIVITY AREA, 2022-2032 ($MILLION)
- TABLE 87. AUSTRALIA CHILDREN ENTERTAINMENT CENTERS MARKET, BY VISITOR DEMOGRAPHIC, 2022-2032 ($MILLION)
- TABLE 88. AUSTRALIA CHILDREN ENTERTAINMENT CENTERS MARKET, BY FACILITY SIZE, 2022-2032 ($MILLION)
- TABLE 89. AUSTRALIA CHILDREN ENTERTAINMENT CENTERS MARKET, BY REVENUE SOURCE, 2022-2032 ($MILLION)
- TABLE 90. AUSTRALIA CHILDREN ENTERTAINMENT CENTERS MARKET, BY ACTIVITY AREA, 2022-2032 ($MILLION)
- TABLE 91. SOUTH KOREA CHILDREN ENTERTAINMENT CENTERS MARKET, BY VISITOR DEMOGRAPHIC, 2022-2032 ($MILLION)
- TABLE 92. SOUTH KOREA CHILDREN ENTERTAINMENT CENTERS MARKET, BY FACILITY SIZE, 2022-2032 ($MILLION)
- TABLE 93. SOUTH KOREA CHILDREN ENTERTAINMENT CENTERS MARKET, BY REVENUE SOURCE, 2022-2032 ($MILLION)
- TABLE 94. SOUTH KOREA CHILDREN ENTERTAINMENT CENTERS MARKET, BY ACTIVITY AREA, 2022-2032 ($MILLION)
- TABLE 95. REST OF ASIA-PACIFIC CHILDREN ENTERTAINMENT CENTERS MARKET, BY VISITOR DEMOGRAPHIC, 2022-2032 ($MILLION)
- TABLE 96. REST OF ASIA-PACIFIC CHILDREN ENTERTAINMENT CENTERS MARKET, BY FACILITY SIZE, 2022-2032 ($MILLION)
- TABLE 97. REST OF ASIA-PACIFIC CHILDREN ENTERTAINMENT CENTERS MARKET, BY REVENUE SOURCE, 2022-2032 ($MILLION)
- TABLE 98. REST OF ASIA-PACIFIC CHILDREN ENTERTAINMENT CENTERS MARKET, BY ACTIVITY AREA, 2022-2032 ($MILLION)
- TABLE 99. LAMEA CHILDREN ENTERTAINMENT CENTERS MARKET, BY VISITOR DEMOGRAPHIC, 2022-2032 ($MILLION)
- TABLE 100. LAMEA CHILDREN ENTERTAINMENT CENTERS MARKET, BY FACILITY SIZE, 2022-2032 ($MILLION)
- TABLE 101. LAMEA CHILDREN ENTERTAINMENT CENTERS MARKET, BY REVENUE SOURCE, 2022-2032 ($MILLION)
- TABLE 102. LAMEA CHILDREN ENTERTAINMENT CENTERS MARKET, BY ACTIVITY AREA, 2022-2032 ($MILLION)
- TABLE 103. LAMEA CHILDREN ENTERTAINMENT CENTERS MARKET, BY COUNTRY, 2022-2032 ($MILLION)
- TABLE 104. LATIN AMERICA CHILDREN ENTERTAINMENT CENTERS MARKET, BY VISITOR DEMOGRAPHIC, 2022-2032 ($MILLION)
- TABLE 105. LATIN AMERICA CHILDREN ENTERTAINMENT CENTERS MARKET, BY FACILITY SIZE, 2022-2032 ($MILLION)
- TABLE 106. LATIN AMERICA CHILDREN ENTERTAINMENT CENTERS MARKET, BY REVENUE SOURCE, 2022-2032 ($MILLION)
- TABLE 107. LATIN AMERICA CHILDREN ENTERTAINMENT CENTERS MARKET, BY ACTIVITY AREA, 2022-2032 ($MILLION)
- TABLE 108. MIDDLE EAST CHILDREN ENTERTAINMENT CENTERS MARKET, BY VISITOR DEMOGRAPHIC, 2022-2032 ($MILLION)
- TABLE 109. MIDDLE EAST CHILDREN ENTERTAINMENT CENTERS MARKET, BY FACILITY SIZE, 2022-2032 ($MILLION)
- TABLE 110. MIDDLE EAST CHILDREN ENTERTAINMENT CENTERS MARKET, BY REVENUE SOURCE, 2022-2032 ($MILLION)
- TABLE 111. MIDDLE EAST CHILDREN ENTERTAINMENT CENTERS MARKET, BY ACTIVITY AREA, 2022-2032 ($MILLION)
- TABLE 112. AFRICA CHILDREN ENTERTAINMENT CENTERS MARKET, BY VISITOR DEMOGRAPHIC, 2022-2032 ($MILLION)
- TABLE 113. AFRICA CHILDREN ENTERTAINMENT CENTERS MARKET, BY FACILITY SIZE, 2022-2032 ($MILLION)
- TABLE 114. AFRICA CHILDREN ENTERTAINMENT CENTERS MARKET, BY REVENUE SOURCE, 2022-2032 ($MILLION)
- TABLE 115. AFRICA CHILDREN ENTERTAINMENT CENTERS MARKET, BY ACTIVITY AREA, 2022-2032 ($MILLION)
- TABLE 116. THE WALT DISNEY COMPANY: KEY EXECUTIVES
- TABLE 117. THE WALT DISNEY COMPANY: COMPANY SNAPSHOT
- TABLE 118. THE WALT DISNEY COMPANY: PRODUCT SEGMENTS
- TABLE 119. THE WALT DISNEY COMPANY: SERVICE SEGMENTS
- TABLE 120. THE WALT DISNEY COMPANY: PRODUCT PORTFOLIO
- TABLE 121. THE WALT DISNEY COMPANY: KEY STRATERGIES
- TABLE 122. LEGO SYSTEM A/S: KEY EXECUTIVES
- TABLE 123. LEGO SYSTEM A/S: COMPANY SNAPSHOT
- TABLE 124. LEGO SYSTEM A/S: PRODUCT SEGMENTS
- TABLE 125. LEGO SYSTEM A/S: PRODUCT PORTFOLIO
- TABLE 126. DAVE AND BUSTER'S, INC.: KEY EXECUTIVES
- TABLE 127. DAVE AND BUSTER'S, INC.: COMPANY SNAPSHOT
- TABLE 128. DAVE AND BUSTER'S, INC.: SERVICE SEGMENTS
- TABLE 129. DAVE AND BUSTER'S, INC.: PRODUCT PORTFOLIO
- TABLE 130. DAVE AND BUSTER'S, INC.: KEY STRATERGIES
- TABLE 131. LANDMARK GROUP: KEY EXECUTIVES
- TABLE 132. LANDMARK GROUP: COMPANY SNAPSHOT
- TABLE 133. LANDMARK GROUP: SERVICE SEGMENTS
- TABLE 134. LANDMARK GROUP: PRODUCT PORTFOLIO
- TABLE 135. LANDMARK GROUP: KEY STRATERGIES
- TABLE 136. FUNRIDERS: KEY EXECUTIVES
- TABLE 137. FUNRIDERS: COMPANY SNAPSHOT
- TABLE 138. FUNRIDERS: SERVICE SEGMENTS
- TABLE 139. FUNRIDERS: PRODUCT PORTFOLIO
- TABLE 140. KIDZANIA: KEY EXECUTIVES
- TABLE 141. KIDZANIA: COMPANY SNAPSHOT
- TABLE 142. KIDZANIA: SERVICE SEGMENTS
- TABLE 143. KIDZANIA: PRODUCT PORTFOLIO
- TABLE 144. KIDZANIA: KEY STRATERGIES
- TABLE 145. SCENE75 ENTERTAINMENT CENTERS LLC: KEY EXECUTIVES
- TABLE 146. SCENE75 ENTERTAINMENT CENTERS LLC: COMPANY SNAPSHOT
- TABLE 147. SCENE75 ENTERTAINMENT CENTERS LLC: SERVICE SEGMENTS
- TABLE 148. SCENE75 ENTERTAINMENT CENTERS LLC: PRODUCT PORTFOLIO
- TABLE 149. SMAAASH: KEY EXECUTIVES
- TABLE 150. SMAAASH: COMPANY SNAPSHOT
- TABLE 151. SMAAASH: SERVICE SEGMENTS
- TABLE 152. SMAAASH: PRODUCT PORTFOLIO
- TABLE 153. CEC ENTERTAINMENT CONCEPTS, LP.: KEY EXECUTIVES
- TABLE 154. CEC ENTERTAINMENT CONCEPTS, LP.: COMPANY SNAPSHOT
- TABLE 155. CEC ENTERTAINMENT CONCEPTS, LP.: SERVICE SEGMENTS
- TABLE 156. CEC ENTERTAINMENT CONCEPTS, LP.: PRODUCT PORTFOLIO
- TABLE 157. CEC ENTERTAINMENT CONCEPTS, LP.: KEY STRATERGIES
- TABLE 158. CINERGY ENTERTAINMENT GROUP: KEY EXECUTIVES
- TABLE 159. CINERGY ENTERTAINMENT GROUP: COMPANY SNAPSHOT
- TABLE 160. CINERGY ENTERTAINMENT GROUP: SERVICE SEGMENTS
- TABLE 161. CINERGY ENTERTAINMENT GROUP: PRODUCT PORTFOLIO
- TABLE 162. CINERGY ENTERTAINMENT GROUP: KEY STRATERGIES
LIST OF FIGURES
- FIGURE 01. CHILDREN ENTERTAINMENT CENTERS MARKET, 2022-2032
- FIGURE 02. SEGMENTATION OF CHILDREN ENTERTAINMENT CENTERS MARKET,2022-2032
- FIGURE 03. TOP IMPACTING FACTORS IN CHILDREN ENTERTAINMENT CENTERS MARKET (2022 TO 2032)
- FIGURE 04. TOP INVESTMENT POCKETS IN CHILDREN ENTERTAINMENT CENTERS MARKET (2023-2032)
- FIGURE 05. LOW BARGAINING POWER OF SUPPLIERS
- FIGURE 06. LOW THREAT OF NEW ENTRANTS
- FIGURE 07. LOW THREAT OF SUBSTITUTES
- FIGURE 08. LOW INTENSITY OF RIVALRY
- FIGURE 09. LOW BARGAINING POWER OF BUYERS
- FIGURE 10. GLOBAL CHILDREN ENTERTAINMENT CENTERS MARKET:DRIVERS, RESTRAINTS AND OPPORTUNITIES
- FIGURE 11. CHILDREN ENTERTAINMENT CENTERS MARKET, BY VISITOR DEMOGRAPHIC, 2022 AND 2032(%)
- FIGURE 12. COMPARATIVE SHARE ANALYSIS OF CHILDREN ENTERTAINMENT CENTERS MARKET FOR FAMILIES WITH CHILDREN (0-9), BY COUNTRY 2022 AND 2032(%)
- FIGURE 13. COMPARATIVE SHARE ANALYSIS OF CHILDREN ENTERTAINMENT CENTERS MARKET FOR FAMILIES WITH CHILDREN (9-12), BY COUNTRY 2022 AND 2032(%)
- FIGURE 14. COMPARATIVE SHARE ANALYSIS OF CHILDREN ENTERTAINMENT CENTERS MARKET FOR TEENAGERS (12-18), BY COUNTRY 2022 AND 2032(%)
- FIGURE 15. COMPARATIVE SHARE ANALYSIS OF CHILDREN ENTERTAINMENT CENTERS MARKET FOR YOUNG ADULTS (18-24), BY COUNTRY 2022 AND 2032(%)
- FIGURE 16. COMPARATIVE SHARE ANALYSIS OF CHILDREN ENTERTAINMENT CENTERS MARKET FOR ADULTS (AGES 24+), BY COUNTRY 2022 AND 2032(%)
- FIGURE 17. CHILDREN ENTERTAINMENT CENTERS MARKET, BY FACILITY SIZE, 2022 AND 2032(%)
- FIGURE 18. COMPARATIVE SHARE ANALYSIS OF CHILDREN ENTERTAINMENT CENTERS MARKET FOR UP TO 5,000 SQ. FT., BY COUNTRY 2022 AND 2032(%)
- FIGURE 19. COMPARATIVE SHARE ANALYSIS OF CHILDREN ENTERTAINMENT CENTERS MARKET FOR 5,001 TO 10,000 SQ. FT., BY COUNTRY 2022 AND 2032(%)
- FIGURE 20. COMPARATIVE SHARE ANALYSIS OF CHILDREN ENTERTAINMENT CENTERS MARKET FOR 10,001 TO 20,000 SQ. FT., BY COUNTRY 2022 AND 2032(%)
- FIGURE 21. COMPARATIVE SHARE ANALYSIS OF CHILDREN ENTERTAINMENT CENTERS MARKET FOR 20,001 TO 40,000 SQ. FT., BY COUNTRY 2022 AND 2032(%)
- FIGURE 22. COMPARATIVE SHARE ANALYSIS OF CHILDREN ENTERTAINMENT CENTERS MARKET FOR 1 TO 10 ACRES, BY COUNTRY 2022 AND 2032(%)
- FIGURE 23. COMPARATIVE SHARE ANALYSIS OF CHILDREN ENTERTAINMENT CENTERS MARKET FOR 11 TO 30 ACRES, BY COUNTRY 2022 AND 2032(%)
- FIGURE 24. COMPARATIVE SHARE ANALYSIS OF CHILDREN ENTERTAINMENT CENTERS MARKET FOR OVER 30 ACRES, BY COUNTRY 2022 AND 2032(%)
- FIGURE 25. CHILDREN ENTERTAINMENT CENTERS MARKET, BY REVENUE SOURCE, 2022 AND 2032(%)
- FIGURE 26. COMPARATIVE SHARE ANALYSIS OF CHILDREN ENTERTAINMENT CENTERS MARKET FOR ENTRY FEES AND TICKET SALES, BY COUNTRY 2022 AND 2032(%)
- FIGURE 27. COMPARATIVE SHARE ANALYSIS OF CHILDREN ENTERTAINMENT CENTERS MARKET FOR FOOD AND BEVERAGES, BY COUNTRY 2022 AND 2032(%)
- FIGURE 28. COMPARATIVE SHARE ANALYSIS OF CHILDREN ENTERTAINMENT CENTERS MARKET FOR MERCHANDISING, BY COUNTRY 2022 AND 2032(%)
- FIGURE 29. COMPARATIVE SHARE ANALYSIS OF CHILDREN ENTERTAINMENT CENTERS MARKET FOR ADVERTISEMENT, BY COUNTRY 2022 AND 2032(%)
- FIGURE 30. COMPARATIVE SHARE ANALYSIS OF CHILDREN ENTERTAINMENT CENTERS MARKET FOR OTHERS, BY COUNTRY 2022 AND 2032(%)
- FIGURE 31. CHILDREN ENTERTAINMENT CENTERS MARKET, BY ACTIVITY AREA, 2022 AND 2032(%)
- FIGURE 32. COMPARATIVE SHARE ANALYSIS OF CHILDREN ENTERTAINMENT CENTERS MARKET FOR ARCADE STUDIOS, BY COUNTRY 2022 AND 2032(%)
- FIGURE 33. COMPARATIVE SHARE ANALYSIS OF CHILDREN ENTERTAINMENT CENTERS MARKET FOR AR AND VR GAMING ZONES, BY COUNTRY 2022 AND 2032(%)
- FIGURE 34. COMPARATIVE SHARE ANALYSIS OF CHILDREN ENTERTAINMENT CENTERS MARKET FOR PHYSICAL PLAY ACTIVITIES, BY COUNTRY 2022 AND 2032(%)
- FIGURE 35. COMPARATIVE SHARE ANALYSIS OF CHILDREN ENTERTAINMENT CENTERS MARKET FOR SKILL/COMPETITION GAMES, BY COUNTRY 2022 AND 2032(%)
- FIGURE 36. COMPARATIVE SHARE ANALYSIS OF CHILDREN ENTERTAINMENT CENTERS MARKET FOR OTHERS, BY COUNTRY 2022 AND 2032(%)
- FIGURE 37. CHILDREN ENTERTAINMENT CENTERS MARKET BY REGION, 2022 AND 2032(%)
- FIGURE 38. U.S. CHILDREN ENTERTAINMENT CENTERS MARKET, 2022-2032 ($MILLION)
- FIGURE 39. CANADA CHILDREN ENTERTAINMENT CENTERS MARKET, 2022-2032 ($MILLION)
- FIGURE 40. UK CHILDREN ENTERTAINMENT CENTERS MARKET, 2022-2032 ($MILLION)
- FIGURE 41. GERMANY CHILDREN ENTERTAINMENT CENTERS MARKET, 2022-2032 ($MILLION)
- FIGURE 42. FRANCE CHILDREN ENTERTAINMENT CENTERS MARKET, 2022-2032 ($MILLION)
- FIGURE 43. ITALY CHILDREN ENTERTAINMENT CENTERS MARKET, 2022-2032 ($MILLION)
- FIGURE 44. SPAIN CHILDREN ENTERTAINMENT CENTERS MARKET, 2022-2032 ($MILLION)
- FIGURE 45. REST OF EUROPE CHILDREN ENTERTAINMENT CENTERS MARKET, 2022-2032 ($MILLION)
- FIGURE 46. CHINA CHILDREN ENTERTAINMENT CENTERS MARKET, 2022-2032 ($MILLION)
- FIGURE 47. JAPAN CHILDREN ENTERTAINMENT CENTERS MARKET, 2022-2032 ($MILLION)
- FIGURE 48. INDIA CHILDREN ENTERTAINMENT CENTERS MARKET, 2022-2032 ($MILLION)
- FIGURE 49. AUSTRALIA CHILDREN ENTERTAINMENT CENTERS MARKET, 2022-2032 ($MILLION)
- FIGURE 50. SOUTH KOREA CHILDREN ENTERTAINMENT CENTERS MARKET, 2022-2032 ($MILLION)
- FIGURE 51. REST OF ASIA-PACIFIC CHILDREN ENTERTAINMENT CENTERS MARKET, 2022-2032 ($MILLION)
- FIGURE 52. LATIN AMERICA CHILDREN ENTERTAINMENT CENTERS MARKET, 2022-2032 ($MILLION)
- FIGURE 53. MIDDLE EAST CHILDREN ENTERTAINMENT CENTERS MARKET, 2022-2032 ($MILLION)
- FIGURE 54. AFRICA CHILDREN ENTERTAINMENT CENTERS MARKET, 2022-2032 ($MILLION)
- FIGURE 55. TOP WINNING STRATEGIES, BY YEAR (2019-2023)
- FIGURE 56. TOP WINNING STRATEGIES, BY DEVELOPMENT (2019-2023)
- FIGURE 57. TOP WINNING STRATEGIES, BY COMPANY (2019-2023)
- FIGURE 58. PRODUCT MAPPING OF TOP 10 PLAYERS
- FIGURE 59. COMPETITIVE DASHBOARD
- FIGURE 60. COMPETITIVE HEATMAP: CHILDREN ENTERTAINMENT CENTERS MARKET
- FIGURE 61. TOP PLAYER POSITIONING, 2022
- FIGURE 62. THE WALT DISNEY COMPANY: NET REVENUE, 2020-2022 ($MILLION)
- FIGURE 63. THE WALT DISNEY COMPANY: REVENUE SHARE BY SEGMENT, 2022 (%)
- FIGURE 64. DAVE AND BUSTER'S, INC.: NET REVENUE, 2020-2022 ($MILLION)
According to a new report published by Allied Market Research, titled, "Children Entertainment Centers Market," The children entertainment centers market was valued at $11.5 billion in 2022, and is estimated to reach $30.7 billion by 2032, growing at a CAGR of 10.6% from 2023 to 2032.
Children entertainment areas are capable and are preferable to host private celebrations such as corporate events, birthday parties, and even personal accomplishment celebrations. Growth in per capita disposable income, availability of diversified gaming and entertainment options, rise in preference for indoor entertainment, and favorable youth demographics in the Asia-Pacific region majorly supplement the growth of the market. However, home gaming and mobile devices, high initial cost, and increase in ticket prices are expected to hamper the market growth.
Children entertainment centers are widely preferred as a recreational and entertainment aspect among families over the outdoor entertainment centers. This is among some of the major factors expected to drive the growth of the global market. However, smartphones, home gaming such as video games, and high initial investments required are the major factors that are expected to hinder the market growth to a certain extent.
The children entertainment centers market is segmented on the basis of visitor demographic, facility size, revenue source, and activity area, and region. On the basis of visitor demographics, the market is categorized into families with children (0-9), families with children (9-12), teenagers (12-18), young adults (18-24), and adults (Ages 24+). By facility size, it is divided into up to 5,000 sq. ft., 5,001 to 10,000 sq. ft., 10,001 to 20,000 sq. ft., 20,001 to 40,000 sq. ft., 1 to 10 acres, 11 to 30 acres, and over 30 acres. By revenue source, it is classified into entry fees & ticket sales, food & beverages, merchandising, advertisement, and others. In terms of activity area, the market is classified into arcade studios, AR & VR gaming zones, physical play activities, skill/competition games, and others. By region, the market is analyzed across North America, Europe, Asia-Pacific, and LAMEA.
The global children entertainment centers market is dominated by key players such as Disney, LEGO System A/S, Dave and Buster's, Inc., SCENE75 ENTERTAINMENT CENTERS LLC, CEC Entertainment Concepts, LP., Funriders, KidZania, LANDMARK GROUP, SMAAASH, and Cinergy Entertainment Group.
Key Benefits For Stakeholders
- This report provides a quantitative analysis of the market segments, current trends, estimations, and dynamics of the children entertainment centers market analysis from 2022 to 2032 to identify the prevailing children entertainment centers market opportunities.
- The market research is offered along with information related to key drivers, restraints, and opportunities.
- Porter's five forces analysis highlights the potency of buyers and suppliers to enable stakeholders make profit-oriented business decisions and strengthen their supplier-buyer network.
- In-depth analysis of the children entertainment centers market segmentation assists to determine the prevailing market opportunities.
- Major countries in each region are mapped according to their revenue contribution to the global market.
- Market player positioning facilitates benchmarking and provides a clear understanding of the present position of the market players.
- The report includes the analysis of the regional as well as global children entertainment centers market trends, key players, market segments, application areas, and market growth strategies.
Additional benefits you will get with this purchase are:
- Quarterly Update and* (only available with a corporate license, on listed price)
- 5 additional Company Profile of client Choice pre- or Post-purchase, as a free update.
- Free Upcoming Version on the Purchase of Five and Enterprise User License.
- 16 analyst hours of support* (post-purchase, if you find additional data requirements upon review of the report, you may receive support amounting to 16 analyst hours to solve questions, and post-sale queries)
- 15% Free Customization* (in case the scope or segment of the report does not match your requirements, 15% is equivalent to 3 working days of free work, applicable once)
- Free data Pack on the Five and Enterprise User License. (Excel version of the report)
- Free Updated report if the report is 6-12 months old or older.
- 24-hour priority response*
- Free Industry updates and white papers.
Possible Customization with this report (with additional cost and timeline, please talk to the sales executive to know more)
- Investment Opportunities
- Regulatory Guidelines
- Additional company profiles with specific to client's interest
- Historic market data
- Key player details (including location, contact details, supplier/vendor network etc. in excel format)
- Market share analysis of players at global/region/country level
- SWOT Analysis
Key Market Segments
By Revenue Source
- Entry Fees and Ticket Sales
- Food and Beverages
- Merchandising
- Advertisement
- Others
By Activity Area
- Arcade Studios
- AR and VR gaming Zones
- Physical Play Activities
- Skill/Competition Games
- Others
By Visitor Demographic
- Young Adults (18-24)
- Adults (Ages 24+)
- Families with Children (0-9)
- Families with Children (9-12)
- Teenagers (12-18)
By Facility Size
- Up to 5,000 sq. ft.
- 5,001 to 10,000 sq. ft.
- 10,001 to 20,000 sq. ft.
- 20,001 to 40,000 sq. ft.
- 1 to 10 acres
- 11 to 30 acres
- Over 30 acres
By Region
- North America
- U.S.
- Canada
- Europe
- UK
- Germany
- France
- Italy
- Spain
- Rest of Europe
- Asia-Pacific
- China
- Japan
- India
- Australia
- South Korea
- Rest of Asia-Pacific
- LAMEA
- Latin America
- Middle East
- Africa
Key Market Players:
- LEGO System A/S
- Dave and Buster's, Inc.
- SCENE75 ENTERTAINMENT CENTERS LLC
- CEC Entertainment Concepts, LP.
- Funriders
- LANDMARK GROUP
- Cinergy Entertainment Group
- KidZania
- SMAAASH
- The Walt Disney Company
TABLE OF CONTENTS
CHAPTER 1: INTRODUCTION
- 1.1. Report description
- 1.2. Key market segments
- 1.3. Key benefits to the stakeholders
- 1.4. Research methodology
- 1.4.1. Primary research
- 1.4.2. Secondary research
- 1.4.3. Analyst tools and models
CHAPTER 2: EXECUTIVE SUMMARY
- 2.1. CXO Perspective
CHAPTER 3: MARKET OVERVIEW
- 3.1. Market definition and scope
- 3.2. Key findings
- 3.2.1. Top impacting factors
- 3.2.2. Top investment pockets
- 3.3. Porter's five forces analysis
- 3.3.1. Low bargaining power of suppliers
- 3.3.2. Low threat of new entrants
- 3.3.3. Low threat of substitutes
- 3.3.4. Low intensity of rivalry
- 3.3.5. Low bargaining power of buyers
- 3.4. Market dynamics
- 3.4.1. Drivers
- 3.4.1.1. Continuous launch of new entertainment centers supporting family activities, F&B integration, and participatory play
- 3.4.1.2. Increase in number of malls
- 3.4.1.3. Favorable youth demographics
- 3.4.2. Restraints
- 3.4.2.1. Increase in ticket prices
- 3.4.3. Opportunities
- 3.4.3.1. Surge in investments in new games and attractions
- 3.4.1. Drivers
CHAPTER 4: CHILDREN ENTERTAINMENT CENTERS MARKET, BY VISITOR DEMOGRAPHIC
- 4.1. Overview
- 4.1.1. Market size and forecast
- 4.2. Families with Children (0-9)
- 4.2.1. Key market trends, growth factors and opportunities
- 4.2.2. Market size and forecast, by region
- 4.2.3. Market share analysis by country
- 4.3. Families with Children (9-12)
- 4.3.1. Key market trends, growth factors and opportunities
- 4.3.2. Market size and forecast, by region
- 4.3.3. Market share analysis by country
- 4.4. Teenagers (12-18)
- 4.4.1. Key market trends, growth factors and opportunities
- 4.4.2. Market size and forecast, by region
- 4.4.3. Market share analysis by country
- 4.5. Young Adults (18-24)
- 4.5.1. Key market trends, growth factors and opportunities
- 4.5.2. Market size and forecast, by region
- 4.5.3. Market share analysis by country
- 4.6. Adults (Ages 24+)
- 4.6.1. Key market trends, growth factors and opportunities
- 4.6.2. Market size and forecast, by region
- 4.6.3. Market share analysis by country
CHAPTER 5: CHILDREN ENTERTAINMENT CENTERS MARKET, BY FACILITY SIZE
- 5.1. Overview
- 5.1.1. Market size and forecast
- 5.2. Up to 5,000 sq. ft.
- 5.2.1. Key market trends, growth factors and opportunities
- 5.2.2. Market size and forecast, by region
- 5.2.3. Market share analysis by country
- 5.3. 5,001 to 10,000 sq. ft.
- 5.3.1. Key market trends, growth factors and opportunities
- 5.3.2. Market size and forecast, by region
- 5.3.3. Market share analysis by country
- 5.4. 10,001 to 20,000 sq. ft.
- 5.4.1. Key market trends, growth factors and opportunities
- 5.4.2. Market size and forecast, by region
- 5.4.3. Market share analysis by country
- 5.5. 20,001 to 40,000 sq. ft.
- 5.5.1. Key market trends, growth factors and opportunities
- 5.5.2. Market size and forecast, by region
- 5.5.3. Market share analysis by country
- 5.6. 1 to 10 acres
- 5.6.1. Key market trends, growth factors and opportunities
- 5.6.2. Market size and forecast, by region
- 5.6.3. Market share analysis by country
- 5.7. 11 to 30 acres
- 5.7.1. Key market trends, growth factors and opportunities
- 5.7.2. Market size and forecast, by region
- 5.7.3. Market share analysis by country
- 5.8. Over 30 acres
- 5.8.1. Key market trends, growth factors and opportunities
- 5.8.2. Market size and forecast, by region
- 5.8.3. Market share analysis by country
CHAPTER 6: CHILDREN ENTERTAINMENT CENTERS MARKET, BY REVENUE SOURCE
- 6.1. Overview
- 6.1.1. Market size and forecast
- 6.2. Entry Fees and Ticket Sales
- 6.2.1. Key market trends, growth factors and opportunities
- 6.2.2. Market size and forecast, by region
- 6.2.3. Market share analysis by country
- 6.3. Food and Beverages
- 6.3.1. Key market trends, growth factors and opportunities
- 6.3.2. Market size and forecast, by region
- 6.3.3. Market share analysis by country
- 6.4. Merchandising
- 6.4.1. Key market trends, growth factors and opportunities
- 6.4.2. Market size and forecast, by region
- 6.4.3. Market share analysis by country
- 6.5. Advertisement
- 6.5.1. Key market trends, growth factors and opportunities
- 6.5.2. Market size and forecast, by region
- 6.5.3. Market share analysis by country
- 6.6. Others
- 6.6.1. Key market trends, growth factors and opportunities
- 6.6.2. Market size and forecast, by region
- 6.6.3. Market share analysis by country
CHAPTER 7: CHILDREN ENTERTAINMENT CENTERS MARKET, BY ACTIVITY AREA
- 7.1. Overview
- 7.1.1. Market size and forecast
- 7.2. Arcade Studios
- 7.2.1. Key market trends, growth factors and opportunities
- 7.2.2. Market size and forecast, by region
- 7.2.3. Market share analysis by country
- 7.3. AR and VR gaming Zones
- 7.3.1. Key market trends, growth factors and opportunities
- 7.3.2. Market size and forecast, by region
- 7.3.3. Market share analysis by country
- 7.4. Physical Play Activities
- 7.4.1. Key market trends, growth factors and opportunities
- 7.4.2. Market size and forecast, by region
- 7.4.3. Market share analysis by country
- 7.5. Skill/Competition Games
- 7.5.1. Key market trends, growth factors and opportunities
- 7.5.2. Market size and forecast, by region
- 7.5.3. Market share analysis by country
- 7.6. Others
- 7.6.1. Key market trends, growth factors and opportunities
- 7.6.2. Market size and forecast, by region
- 7.6.3. Market share analysis by country
CHAPTER 8: CHILDREN ENTERTAINMENT CENTERS MARKET, BY REGION
- 8.1. Overview
- 8.1.1. Market size and forecast By Region
- 8.2. North America
- 8.2.1. Key market trends, growth factors and opportunities
- 8.2.2. Market size and forecast, by Visitor Demographic
- 8.2.3. Market size and forecast, by Facility Size
- 8.2.4. Market size and forecast, by Revenue Source
- 8.2.5. Market size and forecast, by Activity Area
- 8.2.6. Market size and forecast, by country
- 8.2.6.1. U.S.
- 8.2.6.1.1. Market size and forecast, by Visitor Demographic
- 8.2.6.1.2. Market size and forecast, by Facility Size
- 8.2.6.1.3. Market size and forecast, by Revenue Source
- 8.2.6.1.4. Market size and forecast, by Activity Area
- 8.2.6.2. Canada
- 8.2.6.2.1. Market size and forecast, by Visitor Demographic
- 8.2.6.2.2. Market size and forecast, by Facility Size
- 8.2.6.2.3. Market size and forecast, by Revenue Source
- 8.2.6.2.4. Market size and forecast, by Activity Area
- 8.3. Europe
- 8.3.1. Key market trends, growth factors and opportunities
- 8.3.2. Market size and forecast, by Visitor Demographic
- 8.3.3. Market size and forecast, by Facility Size
- 8.3.4. Market size and forecast, by Revenue Source
- 8.3.5. Market size and forecast, by Activity Area
- 8.3.6. Market size and forecast, by country
- 8.3.6.1. UK
- 8.3.6.1.1. Market size and forecast, by Visitor Demographic
- 8.3.6.1.2. Market size and forecast, by Facility Size
- 8.3.6.1.3. Market size and forecast, by Revenue Source
- 8.3.6.1.4. Market size and forecast, by Activity Area
- 8.3.6.2. Germany
- 8.3.6.2.1. Market size and forecast, by Visitor Demographic
- 8.3.6.2.2. Market size and forecast, by Facility Size
- 8.3.6.2.3. Market size and forecast, by Revenue Source
- 8.3.6.2.4. Market size and forecast, by Activity Area
- 8.3.6.3. France
- 8.3.6.3.1. Market size and forecast, by Visitor Demographic
- 8.3.6.3.2. Market size and forecast, by Facility Size
- 8.3.6.3.3. Market size and forecast, by Revenue Source
- 8.3.6.3.4. Market size and forecast, by Activity Area
- 8.3.6.4. Italy
- 8.3.6.4.1. Market size and forecast, by Visitor Demographic
- 8.3.6.4.2. Market size and forecast, by Facility Size
- 8.3.6.4.3. Market size and forecast, by Revenue Source
- 8.3.6.4.4. Market size and forecast, by Activity Area
- 8.3.6.5. Spain
- 8.3.6.5.1. Market size and forecast, by Visitor Demographic
- 8.3.6.5.2. Market size and forecast, by Facility Size
- 8.3.6.5.3. Market size and forecast, by Revenue Source
- 8.3.6.5.4. Market size and forecast, by Activity Area
- 8.3.6.6. Rest of Europe
- 8.3.6.6.1. Market size and forecast, by Visitor Demographic
- 8.3.6.6.2. Market size and forecast, by Facility Size
- 8.3.6.6.3. Market size and forecast, by Revenue Source
- 8.3.6.6.4. Market size and forecast, by Activity Area
- 8.4. Asia-Pacific
- 8.4.1. Key market trends, growth factors and opportunities
- 8.4.2. Market size and forecast, by Visitor Demographic
- 8.4.3. Market size and forecast, by Facility Size
- 8.4.4. Market size and forecast, by Revenue Source
- 8.4.5. Market size and forecast, by Activity Area
- 8.4.6. Market size and forecast, by country
- 8.4.6.1. China
- 8.4.6.1.1. Market size and forecast, by Visitor Demographic
- 8.4.6.1.2. Market size and forecast, by Facility Size
- 8.4.6.1.3. Market size and forecast, by Revenue Source
- 8.4.6.1.4. Market size and forecast, by Activity Area
- 8.4.6.2. Japan
- 8.4.6.2.1. Market size and forecast, by Visitor Demographic
- 8.4.6.2.2. Market size and forecast, by Facility Size
- 8.4.6.2.3. Market size and forecast, by Revenue Source
- 8.4.6.2.4. Market size and forecast, by Activity Area
- 8.4.6.3. India
- 8.4.6.3.1. Market size and forecast, by Visitor Demographic
- 8.4.6.3.2. Market size and forecast, by Facility Size
- 8.4.6.3.3. Market size and forecast, by Revenue Source
- 8.4.6.3.4. Market size and forecast, by Activity Area
- 8.4.6.4. Australia
- 8.4.6.4.1. Market size and forecast, by Visitor Demographic
- 8.4.6.4.2. Market size and forecast, by Facility Size
- 8.4.6.4.3. Market size and forecast, by Revenue Source
- 8.4.6.4.4. Market size and forecast, by Activity Area
- 8.4.6.5. South Korea
- 8.4.6.5.1. Market size and forecast, by Visitor Demographic
- 8.4.6.5.2. Market size and forecast, by Facility Size
- 8.4.6.5.3. Market size and forecast, by Revenue Source
- 8.4.6.5.4. Market size and forecast, by Activity Area
- 8.4.6.6. Rest of Asia-Pacific
- 8.4.6.6.1. Market size and forecast, by Visitor Demographic
- 8.4.6.6.2. Market size and forecast, by Facility Size
- 8.4.6.6.3. Market size and forecast, by Revenue Source
- 8.4.6.6.4. Market size and forecast, by Activity Area
- 8.5. LAMEA
- 8.5.1. Key market trends, growth factors and opportunities
- 8.5.2. Market size and forecast, by Visitor Demographic
- 8.5.3. Market size and forecast, by Facility Size
- 8.5.4. Market size and forecast, by Revenue Source
- 8.5.5. Market size and forecast, by Activity Area
- 8.5.6. Market size and forecast, by country
- 8.5.6.1. Latin America
- 8.5.6.1.1. Market size and forecast, by Visitor Demographic
- 8.5.6.1.2. Market size and forecast, by Facility Size
- 8.5.6.1.3. Market size and forecast, by Revenue Source
- 8.5.6.1.4. Market size and forecast, by Activity Area
- 8.5.6.2. Middle East
- 8.5.6.2.1. Market size and forecast, by Visitor Demographic
- 8.5.6.2.2. Market size and forecast, by Facility Size
- 8.5.6.2.3. Market size and forecast, by Revenue Source
- 8.5.6.2.4. Market size and forecast, by Activity Area
- 8.5.6.3. Africa
- 8.5.6.3.1. Market size and forecast, by Visitor Demographic
- 8.5.6.3.2. Market size and forecast, by Facility Size
- 8.5.6.3.3. Market size and forecast, by Revenue Source
- 8.5.6.3.4. Market size and forecast, by Activity Area
CHAPTER 9: COMPETITIVE LANDSCAPE
- 9.1. Introduction
- 9.2. Top winning strategies
- 9.3. Product mapping of top 10 player
- 9.4. Competitive dashboard
- 9.5. Competitive heatmap
- 9.6. Top player positioning, 2022
CHAPTER 10: COMPANY PROFILES
- 10.1. The Walt Disney Company
- 10.1.1. Company overview
- 10.1.2. Key executives
- 10.1.3. Company snapshot
- 10.1.4. Operating business segments
- 10.1.5. Product portfolio
- 10.1.6. Business performance
- 10.1.7. Key strategic moves and developments
- 10.2. LEGO System A/S
- 10.2.1. Company overview
- 10.2.2. Key executives
- 10.2.3. Company snapshot
- 10.2.4. Operating business segments
- 10.2.5. Product portfolio
- 10.3. Dave and Buster's, Inc.
- 10.3.1. Company overview
- 10.3.2. Key executives
- 10.3.3. Company snapshot
- 10.3.4. Operating business segments
- 10.3.5. Product portfolio
- 10.3.6. Business performance
- 10.3.7. Key strategic moves and developments
- 10.4. LANDMARK GROUP
- 10.4.1. Company overview
- 10.4.2. Key executives
- 10.4.3. Company snapshot
- 10.4.4. Operating business segments
- 10.4.5. Product portfolio
- 10.4.6. Key strategic moves and developments
- 10.5. Funriders
- 10.5.1. Company overview
- 10.5.2. Key executives
- 10.5.3. Company snapshot
- 10.5.4. Operating business segments
- 10.5.5. Product portfolio
- 10.6. KidZania
- 10.6.1. Company overview
- 10.6.2. Key executives
- 10.6.3. Company snapshot
- 10.6.4. Operating business segments
- 10.6.5. Product portfolio
- 10.6.6. Key strategic moves and developments
- 10.7. SCENE75 ENTERTAINMENT CENTERS LLC
- 10.7.1. Company overview
- 10.7.2. Key executives
- 10.7.3. Company snapshot
- 10.7.4. Operating business segments
- 10.7.5. Product portfolio
- 10.8. SMAAASH
- 10.8.1. Company overview
- 10.8.2. Key executives
- 10.8.3. Company snapshot
- 10.8.4. Operating business segments
- 10.8.5. Product portfolio
- 10.9. CEC Entertainment Concepts, LP.
- 10.9.1. Company overview
- 10.9.2. Key executives
- 10.9.3. Company snapshot
- 10.9.4. Operating business segments
- 10.9.5. Product portfolio
- 10.9.6. Key strategic moves and developments
- 10.10. Cinergy Entertainment Group
- 10.10.1. Company overview
- 10.10.2. Key executives
- 10.10.3. Company snapshot
- 10.10.4. Operating business segments
- 10.10.5. Product portfolio
- 10.10.6. Key strategic moves and developments