 |
市場調査レポート
商品コード
1414716
水中ポンプ市場:タイプ別、容量別、用途別、最終用途産業別:世界の機会分析と産業予測、2023年~2032年Submersible Pumps Market By Type, By Capacity, By Application, By End-Use Industry : Global Opportunity Analysis and Industry Forecast, 2023-2032 |
||||||

| 水中ポンプ市場:タイプ別、容量別、用途別、最終用途産業別:世界の機会分析と産業予測、2023年~2032年 |
|
出版日: 2023年11月30日
発行: Allied Market Research
ページ情報: 英文 300 Pages
納期: 2~3営業日
|
- 全表示
- 概要
- 図表
- 目次
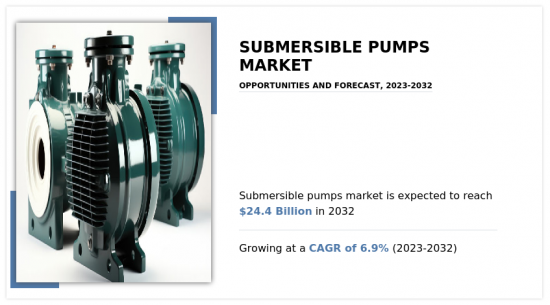
水中ポンプの市場規模は、2022年に127億米ドルと評価され、2023年から2032年にかけてCAGR 6.9%で成長し、2032年には244億米ドルに達すると予測されています。
水中ポンプの揚程とは、水中ポンプが水やその他の流体を効果的に持ち上げることができる垂直距離を指します。特定の用途に適した水中ポンプを選択する際に考慮すべき重要なパラメータです。これらのポンプは、様々なサイズと容量で利用可能であり、その分類は、多くの場合、次のような要因に基づいています。
1 揚程、流量、モーター出力。この情報は、特定のニーズに適した水中ポンプを選択する際に、十分な情報に基づいた意思決定を行うために不可欠です。
水中ポンプは、流体(通常は液体)の中に完全に浸かるように設計された装置であり、その流体の圧送を容易にします。これらのポンプは、ケーシングまたはハウジング内に設置された密閉モーターで構成されています。モーターは電気的に駆動され、ショートや故障のリスクなしに水中で作動するように複雑に設計されています。
水中ポンプ業界の信頼性は、モーターへの水の侵入を防ぐように設計されたシールシステムの有効性に依存しています。これらのポンプは通常、モーターがステンレス鋼製であるため、耐久性があり、周囲の流体からモーターを保護し、耐腐食性も備えています。
水中ポンプはコンパクトで、地上に広い設置スペースを必要としないため、狭い場所など様々な環境に適しています。動作音が静かで、騒音公害を低減できるため、騒音対策が必要な用途に有利です。水中ポンプは、水、廃水、油などさまざまな液体を扱うことができます。その結果、水中ポンプは農業、下水処理、鉱業、家庭用などさまざまな用途に使用されています。
1 水・廃水、石油・ガス、鉱業・建設、その他。さらに、以下のようなさまざまな地域における現在の市場動向も分析しています。
目次
第1章 イントロダクション
第2章 エグゼクティブサマリー
第3章 市場概要
- 市場の定義と範囲
- 主な調査結果
- 影響要因
- 主な投資機会
- ポーターのファイブフォース分析
- 市場力学
- 促進要因
- 水資源管理への注目の高まり
- 鉱業と建設業の急増
- 抑制要因
- 水中ポンプの目詰まりと摩耗
- 機会
- 水中ポンプのスマートポンプソリューション
- 水のリサイクルと処理
- 促進要因
- バリューチェーン分析
- 主要規制分析
- 特許情勢
第4章 水中ポンプ市場:タイプ別
- 概要
- 電動式
- 油圧式
- 空気駆動
第5章 水中ポンプ市場:容量別
- 概要
- 低
- 中
- 高
第6章 水中ポンプ市場:用途別
- 概要
- オープンピット
- ボアウェル
第7章 水中ポンプ市場:最終用途産業別
- 概要
- 上下水道
- 石油・ガス
- 鉱業・建設
- その他
第8章 水中ポンプ市場:地域別
- 概要
- 北米
- 米国
- カナダ
- メキシコ
- 欧州
- ドイツ
- フランス
- 英国
- スペイン
- イタリア
- その他
- アジア太平洋
- 中国
- インド
- 日本
- 韓国
- オーストラリア
- その他
- ラテンアメリカ・中東・アフリカ
- ブラジル
- 南アフリカ
- サウジアラビア
- その他
第9章 競争情勢
- イントロダクション
- 主要成功戦略
- 主要10社の製品マッピング
- 競合ダッシュボード
- 競合ヒートマップ
- 主要企業のポジショニング、2022年
第10章 企業プロファイル
- EBARA CORPORATION
- Franklin Electric
- Grundfos Pumps India Private Ltd.
- Kirloskar Brothers Limited.
- KSB Limited
- Pentair
- Sulzer Ltd.
- TSURUMI MANUFACTURING CO., LTD.
- WILO SE
- Xylem Inc.
LIST OF TABLES
- TABLE 01. GLOBAL SUBMERSIBLE PUMPS MARKET, BY TYPE, 2022-2032 ($MILLION)
- TABLE 02. SUBMERSIBLE PUMPS MARKET FOR ELECTRIC, BY REGION, 2022-2032 ($MILLION)
- TABLE 03. SUBMERSIBLE PUMPS MARKET FOR HYDRAULIC, BY REGION, 2022-2032 ($MILLION)
- TABLE 04. SUBMERSIBLE PUMPS MARKET FOR AIR-DRIVEN, BY REGION, 2022-2032 ($MILLION)
- TABLE 05. GLOBAL SUBMERSIBLE PUMPS MARKET, BY CAPACITY, 2022-2032 ($MILLION)
- TABLE 06. SUBMERSIBLE PUMPS MARKET FOR LOW, BY REGION, 2022-2032 ($MILLION)
- TABLE 07. SUBMERSIBLE PUMPS MARKET FOR MEDIUM, BY REGION, 2022-2032 ($MILLION)
- TABLE 08. SUBMERSIBLE PUMPS MARKET FOR HIGH, BY REGION, 2022-2032 ($MILLION)
- TABLE 09. GLOBAL SUBMERSIBLE PUMPS MARKET, BY APPLICATION, 2022-2032 ($MILLION)
- TABLE 10. SUBMERSIBLE PUMPS MARKET FOR OPEN PIT, BY REGION, 2022-2032 ($MILLION)
- TABLE 11. SUBMERSIBLE PUMPS MARKET FOR BOREWELL, BY REGION, 2022-2032 ($MILLION)
- TABLE 12. GLOBAL SUBMERSIBLE PUMPS MARKET, BY END-USE INDUSTRY, 2022-2032 ($MILLION)
- TABLE 13. SUBMERSIBLE PUMPS MARKET FOR WATER AND WASTEWATER, BY REGION, 2022-2032 ($MILLION)
- TABLE 14. SUBMERSIBLE PUMPS MARKET FOR OIL AND GAS, BY REGION, 2022-2032 ($MILLION)
- TABLE 15. SUBMERSIBLE PUMPS MARKET FOR MINING AND CONSTRUCTION, BY REGION, 2022-2032 ($MILLION)
- TABLE 16. SUBMERSIBLE PUMPS MARKET FOR OTHER, BY REGION, 2022-2032 ($MILLION)
- TABLE 17. SUBMERSIBLE PUMPS MARKET, BY REGION, 2022-2032 ($MILLION)
- TABLE 18. NORTH AMERICA SUBMERSIBLE PUMPS MARKET, BY TYPE, 2022-2032 ($MILLION)
- TABLE 19. NORTH AMERICA SUBMERSIBLE PUMPS MARKET, BY CAPACITY, 2022-2032 ($MILLION)
- TABLE 20. NORTH AMERICA SUBMERSIBLE PUMPS MARKET, BY APPLICATION, 2022-2032 ($MILLION)
- TABLE 21. NORTH AMERICA SUBMERSIBLE PUMPS MARKET, BY END-USE INDUSTRY, 2022-2032 ($MILLION)
- TABLE 22. NORTH AMERICA SUBMERSIBLE PUMPS MARKET, BY COUNTRY, 2022-2032 ($MILLION)
- TABLE 23. U.S. SUBMERSIBLE PUMPS MARKET, BY TYPE, 2022-2032 ($MILLION)
- TABLE 24. U.S. SUBMERSIBLE PUMPS MARKET, BY CAPACITY, 2022-2032 ($MILLION)
- TABLE 25. U.S. SUBMERSIBLE PUMPS MARKET, BY APPLICATION, 2022-2032 ($MILLION)
- TABLE 26. U.S. SUBMERSIBLE PUMPS MARKET, BY END-USE INDUSTRY, 2022-2032 ($MILLION)
- TABLE 27. CANADA SUBMERSIBLE PUMPS MARKET, BY TYPE, 2022-2032 ($MILLION)
- TABLE 28. CANADA SUBMERSIBLE PUMPS MARKET, BY CAPACITY, 2022-2032 ($MILLION)
- TABLE 29. CANADA SUBMERSIBLE PUMPS MARKET, BY APPLICATION, 2022-2032 ($MILLION)
- TABLE 30. CANADA SUBMERSIBLE PUMPS MARKET, BY END-USE INDUSTRY, 2022-2032 ($MILLION)
- TABLE 31. MEXICO SUBMERSIBLE PUMPS MARKET, BY TYPE, 2022-2032 ($MILLION)
- TABLE 32. MEXICO SUBMERSIBLE PUMPS MARKET, BY CAPACITY, 2022-2032 ($MILLION)
- TABLE 33. MEXICO SUBMERSIBLE PUMPS MARKET, BY APPLICATION, 2022-2032 ($MILLION)
- TABLE 34. MEXICO SUBMERSIBLE PUMPS MARKET, BY END-USE INDUSTRY, 2022-2032 ($MILLION)
- TABLE 35. EUROPE SUBMERSIBLE PUMPS MARKET, BY TYPE, 2022-2032 ($MILLION)
- TABLE 36. EUROPE SUBMERSIBLE PUMPS MARKET, BY CAPACITY, 2022-2032 ($MILLION)
- TABLE 37. EUROPE SUBMERSIBLE PUMPS MARKET, BY APPLICATION, 2022-2032 ($MILLION)
- TABLE 38. EUROPE SUBMERSIBLE PUMPS MARKET, BY END-USE INDUSTRY, 2022-2032 ($MILLION)
- TABLE 39. EUROPE SUBMERSIBLE PUMPS MARKET, BY COUNTRY, 2022-2032 ($MILLION)
- TABLE 40. GERMANY SUBMERSIBLE PUMPS MARKET, BY TYPE, 2022-2032 ($MILLION)
- TABLE 41. GERMANY SUBMERSIBLE PUMPS MARKET, BY CAPACITY, 2022-2032 ($MILLION)
- TABLE 42. GERMANY SUBMERSIBLE PUMPS MARKET, BY APPLICATION, 2022-2032 ($MILLION)
- TABLE 43. GERMANY SUBMERSIBLE PUMPS MARKET, BY END-USE INDUSTRY, 2022-2032 ($MILLION)
- TABLE 44. FRANCE SUBMERSIBLE PUMPS MARKET, BY TYPE, 2022-2032 ($MILLION)
- TABLE 45. FRANCE SUBMERSIBLE PUMPS MARKET, BY CAPACITY, 2022-2032 ($MILLION)
- TABLE 46. FRANCE SUBMERSIBLE PUMPS MARKET, BY APPLICATION, 2022-2032 ($MILLION)
- TABLE 47. FRANCE SUBMERSIBLE PUMPS MARKET, BY END-USE INDUSTRY, 2022-2032 ($MILLION)
- TABLE 48. UK SUBMERSIBLE PUMPS MARKET, BY TYPE, 2022-2032 ($MILLION)
- TABLE 49. UK SUBMERSIBLE PUMPS MARKET, BY CAPACITY, 2022-2032 ($MILLION)
- TABLE 50. UK SUBMERSIBLE PUMPS MARKET, BY APPLICATION, 2022-2032 ($MILLION)
- TABLE 51. UK SUBMERSIBLE PUMPS MARKET, BY END-USE INDUSTRY, 2022-2032 ($MILLION)
- TABLE 52. SPAIN SUBMERSIBLE PUMPS MARKET, BY TYPE, 2022-2032 ($MILLION)
- TABLE 53. SPAIN SUBMERSIBLE PUMPS MARKET, BY CAPACITY, 2022-2032 ($MILLION)
- TABLE 54. SPAIN SUBMERSIBLE PUMPS MARKET, BY APPLICATION, 2022-2032 ($MILLION)
- TABLE 55. SPAIN SUBMERSIBLE PUMPS MARKET, BY END-USE INDUSTRY, 2022-2032 ($MILLION)
- TABLE 56. ITALY SUBMERSIBLE PUMPS MARKET, BY TYPE, 2022-2032 ($MILLION)
- TABLE 57. ITALY SUBMERSIBLE PUMPS MARKET, BY CAPACITY, 2022-2032 ($MILLION)
- TABLE 58. ITALY SUBMERSIBLE PUMPS MARKET, BY APPLICATION, 2022-2032 ($MILLION)
- TABLE 59. ITALY SUBMERSIBLE PUMPS MARKET, BY END-USE INDUSTRY, 2022-2032 ($MILLION)
- TABLE 60. REST OF EUROPE SUBMERSIBLE PUMPS MARKET, BY TYPE, 2022-2032 ($MILLION)
- TABLE 61. REST OF EUROPE SUBMERSIBLE PUMPS MARKET, BY CAPACITY, 2022-2032 ($MILLION)
- TABLE 62. REST OF EUROPE SUBMERSIBLE PUMPS MARKET, BY APPLICATION, 2022-2032 ($MILLION)
- TABLE 63. REST OF EUROPE SUBMERSIBLE PUMPS MARKET, BY END-USE INDUSTRY, 2022-2032 ($MILLION)
- TABLE 64. ASIA-PACIFIC SUBMERSIBLE PUMPS MARKET, BY TYPE, 2022-2032 ($MILLION)
- TABLE 65. ASIA-PACIFIC SUBMERSIBLE PUMPS MARKET, BY CAPACITY, 2022-2032 ($MILLION)
- TABLE 66. ASIA-PACIFIC SUBMERSIBLE PUMPS MARKET, BY APPLICATION, 2022-2032 ($MILLION)
- TABLE 67. ASIA-PACIFIC SUBMERSIBLE PUMPS MARKET, BY END-USE INDUSTRY, 2022-2032 ($MILLION)
- TABLE 68. ASIA-PACIFIC SUBMERSIBLE PUMPS MARKET, BY COUNTRY, 2022-2032 ($MILLION)
- TABLE 69. CHINA SUBMERSIBLE PUMPS MARKET, BY TYPE, 2022-2032 ($MILLION)
- TABLE 70. CHINA SUBMERSIBLE PUMPS MARKET, BY CAPACITY, 2022-2032 ($MILLION)
- TABLE 71. CHINA SUBMERSIBLE PUMPS MARKET, BY APPLICATION, 2022-2032 ($MILLION)
- TABLE 72. CHINA SUBMERSIBLE PUMPS MARKET, BY END-USE INDUSTRY, 2022-2032 ($MILLION)
- TABLE 73. INDIA SUBMERSIBLE PUMPS MARKET, BY TYPE, 2022-2032 ($MILLION)
- TABLE 74. INDIA SUBMERSIBLE PUMPS MARKET, BY CAPACITY, 2022-2032 ($MILLION)
- TABLE 75. INDIA SUBMERSIBLE PUMPS MARKET, BY APPLICATION, 2022-2032 ($MILLION)
- TABLE 76. INDIA SUBMERSIBLE PUMPS MARKET, BY END-USE INDUSTRY, 2022-2032 ($MILLION)
- TABLE 77. JAPAN SUBMERSIBLE PUMPS MARKET, BY TYPE, 2022-2032 ($MILLION)
- TABLE 78. JAPAN SUBMERSIBLE PUMPS MARKET, BY CAPACITY, 2022-2032 ($MILLION)
- TABLE 79. JAPAN SUBMERSIBLE PUMPS MARKET, BY APPLICATION, 2022-2032 ($MILLION)
- TABLE 80. JAPAN SUBMERSIBLE PUMPS MARKET, BY END-USE INDUSTRY, 2022-2032 ($MILLION)
- TABLE 81. SOUTH KOREA SUBMERSIBLE PUMPS MARKET, BY TYPE, 2022-2032 ($MILLION)
- TABLE 82. SOUTH KOREA SUBMERSIBLE PUMPS MARKET, BY CAPACITY, 2022-2032 ($MILLION)
- TABLE 83. SOUTH KOREA SUBMERSIBLE PUMPS MARKET, BY APPLICATION, 2022-2032 ($MILLION)
- TABLE 84. SOUTH KOREA SUBMERSIBLE PUMPS MARKET, BY END-USE INDUSTRY, 2022-2032 ($MILLION)
- TABLE 85. AUSTRALIA SUBMERSIBLE PUMPS MARKET, BY TYPE, 2022-2032 ($MILLION)
- TABLE 86. AUSTRALIA SUBMERSIBLE PUMPS MARKET, BY CAPACITY, 2022-2032 ($MILLION)
- TABLE 87. AUSTRALIA SUBMERSIBLE PUMPS MARKET, BY APPLICATION, 2022-2032 ($MILLION)
- TABLE 88. AUSTRALIA SUBMERSIBLE PUMPS MARKET, BY END-USE INDUSTRY, 2022-2032 ($MILLION)
- TABLE 89. REST OF ASIA-PACIFIC SUBMERSIBLE PUMPS MARKET, BY TYPE, 2022-2032 ($MILLION)
- TABLE 90. REST OF ASIA-PACIFIC SUBMERSIBLE PUMPS MARKET, BY CAPACITY, 2022-2032 ($MILLION)
- TABLE 91. REST OF ASIA-PACIFIC SUBMERSIBLE PUMPS MARKET, BY APPLICATION, 2022-2032 ($MILLION)
- TABLE 92. REST OF ASIA-PACIFIC SUBMERSIBLE PUMPS MARKET, BY END-USE INDUSTRY, 2022-2032 ($MILLION)
- TABLE 93. LAMEA SUBMERSIBLE PUMPS MARKET, BY TYPE, 2022-2032 ($MILLION)
- TABLE 94. LAMEA SUBMERSIBLE PUMPS MARKET, BY CAPACITY, 2022-2032 ($MILLION)
- TABLE 95. LAMEA SUBMERSIBLE PUMPS MARKET, BY APPLICATION, 2022-2032 ($MILLION)
- TABLE 96. LAMEA SUBMERSIBLE PUMPS MARKET, BY END-USE INDUSTRY, 2022-2032 ($MILLION)
- TABLE 97. LAMEA SUBMERSIBLE PUMPS MARKET, BY COUNTRY, 2022-2032 ($MILLION)
- TABLE 98. BRAZIL SUBMERSIBLE PUMPS MARKET, BY TYPE, 2022-2032 ($MILLION)
- TABLE 99. BRAZIL SUBMERSIBLE PUMPS MARKET, BY CAPACITY, 2022-2032 ($MILLION)
- TABLE 100. BRAZIL SUBMERSIBLE PUMPS MARKET, BY APPLICATION, 2022-2032 ($MILLION)
- TABLE 101. BRAZIL SUBMERSIBLE PUMPS MARKET, BY END-USE INDUSTRY, 2022-2032 ($MILLION)
- TABLE 102. SOUTH AFRICA SUBMERSIBLE PUMPS MARKET, BY TYPE, 2022-2032 ($MILLION)
- TABLE 103. SOUTH AFRICA SUBMERSIBLE PUMPS MARKET, BY CAPACITY, 2022-2032 ($MILLION)
- TABLE 104. SOUTH AFRICA SUBMERSIBLE PUMPS MARKET, BY APPLICATION, 2022-2032 ($MILLION)
- TABLE 105. SOUTH AFRICA SUBMERSIBLE PUMPS MARKET, BY END-USE INDUSTRY, 2022-2032 ($MILLION)
- TABLE 106. SAUDI ARABIA SUBMERSIBLE PUMPS MARKET, BY TYPE, 2022-2032 ($MILLION)
- TABLE 107. SAUDI ARABIA SUBMERSIBLE PUMPS MARKET, BY CAPACITY, 2022-2032 ($MILLION)
- TABLE 108. SAUDI ARABIA SUBMERSIBLE PUMPS MARKET, BY APPLICATION, 2022-2032 ($MILLION)
- TABLE 109. SAUDI ARABIA SUBMERSIBLE PUMPS MARKET, BY END-USE INDUSTRY, 2022-2032 ($MILLION)
- TABLE 110. REST OF LAMEA SUBMERSIBLE PUMPS MARKET, BY TYPE, 2022-2032 ($MILLION)
- TABLE 111. REST OF LAMEA SUBMERSIBLE PUMPS MARKET, BY CAPACITY, 2022-2032 ($MILLION)
- TABLE 112. REST OF LAMEA SUBMERSIBLE PUMPS MARKET, BY APPLICATION, 2022-2032 ($MILLION)
- TABLE 113. REST OF LAMEA SUBMERSIBLE PUMPS MARKET, BY END-USE INDUSTRY, 2022-2032 ($MILLION)
- TABLE 114. EBARA CORPORATION: KEY EXECUTIVES
- TABLE 115. EBARA CORPORATION: COMPANY SNAPSHOT
- TABLE 116. EBARA CORPORATION: PRODUCT SEGMENTS
- TABLE 117. EBARA CORPORATION: PRODUCT PORTFOLIO
- TABLE 118. FRANKLIN ELECTRIC: KEY EXECUTIVES
- TABLE 119. FRANKLIN ELECTRIC: COMPANY SNAPSHOT
- TABLE 120. FRANKLIN ELECTRIC: PRODUCT SEGMENTS
- TABLE 121. FRANKLIN ELECTRIC: PRODUCT PORTFOLIO
- TABLE 122. GRUNDFOS PUMPS INDIA PRIVATE LTD.: KEY EXECUTIVES
- TABLE 123. GRUNDFOS PUMPS INDIA PRIVATE LTD.: COMPANY SNAPSHOT
- TABLE 124. GRUNDFOS PUMPS INDIA PRIVATE LTD.: PRODUCT SEGMENTS
- TABLE 125. GRUNDFOS PUMPS INDIA PRIVATE LTD.: PRODUCT PORTFOLIO
- TABLE 126. KIRLOSKAR BROTHERS LIMITED.: KEY EXECUTIVES
- TABLE 127. KIRLOSKAR BROTHERS LIMITED.: COMPANY SNAPSHOT
- TABLE 128. KIRLOSKAR BROTHERS LIMITED.: PRODUCT SEGMENTS
- TABLE 129. KIRLOSKAR BROTHERS LIMITED.: PRODUCT PORTFOLIO
- TABLE 130. KSB LIMITED: KEY EXECUTIVES
- TABLE 131. KSB LIMITED: COMPANY SNAPSHOT
- TABLE 132. KSB LIMITED: PRODUCT SEGMENTS
- TABLE 133. KSB LIMITED: PRODUCT PORTFOLIO
- TABLE 134. KSB LIMITED: KEY STRATERGIES
- TABLE 135. PENTAIR: KEY EXECUTIVES
- TABLE 136. PENTAIR: COMPANY SNAPSHOT
- TABLE 137. PENTAIR: PRODUCT SEGMENTS
- TABLE 138. PENTAIR: PRODUCT PORTFOLIO
- TABLE 139. SULZER LTD.: KEY EXECUTIVES
- TABLE 140. SULZER LTD.: COMPANY SNAPSHOT
- TABLE 141. SULZER LTD.: PRODUCT SEGMENTS
- TABLE 142. SULZER LTD.: SERVICE SEGMENTS
- TABLE 143. SULZER LTD.: PRODUCT PORTFOLIO
- TABLE 144. TSURUMI MANUFACTURING CO., LTD.: KEY EXECUTIVES
- TABLE 145. TSURUMI MANUFACTURING CO., LTD.: COMPANY SNAPSHOT
- TABLE 146. TSURUMI MANUFACTURING CO., LTD.: PRODUCT SEGMENTS
- TABLE 147. TSURUMI MANUFACTURING CO., LTD.: PRODUCT PORTFOLIO
- TABLE 148. WILO SE: KEY EXECUTIVES
- TABLE 149. WILO SE: COMPANY SNAPSHOT
- TABLE 150. WILO SE: PRODUCT SEGMENTS
- TABLE 151. WILO SE: PRODUCT PORTFOLIO
- TABLE 152. XYLEM INC.: KEY EXECUTIVES
- TABLE 153. XYLEM INC.: COMPANY SNAPSHOT
- TABLE 154. XYLEM INC.: PRODUCT SEGMENTS
- TABLE 155. XYLEM INC.: PRODUCT PORTFOLIO
LIST OF FIGURES
- FIGURE 01. SUBMERSIBLE PUMPS MARKET, 2022-2032
- FIGURE 02. SEGMENTATION OF SUBMERSIBLE PUMPS MARKET,2022-2032
- FIGURE 03. TOP IMPACTING FACTORS IN SUBMERSIBLE PUMPS MARKET (2022 TO 2032)
- FIGURE 04. TOP INVESTMENT POCKETS IN SUBMERSIBLE PUMPS MARKET (2023-2032)
- FIGURE 05. HIGH BARGAINING POWER OF SUPPLIERS
- FIGURE 06. MODERATE THREAT OF NEW ENTRANTS
- FIGURE 07. MODERATE THREAT OF SUBSTITUTES
- FIGURE 08. MODERATE INTENSITY OF RIVALRY
- FIGURE 09. MODERATE BARGAINING POWER OF BUYERS
- FIGURE 10. GLOBAL SUBMERSIBLE PUMPS MARKET:DRIVERS, RESTRAINTS AND OPPORTUNITIES
- FIGURE 11. IMPACT OF KEY REGULATION: SUBMERSIBLE PUMPS MARKET
- FIGURE 12. PATENT ANALYSIS BY COMPANY
- FIGURE 13. PATENT ANALYSIS BY COUNTRY
- FIGURE 14. SUBMERSIBLE PUMPS MARKET, BY TYPE, 2022 AND 2032(%)
- FIGURE 15. COMPARATIVE SHARE ANALYSIS OF SUBMERSIBLE PUMPS MARKET FOR ELECTRIC, BY COUNTRY 2022 AND 2032(%)
- FIGURE 16. COMPARATIVE SHARE ANALYSIS OF SUBMERSIBLE PUMPS MARKET FOR HYDRAULIC, BY COUNTRY 2022 AND 2032(%)
- FIGURE 17. COMPARATIVE SHARE ANALYSIS OF SUBMERSIBLE PUMPS MARKET FOR AIR-DRIVEN, BY COUNTRY 2022 AND 2032(%)
- FIGURE 18. SUBMERSIBLE PUMPS MARKET, BY CAPACITY, 2022 AND 2032(%)
- FIGURE 19. COMPARATIVE SHARE ANALYSIS OF SUBMERSIBLE PUMPS MARKET FOR LOW, BY COUNTRY 2022 AND 2032(%)
- FIGURE 20. COMPARATIVE SHARE ANALYSIS OF SUBMERSIBLE PUMPS MARKET FOR MEDIUM, BY COUNTRY 2022 AND 2032(%)
- FIGURE 21. COMPARATIVE SHARE ANALYSIS OF SUBMERSIBLE PUMPS MARKET FOR HIGH, BY COUNTRY 2022 AND 2032(%)
- FIGURE 22. SUBMERSIBLE PUMPS MARKET, BY APPLICATION, 2022 AND 2032(%)
- FIGURE 23. COMPARATIVE SHARE ANALYSIS OF SUBMERSIBLE PUMPS MARKET FOR OPEN PIT, BY COUNTRY 2022 AND 2032(%)
- FIGURE 24. COMPARATIVE SHARE ANALYSIS OF SUBMERSIBLE PUMPS MARKET FOR BOREWELL, BY COUNTRY 2022 AND 2032(%)
- FIGURE 25. SUBMERSIBLE PUMPS MARKET, BY END-USE INDUSTRY, 2022 AND 2032(%)
- FIGURE 26. COMPARATIVE SHARE ANALYSIS OF SUBMERSIBLE PUMPS MARKET FOR WATER AND WASTEWATER, BY COUNTRY 2022 AND 2032(%)
- FIGURE 27. COMPARATIVE SHARE ANALYSIS OF SUBMERSIBLE PUMPS MARKET FOR OIL AND GAS, BY COUNTRY 2022 AND 2032(%)
- FIGURE 28. COMPARATIVE SHARE ANALYSIS OF SUBMERSIBLE PUMPS MARKET FOR MINING AND CONSTRUCTION, BY COUNTRY 2022 AND 2032(%)
- FIGURE 29. COMPARATIVE SHARE ANALYSIS OF SUBMERSIBLE PUMPS MARKET FOR OTHER, BY COUNTRY 2022 AND 2032(%)
- FIGURE 30. SUBMERSIBLE PUMPS MARKET BY REGION, 2022 AND 2032(%)
- FIGURE 31. U.S. SUBMERSIBLE PUMPS MARKET, 2022-2032 ($MILLION)
- FIGURE 32. CANADA SUBMERSIBLE PUMPS MARKET, 2022-2032 ($MILLION)
- FIGURE 33. MEXICO SUBMERSIBLE PUMPS MARKET, 2022-2032 ($MILLION)
- FIGURE 34. GERMANY SUBMERSIBLE PUMPS MARKET, 2022-2032 ($MILLION)
- FIGURE 35. FRANCE SUBMERSIBLE PUMPS MARKET, 2022-2032 ($MILLION)
- FIGURE 36. UK SUBMERSIBLE PUMPS MARKET, 2022-2032 ($MILLION)
- FIGURE 37. SPAIN SUBMERSIBLE PUMPS MARKET, 2022-2032 ($MILLION)
- FIGURE 38. ITALY SUBMERSIBLE PUMPS MARKET, 2022-2032 ($MILLION)
- FIGURE 39. REST OF EUROPE SUBMERSIBLE PUMPS MARKET, 2022-2032 ($MILLION)
- FIGURE 40. CHINA SUBMERSIBLE PUMPS MARKET, 2022-2032 ($MILLION)
- FIGURE 41. INDIA SUBMERSIBLE PUMPS MARKET, 2022-2032 ($MILLION)
- FIGURE 42. JAPAN SUBMERSIBLE PUMPS MARKET, 2022-2032 ($MILLION)
- FIGURE 43. SOUTH KOREA SUBMERSIBLE PUMPS MARKET, 2022-2032 ($MILLION)
- FIGURE 44. AUSTRALIA SUBMERSIBLE PUMPS MARKET, 2022-2032 ($MILLION)
- FIGURE 45. REST OF ASIA-PACIFIC SUBMERSIBLE PUMPS MARKET, 2022-2032 ($MILLION)
- FIGURE 46. BRAZIL SUBMERSIBLE PUMPS MARKET, 2022-2032 ($MILLION)
- FIGURE 47. SOUTH AFRICA SUBMERSIBLE PUMPS MARKET, 2022-2032 ($MILLION)
- FIGURE 48. SAUDI ARABIA SUBMERSIBLE PUMPS MARKET, 2022-2032 ($MILLION)
- FIGURE 49. REST OF LAMEA SUBMERSIBLE PUMPS MARKET, 2022-2032 ($MILLION)
- FIGURE 50. TOP WINNING STRATEGIES, BY YEAR (2021)
- FIGURE 51. TOP WINNING STRATEGIES, BY DEVELOPMENT (2021)
- FIGURE 52. TOP WINNING STRATEGIES, BY COMPANY (2021)
- FIGURE 53. PRODUCT MAPPING OF TOP 10 PLAYERS
- FIGURE 54. COMPETITIVE DASHBOARD
- FIGURE 55. COMPETITIVE HEATMAP: SUBMERSIBLE PUMPS MARKET
- FIGURE 56. TOP PLAYER POSITIONING, 2022
- FIGURE 57. EBARA CORPORATION: NET REVENUE, 2020-2022 ($MILLION)
- FIGURE 58. EBARA CORPORATION: RESEARCH & DEVELOPMENT EXPENDITURE, 2020-2022 ($MILLION)
- FIGURE 59. EBARA CORPORATION: REVENUE SHARE BY SEGMENT, 2022 (%)
- FIGURE 60. EBARA CORPORATION: REVENUE SHARE BY REGION, 2022 (%)
- FIGURE 61. FRANKLIN ELECTRIC: NET SALES, 2020-2022 ($MILLION)
- FIGURE 62. FRANKLIN ELECTRIC: RESEARCH & DEVELOPMENT EXPENDITURE, 2020-2022 ($MILLION)
- FIGURE 63. FRANKLIN ELECTRIC: REVENUE SHARE BY REGION, 2022 (%)
- FIGURE 64. FRANKLIN ELECTRIC: REVENUE SHARE BY SEGMENT, 2022 (%)
- FIGURE 65. KIRLOSKAR BROTHERS LIMITED.: NET REVENUE, 2020-2022 ($MILLION)
- FIGURE 66. KSB LIMITED: SALES REVENUE, 2020-2022 ($MILLION)
- FIGURE 67. KSB LIMITED: REVENUE SHARE BY SEGMENT, 2022 (%)
- FIGURE 68. PENTAIR: NET SALES, 2020-2022 ($MILLION)
- FIGURE 69. PENTAIR: RESEARCH & DEVELOPMENT EXPENDITURE, 2020-2022 ($MILLION)
- FIGURE 70. PENTAIR: REVENUE SHARE BY SEGMENT, 2022 (%)
- FIGURE 71. PENTAIR: REVENUE SHARE BY REGION, 2022 (%)
- FIGURE 72. SULZER LTD.: NET SALES, 2020-2022 ($MILLION)
- FIGURE 73. SULZER LTD.: RESEARCH & DEVELOPMENT EXPENDITURE, 2020-2022 ($MILLION)
- FIGURE 74. SULZER LTD.: REVENUE SHARE BY SEGMENT, 2022 (%)
- FIGURE 75. SULZER LTD.: REVENUE SHARE BY REGION, 2022 (%)
- FIGURE 76. TSURUMI MANUFACTURING CO., LTD.: NET SALES, 2020-2022 ($MILLION)
- FIGURE 77. WILO SE: NET SALES, 2020-2022 ($MILLION)
- FIGURE 78. WILO SE: RESEARCH & DEVELOPMENT EXPENDITURE, 2020-2022 ($MILLION)
- FIGURE 79. WILO SE: REVENUE SHARE BY REGION, 2022 (%)
- FIGURE 80. XYLEM INC.: NET REVENUE, 2020-2022 ($MILLION)
- FIGURE 81. XYLEM INC.: RESEARCH & DEVELOPMENT EXPENDITURE, 2020-2022 ($MILLION)
- FIGURE 82. XYLEM INC.: REVENUE SHARE BY SEGMENT, 2022 (%)
- FIGURE 83. XYLEM INC.: REVENUE SHARE BY REGION, 2022 (%)
According to a new report published by Allied Market Research, titled, "Submersible Pumps Market," The submersible pumps market size was valued at $12.7 billion in 2022, and is estimated to reach $24.4 billion by 2032, growing at a CAGR of 6.9% from 2023 to 2032.
Submersible pumps head refers to the vertical distance that a submersible pump can effectively lift water or other fluids. It's a critical parameter to consider when choosing the right submersible pump for a particular application. These pumps are available in various sizes and capacities, and their classification is often based on factors such as
1) head, flow rate, and motor power. This information is essential for making informed decisions when it comes to selecting the appropriate submersible pump for specific needs.
Submersible pump is a device designed to be fully submerged in a fluid, typically liquid, to facilitate the pumping of that fluid. These pumps consist of a hermetically sealed motor, which is placed within a casing or housing. The motor is electrically driven and is intricately designed to operate while submerged without the risk of short-circuiting or malfunction.
The reliability of submersible pumps industry relies on the effectiveness of their seal systems, which are designed to prevent water from entering the motor. These pumps typically have motor made of stainless steel, providing durability and protection for the motor against the surrounding fluid while also offering corrosion resistance.
Submersible pumps are compact and do not require extensive above-ground space for installation, making them suitable for various environments, including confined spaces. They operate quietly, reducing noise pollution, which is advantageous in applications where noise control is a concern. Their versatility is another significant advantage; submersible pumps handle various liquids, including water, wastewater, oil, and more. Consequently, they find applications in agriculture, sewage treatment, mining, and domestic use.
For the purpose of analysis, the submersible pumps market share covers segmentation based on type, capacity, application, end-use industry, and region. The report provides information by type including electric, hydraulic, and air driven. On the basis of capacity, submersible pumps are divided into low, medium, and high. Furthermore, application covered in the study includes Open Pit, and Borewell. Moreover, it outlines the details of the end-use industry such as
1) water and wastewater, oil & gas, mining and construction, and others. In addition, it analyzes the current market trends across different regions such as
1) North America, Europe, Asia-Pacific, and LAMEA.
By type air-driven segment is the fastest-growing segment during the forecast period. Air-driven submersible pumps are often lauded for their energy efficiency. The use of compressed air allows for precise control over the pump's speed and output, resulting in reduced energy consumption compared to traditional electric pumps. This makes them an environmentally friendly option and can lead to cost savings in the long run. Air-driven submersible pumps operate without electricity, they are often preferred in situations where the risk of electrical hazards is high, such as
- 1) in waterlogged areas or during specific industrial processes.
- Increase in focus on water resource management drives the growth of submersible pumps market growth. Submersible pumps play a crucial role in various water-related applications. In regions where surface water is scarce, these pumps are submerged in wells to efficiently extract groundwater, ensuring a reliable water supply. Additionally, they are vital in wastewater treatment plants, effectively moving sewage and contaminants for proper processing. The Manitoba government, in November 2022, incorporated submersible pumps into its water management strategy to protect water ecosystems while promoting sustainable development. Furthermore, in global agriculture, these pumps are essential for irrigation in areas with insufficient rainfall, offering energy-efficient and reliable water distribution for crop growth.
- Smart pumping solutions in submersible pumps finds a lucrative opportunity in the submersible pumps market. IoT technology has become integral in industries, especially with the rise of smart submersible pumps. The pumps, such as
- 1) TTP Ventus' SPM-041, utilize sensors to monitor parameters such as
- 1) flow rate and pressure, providing real-time data to a central system for optimized performance. The smart pumps enable efficient closed-loop control, weigh only 11g, and offer various control options. The benefits extend to energy conservation and eco-friendly water management, particularly in municipalities where IoT-powered pumps optimize water distribution networks. Industries like manufacturing and mining also enhance their processes through smart submersible pumps integrated into industrial automation systems, ensuring precise control and reducing water wastage.
Key Benefits For Stakeholders
- This report provides a quantitative analysis of the market segments, current trends, estimations, and dynamics of the submersible pumps market analysis from 2022 to 2032 to identify the prevailing submersible pumps market opportunities.
- The market research is offered along with information related to key drivers, restraints, and opportunities.
- Porter's five forces analysis highlights the potency of buyers and suppliers to enable stakeholders make profit-oriented business decisions and strengthen their supplier-buyer network.
- In-depth analysis of the submersible pumps market segmentation assists to determine the prevailing market opportunities.
- Major countries in each region are mapped according to their revenue contribution to the global market.
- Market player positioning facilitates benchmarking and provides a clear understanding of the present position of the market players.
- The report includes the analysis of the regional as well as global submersible pumps market trends, key players, market segments, application areas, and market growth strategies.
Additional benefits you will get with this purchase are:
- Quarterly Update and* (only available with a corporate license, on listed price)
- 5 additional Company Profile of client Choice pre- or Post-purchase, as a free update.
- Free Upcoming Version on the Purchase of Five and Enterprise User License.
- 16 analyst hours of support* (post-purchase, if you find additional data requirements upon review of the report, you may receive support amounting to 16 analyst hours to solve questions, and post-sale queries)
- 15% Free Customization* (in case the scope or segment of the report does not match your requirements, 15% is equivalent to 3 working days of free work, applicable once)
- Free data Pack on the Five and Enterprise User License. (Excel version of the report)
- Free Updated report if the report is 6-12 months old or older.
- 24-hour priority response*
- Free Industry updates and white papers.
Possible Customization with this report (with additional cost and timeline, please talk to the sales executive to know more)
- End user preferences and pain points
- Investment Opportunities
- Product Life Cycles
- Upcoming/New Entrant by Regions
- Technology Trend Analysis
- Market share analysis of players by products/segments
- New Product Development/ Product Matrix of Key Players
- Patient/epidemiology data at country, region, global level
- Regulatory Guidelines
- Additional company profiles with specific to client's interest
- Additional country or region analysis- market size and forecast
- Criss-cross segment analysis- market size and forecast
- Expanded list for Company Profiles
- Historic market data
- Import Export Analysis/Data
- Key player details (including location, contact details, supplier/vendor network etc. in excel format)
- Market share analysis of players at global/region/country level
Key Market Segments
By Type
- Hydraulic
- Air-Driven
- Electric
By Capacity
- Low
- Medium
- High
By Application
- Open Pit
- Borewell
By End-Use Industry
- Water and Wastewater
- Oil and Gas
- Mining and Construction
- Other
By Region
- North America
- U.S.
- Canada
- Mexico
- Europe
- Germany
- France
- UK
- Spain
- Italy
- Rest of Europe
- Asia-Pacific
- China
- India
- Japan
- South Korea
- Australia
- Rest of Asia-Pacific
- LAMEA
- Brazil
- South Africa
- Saudi Arabia
- Rest of LAMEA
Key Market Players:
- Kirloskar Brothers Limited.
- Pentair
- WILO SE
- KSB Limited
- TSURUMI MANUFACTURING CO., LTD.
- Xylem Inc.
- EBARA CORPORATION
- Sulzer Ltd.
- Grundfos Pumps India Private Ltd.
- Franklin Electric
TABLE OF CONTENTS
CHAPTER 1: INTRODUCTION
- 1.1. Report description
- 1.2. Key market segments
- 1.3. Key benefits to the stakeholders
- 1.4. Research methodology
- 1.4.1. Primary research
- 1.4.2. Secondary research
- 1.4.3. Analyst tools and models
CHAPTER 2: EXECUTIVE SUMMARY
- 2.1. CXO Perspective
CHAPTER 3: MARKET OVERVIEW
- 3.1. Market definition and scope
- 3.2. Key findings
- 3.2.1. Top impacting factors
- 3.2.2. Top investment pockets
- 3.3. Porter's five forces analysis
- 3.3.1. High bargaining power of suppliers
- 3.3.2. Moderate threat of new entrants
- 3.3.3. Moderate threat of substitutes
- 3.3.4. Moderate intensity of rivalry
- 3.3.5. Moderate bargaining power of buyers
- 3.4. Market dynamics
- 3.4.1. Drivers
- 3.4.1.1. Increase in focus on water resource management
- 3.4.1.2. Surge in mining and construction industry
- 3.4.2. Restraints
- 3.4.2.1. Clogging and abrasion of submersible pumps
- 3.4.3. Opportunities
- 3.4.3.1. Smart pumping solutions in submersible pumps
- 3.4.3.2. Water recycling and treatment
- 3.4.1. Drivers
- 3.5. Value Chain Analysis
- 3.6. Key Regulation Analysis
- 3.7. Patent Landscape
CHAPTER 4: SUBMERSIBLE PUMPS MARKET, BY TYPE
- 4.1. Overview
- 4.1.1. Market size and forecast
- 4.2. Electric
- 4.2.1. Key market trends, growth factors and opportunities
- 4.2.2. Market size and forecast, by region
- 4.2.3. Market share analysis by country
- 4.3. Hydraulic
- 4.3.1. Key market trends, growth factors and opportunities
- 4.3.2. Market size and forecast, by region
- 4.3.3. Market share analysis by country
- 4.4. Air-Driven
- 4.4.1. Key market trends, growth factors and opportunities
- 4.4.2. Market size and forecast, by region
- 4.4.3. Market share analysis by country
CHAPTER 5: SUBMERSIBLE PUMPS MARKET, BY CAPACITY
- 5.1. Overview
- 5.1.1. Market size and forecast
- 5.2. Low
- 5.2.1. Key market trends, growth factors and opportunities
- 5.2.2. Market size and forecast, by region
- 5.2.3. Market share analysis by country
- 5.3. Medium
- 5.3.1. Key market trends, growth factors and opportunities
- 5.3.2. Market size and forecast, by region
- 5.3.3. Market share analysis by country
- 5.4. High
- 5.4.1. Key market trends, growth factors and opportunities
- 5.4.2. Market size and forecast, by region
- 5.4.3. Market share analysis by country
CHAPTER 6: SUBMERSIBLE PUMPS MARKET, BY APPLICATION
- 6.1. Overview
- 6.1.1. Market size and forecast
- 6.2. Open Pit
- 6.2.1. Key market trends, growth factors and opportunities
- 6.2.2. Market size and forecast, by region
- 6.2.3. Market share analysis by country
- 6.3. Borewell
- 6.3.1. Key market trends, growth factors and opportunities
- 6.3.2. Market size and forecast, by region
- 6.3.3. Market share analysis by country
CHAPTER 7: SUBMERSIBLE PUMPS MARKET, BY END-USE INDUSTRY
- 7.1. Overview
- 7.1.1. Market size and forecast
- 7.2. Water and Wastewater
- 7.2.1. Key market trends, growth factors and opportunities
- 7.2.2. Market size and forecast, by region
- 7.2.3. Market share analysis by country
- 7.3. Oil and Gas
- 7.3.1. Key market trends, growth factors and opportunities
- 7.3.2. Market size and forecast, by region
- 7.3.3. Market share analysis by country
- 7.4. Mining and Construction
- 7.4.1. Key market trends, growth factors and opportunities
- 7.4.2. Market size and forecast, by region
- 7.4.3. Market share analysis by country
- 7.5. Other
- 7.5.1. Key market trends, growth factors and opportunities
- 7.5.2. Market size and forecast, by region
- 7.5.3. Market share analysis by country
CHAPTER 8: SUBMERSIBLE PUMPS MARKET, BY REGION
- 8.1. Overview
- 8.1.1. Market size and forecast By Region
- 8.2. North America
- 8.2.1. Key market trends, growth factors and opportunities
- 8.2.2. Market size and forecast, by Type
- 8.2.3. Market size and forecast, by Capacity
- 8.2.4. Market size and forecast, by Application
- 8.2.5. Market size and forecast, by End-Use Industry
- 8.2.6. Market size and forecast, by country
- 8.2.6.1. U.S.
- 8.2.6.1.1. Market size and forecast, by Type
- 8.2.6.1.2. Market size and forecast, by Capacity
- 8.2.6.1.3. Market size and forecast, by Application
- 8.2.6.1.4. Market size and forecast, by End-Use Industry
- 8.2.6.2. Canada
- 8.2.6.2.1. Market size and forecast, by Type
- 8.2.6.2.2. Market size and forecast, by Capacity
- 8.2.6.2.3. Market size and forecast, by Application
- 8.2.6.2.4. Market size and forecast, by End-Use Industry
- 8.2.6.3. Mexico
- 8.2.6.3.1. Market size and forecast, by Type
- 8.2.6.3.2. Market size and forecast, by Capacity
- 8.2.6.3.3. Market size and forecast, by Application
- 8.2.6.3.4. Market size and forecast, by End-Use Industry
- 8.3. Europe
- 8.3.1. Key market trends, growth factors and opportunities
- 8.3.2. Market size and forecast, by Type
- 8.3.3. Market size and forecast, by Capacity
- 8.3.4. Market size and forecast, by Application
- 8.3.5. Market size and forecast, by End-Use Industry
- 8.3.6. Market size and forecast, by country
- 8.3.6.1. Germany
- 8.3.6.1.1. Market size and forecast, by Type
- 8.3.6.1.2. Market size and forecast, by Capacity
- 8.3.6.1.3. Market size and forecast, by Application
- 8.3.6.1.4. Market size and forecast, by End-Use Industry
- 8.3.6.2. France
- 8.3.6.2.1. Market size and forecast, by Type
- 8.3.6.2.2. Market size and forecast, by Capacity
- 8.3.6.2.3. Market size and forecast, by Application
- 8.3.6.2.4. Market size and forecast, by End-Use Industry
- 8.3.6.3. UK
- 8.3.6.3.1. Market size and forecast, by Type
- 8.3.6.3.2. Market size and forecast, by Capacity
- 8.3.6.3.3. Market size and forecast, by Application
- 8.3.6.3.4. Market size and forecast, by End-Use Industry
- 8.3.6.4. Spain
- 8.3.6.4.1. Market size and forecast, by Type
- 8.3.6.4.2. Market size and forecast, by Capacity
- 8.3.6.4.3. Market size and forecast, by Application
- 8.3.6.4.4. Market size and forecast, by End-Use Industry
- 8.3.6.5. Italy
- 8.3.6.5.1. Market size and forecast, by Type
- 8.3.6.5.2. Market size and forecast, by Capacity
- 8.3.6.5.3. Market size and forecast, by Application
- 8.3.6.5.4. Market size and forecast, by End-Use Industry
- 8.3.6.6. Rest of Europe
- 8.3.6.6.1. Market size and forecast, by Type
- 8.3.6.6.2. Market size and forecast, by Capacity
- 8.3.6.6.3. Market size and forecast, by Application
- 8.3.6.6.4. Market size and forecast, by End-Use Industry
- 8.4. Asia-Pacific
- 8.4.1. Key market trends, growth factors and opportunities
- 8.4.2. Market size and forecast, by Type
- 8.4.3. Market size and forecast, by Capacity
- 8.4.4. Market size and forecast, by Application
- 8.4.5. Market size and forecast, by End-Use Industry
- 8.4.6. Market size and forecast, by country
- 8.4.6.1. China
- 8.4.6.1.1. Market size and forecast, by Type
- 8.4.6.1.2. Market size and forecast, by Capacity
- 8.4.6.1.3. Market size and forecast, by Application
- 8.4.6.1.4. Market size and forecast, by End-Use Industry
- 8.4.6.2. India
- 8.4.6.2.1. Market size and forecast, by Type
- 8.4.6.2.2. Market size and forecast, by Capacity
- 8.4.6.2.3. Market size and forecast, by Application
- 8.4.6.2.4. Market size and forecast, by End-Use Industry
- 8.4.6.3. Japan
- 8.4.6.3.1. Market size and forecast, by Type
- 8.4.6.3.2. Market size and forecast, by Capacity
- 8.4.6.3.3. Market size and forecast, by Application
- 8.4.6.3.4. Market size and forecast, by End-Use Industry
- 8.4.6.4. South Korea
- 8.4.6.4.1. Market size and forecast, by Type
- 8.4.6.4.2. Market size and forecast, by Capacity
- 8.4.6.4.3. Market size and forecast, by Application
- 8.4.6.4.4. Market size and forecast, by End-Use Industry
- 8.4.6.5. Australia
- 8.4.6.5.1. Market size and forecast, by Type
- 8.4.6.5.2. Market size and forecast, by Capacity
- 8.4.6.5.3. Market size and forecast, by Application
- 8.4.6.5.4. Market size and forecast, by End-Use Industry
- 8.4.6.6. Rest of Asia-Pacific
- 8.4.6.6.1. Market size and forecast, by Type
- 8.4.6.6.2. Market size and forecast, by Capacity
- 8.4.6.6.3. Market size and forecast, by Application
- 8.4.6.6.4. Market size and forecast, by End-Use Industry
- 8.5. LAMEA
- 8.5.1. Key market trends, growth factors and opportunities
- 8.5.2. Market size and forecast, by Type
- 8.5.3. Market size and forecast, by Capacity
- 8.5.4. Market size and forecast, by Application
- 8.5.5. Market size and forecast, by End-Use Industry
- 8.5.6. Market size and forecast, by country
- 8.5.6.1. Brazil
- 8.5.6.1.1. Market size and forecast, by Type
- 8.5.6.1.2. Market size and forecast, by Capacity
- 8.5.6.1.3. Market size and forecast, by Application
- 8.5.6.1.4. Market size and forecast, by End-Use Industry
- 8.5.6.2. South Africa
- 8.5.6.2.1. Market size and forecast, by Type
- 8.5.6.2.2. Market size and forecast, by Capacity
- 8.5.6.2.3. Market size and forecast, by Application
- 8.5.6.2.4. Market size and forecast, by End-Use Industry
- 8.5.6.3. Saudi Arabia
- 8.5.6.3.1. Market size and forecast, by Type
- 8.5.6.3.2. Market size and forecast, by Capacity
- 8.5.6.3.3. Market size and forecast, by Application
- 8.5.6.3.4. Market size and forecast, by End-Use Industry
- 8.5.6.4. Rest of LAMEA
- 8.5.6.4.1. Market size and forecast, by Type
- 8.5.6.4.2. Market size and forecast, by Capacity
- 8.5.6.4.3. Market size and forecast, by Application
- 8.5.6.4.4. Market size and forecast, by End-Use Industry
CHAPTER 9: COMPETITIVE LANDSCAPE
- 9.1. Introduction
- 9.2. Top winning strategies
- 9.3. Product mapping of top 10 player
- 9.4. Competitive dashboard
- 9.5. Competitive heatmap
- 9.6. Top player positioning, 2022
CHAPTER 10: COMPANY PROFILES
- 10.1. EBARA CORPORATION
- 10.1.1. Company overview
- 10.1.2. Key executives
- 10.1.3. Company snapshot
- 10.1.4. Operating business segments
- 10.1.5. Product portfolio
- 10.1.6. Business performance
- 10.2. Franklin Electric
- 10.2.1. Company overview
- 10.2.2. Key executives
- 10.2.3. Company snapshot
- 10.2.4. Operating business segments
- 10.2.5. Product portfolio
- 10.2.6. Business performance
- 10.3. Grundfos Pumps India Private Ltd.
- 10.3.1. Company overview
- 10.3.2. Key executives
- 10.3.3. Company snapshot
- 10.3.4. Operating business segments
- 10.3.5. Product portfolio
- 10.4. Kirloskar Brothers Limited.
- 10.4.1. Company overview
- 10.4.2. Key executives
- 10.4.3. Company snapshot
- 10.4.4. Operating business segments
- 10.4.5. Product portfolio
- 10.4.6. Business performance
- 10.5. KSB Limited
- 10.5.1. Company overview
- 10.5.2. Key executives
- 10.5.3. Company snapshot
- 10.5.4. Operating business segments
- 10.5.5. Product portfolio
- 10.5.6. Business performance
- 10.5.7. Key strategic moves and developments
- 10.6. Pentair
- 10.6.1. Company overview
- 10.6.2. Key executives
- 10.6.3. Company snapshot
- 10.6.4. Operating business segments
- 10.6.5. Product portfolio
- 10.6.6. Business performance
- 10.7. Sulzer Ltd.
- 10.7.1. Company overview
- 10.7.2. Key executives
- 10.7.3. Company snapshot
- 10.7.4. Operating business segments
- 10.7.5. Product portfolio
- 10.7.6. Business performance
- 10.8. TSURUMI MANUFACTURING CO., LTD.
- 10.8.1. Company overview
- 10.8.2. Key executives
- 10.8.3. Company snapshot
- 10.8.4. Operating business segments
- 10.8.5. Product portfolio
- 10.8.6. Business performance
- 10.9. WILO SE
- 10.9.1. Company overview
- 10.9.2. Key executives
- 10.9.3. Company snapshot
- 10.9.4. Operating business segments
- 10.9.5. Product portfolio
- 10.9.6. Business performance
- 10.10. Xylem Inc.
- 10.10.1. Company overview
- 10.10.2. Key executives
- 10.10.3. Company snapshot
- 10.10.4. Operating business segments
- 10.10.5. Product portfolio
- 10.10.6. Business performance