
|
市場調査レポート
商品コード
1365837
バイオ医薬品用プラスチック市場:ポリマー別、用途別:世界の機会分析と産業予測、2023~2032年Biopharma Plastics Market By Polymer, By Application : Global Opportunity Analysis and Industry Forecast, 2023-2032 |
||||||
|
|||||||

| バイオ医薬品用プラスチック市場:ポリマー別、用途別:世界の機会分析と産業予測、2023~2032年 |
|
出版日: 2023年08月01日
発行: Allied Market Research
ページ情報: 英文 349 Pages
納期: 2~3営業日
|

- 全表示
- 概要
- 図表
- 目次
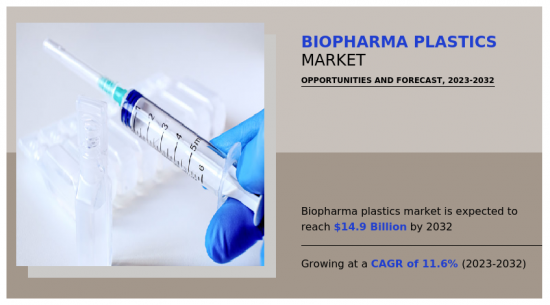
バイオ医薬品用プラスチック市場の2022年の市場規模は50億米ドルで、2023年から2032年までのCAGRは11.6%で、2032年には149億米ドルに達すると推定されています。
生物製剤は生物に由来する治療用製品であり、がん、自己免疫疾患、感染症など様々な複雑な疾患の治療に重要な役割を果たしています。生物製剤の需要が急増するにつれ、バイオ医薬品用プラスチックを使った特殊な包装、保管、送達システムのニーズも高まっています。遺伝的体質や特定の健康状態に基づいて個々の患者に合わせる個別化医薬品は、治療効果を高め副作用を減らす有望なアプローチとして勢いを増しています。プラスチックは、注射ペン、吸入器、埋め込み型デバイスなど、カスタマイズされたドラッグデリバリーデバイスの製造に不可欠であり、正確な投与と患者のコンプライアンスを保証します。
生体適合性、耐薬品性、敏感な生物学的製剤の安定性を維持する能力など、バイオ医薬品用プラスチックのユニークな特性は、バイオ医薬品産業での使用に理想的な材料となっています。さらに、プラスチック製造技術の進歩により、革新的で特殊なプラスチック材料が開発され、高度なドラッグデリバリーシステムの製造におけるバイオ医薬品用プラスチックの需要をさらに押し上げています。医療部門が精密医療と新規生物製剤の開発に注力し続ける中、バイオ医薬品用プラスチック市場は大きな成長が見込まれています。
バイオ医薬品用プラスチックのコストが高いことが、バイオ医薬品用プラスチック市場の成長と拡大の妨げになると予想されます。これらの特殊プラスチック材料は、バイオ医薬品業界の厳しい要件に対応する独自の特性と利点を提供する一方で、その製造には高度な技術と原材料が必要であり、製造コストの上昇につながります。製造工程で発生する多額の費用は、最終的に製薬会社、研究所、医療機関などのエンドユーザーに転嫁されるため、バイオ医薬品用プラスチックは医療機器や医薬品包装用の高価な選択肢となっています。中小企業や新興の製薬企業にとって、バイオ医薬品用プラスチックを採用するのは資金的に負担が大きいため、コスト面での課題があります。その結果、これらの企業はより経済的な代替品を選ぶ可能性があり、バイオ医薬品用プラスチックの市場需要を制限する可能性があります。さらに、特に新興国市場では、医療分野における厳しい予算制約が、高コストのバイオ医薬品用プラスチックの普及を阻み、市場の成長を阻害する可能性があります。
バイオ医薬品用プラスチック技術の進歩は、バイオ医薬品用プラスチック市場に非常に有利な機会をもたらすと考えられます。バイオ医薬品産業が進歩・進化を続ける中、ドラッグの開発・製造・デリバリーに特有のニーズや課題に対応できる革新的な素材への需要が高まっています。バイオ医薬品用プラスチック技術は、このような要求に対応する最前線にあり、最先端のソリューションを幅広く提供しています。進歩の主な分野の一つは、生体適合性の向上、溶出性・抽出性の低減、化学的相互作用に対する耐性の向上などの特性を強化した新規バイオ材料の開発です。これらの進歩により、医薬品用途に使用されるプラスチック材料が医薬品の安全性と有効性を損なわないことが保証され、医薬品パッケージング、容器、医療機器などの重要な用途に理想的なものとなっています。
さらに、ナノ技術とナノ材料の進歩により、ドラッグデリバリーシステムを改善できる特殊なプラスチック粒子やコーティングの創出が可能になり、薬剤の標的化・制御放出が可能になっています。これにより、個別化医療に新たな道が開かれ、患者の転帰が向上します。さらに、バイオ医薬品用プラスチックへのスマート技術の統合も勢いを増しています。これらの技術には、センサー、インジケーター、追跡メカニズムなどがあり、保管や輸送中の医薬品の状態や完全性を監視し、製品の品質と患者の安全性を確保することができます。
目次
第1章 イントロダクション
第2章 エグゼクティブサマリー
第3章 市場概要
- 市場の定義と範囲
- 主な調査結果
- 影響要因
- 主な投資機会
- ポーターのファイブフォース分析
- 市場力学
- 促進要因
- 持続可能な包装に対する需要の高まり
- 生物製剤と個別化医薬品の採用増加
- 抑制要因
- バイオ医薬品用プラスチックのコスト高
- 機会
- バイオ医薬品用プラスチック技術の進歩
- 促進要因
- COVID-19市場への影響分析
- 市場シェア分析
- バリューチェーン分析
- 規制ガイドライン
- 特許情勢
- 価格分析
第4章 バイオ医薬品用プラスチック市場:ポリマー別
- 概要
- ポリエチレン
- ポリプロピレン
- アクリロニトリル・ブタジエン・スチレン
- ポリエチレンテレフタレート
- ポリ塩化ビニル
- ポリテトラフルオロエチレン
- その他
第5章 バイオ医薬品用プラスチック市場:用途別
- 概要
- 保護ウェア
- 容器
- バイオリアクターバッグ
- 注射器
- デプスフィルター
- 使い捨て医療用コネクター
- その他
第6章 バイオ医薬品用プラスチック市場:地域別
- 概要
- 北米
- 米国
- カナダ
- メキシコ
- 欧州
- ドイツ
- 英国
- フランス
- スペイン
- イタリア
- その他
- アジア太平洋
- 中国
- インド
- 日本
- 韓国
- オーストラリア
- その他
- ラテンアメリカ・中東・アフリカ
- ブラジル
- サウジアラビア
- 南アフリカ
- その他
第7章 競合情勢
- イントロダクション
- 主要成功戦略
- 主要10社の製品マッピング
- 競合ダッシュボード
- 競合ヒートマップ
- 主要企業のポジショニング、2022年
第8章 企業プロファイル
- BASF SE
- SABIC
- Dow Inc.
- Covestro AG.
- Formosa Plastics Corporation
- Solvay
- TORAY INDUSTRIES, INC.
- LyondellBasell Industries Holdings B.V.
- Mitsui & Co.Plastics Ltd
- INEOS Group
LIST OF TABLES
- TABLE 01. GLOBAL BIOPHARMA PLASTICS MARKET, BY POLYMER, 2022-2032 ($MILLION)
- TABLE 02. GLOBAL BIOPHARMA PLASTICS MARKET, BY POLYMER, 2022-2032 (KILOTON)
- TABLE 03. BIOPHARMA PLASTICS MARKET FOR POLYETHYLENE, BY REGION, 2022-2032 ($MILLION)
- TABLE 04. BIOPHARMA PLASTICS MARKET FOR POLYETHYLENE, BY REGION, 2022-2032 (KILOTON)
- TABLE 05. BIOPHARMA PLASTICS MARKET FOR POLYPROPYLENE, BY REGION, 2022-2032 ($MILLION)
- TABLE 06. BIOPHARMA PLASTICS MARKET FOR POLYPROPYLENE, BY REGION, 2022-2032 (KILOTON)
- TABLE 07. BIOPHARMA PLASTICS MARKET FOR ACRYLONITRILE BUTADIENE STYRENE, BY REGION, 2022-2032 ($MILLION)
- TABLE 08. BIOPHARMA PLASTICS MARKET FOR ACRYLONITRILE BUTADIENE STYRENE, BY REGION, 2022-2032 (KILOTON)
- TABLE 09. BIOPHARMA PLASTICS MARKET FOR POLYETHYLENE TEREPHTHALATE, BY REGION, 2022-2032 ($MILLION)
- TABLE 10. BIOPHARMA PLASTICS MARKET FOR POLYETHYLENE TEREPHTHALATE, BY REGION, 2022-2032 (KILOTON)
- TABLE 11. BIOPHARMA PLASTICS MARKET FOR POLYVINYL CHLORIDE, BY REGION, 2022-2032 ($MILLION)
- TABLE 12. BIOPHARMA PLASTICS MARKET FOR POLYVINYL CHLORIDE, BY REGION, 2022-2032 (KILOTON)
- TABLE 13. BIOPHARMA PLASTICS MARKET FOR POLYTETRAFLUOROETHYLENE, BY REGION, 2022-2032 ($MILLION)
- TABLE 14. BIOPHARMA PLASTICS MARKET FOR POLYTETRAFLUOROETHYLENE, BY REGION, 2022-2032 (KILOTON)
- TABLE 15. BIOPHARMA PLASTICS MARKET FOR OTHERS, BY REGION, 2022-2032 ($MILLION)
- TABLE 16. BIOPHARMA PLASTICS MARKET FOR OTHERS, BY REGION, 2022-2032 (KILOTON)
- TABLE 17. GLOBAL BIOPHARMA PLASTICS MARKET, BY APPLICATION, 2022-2032 ($MILLION)
- TABLE 18. GLOBAL BIOPHARMA PLASTICS MARKET, BY APPLICATION, 2022-2032 (KILOTON)
- TABLE 19. BIOPHARMA PLASTICS MARKET FOR PROTECTIVE WEAR, BY REGION, 2022-2032 ($MILLION)
- TABLE 20. BIOPHARMA PLASTICS MARKET FOR PROTECTIVE WEAR, BY REGION, 2022-2032 (KILOTON)
- TABLE 21. BIOPHARMA PLASTICS MARKET FOR CONTAINERS, BY REGION, 2022-2032 ($MILLION)
- TABLE 22. BIOPHARMA PLASTICS MARKET FOR CONTAINERS, BY REGION, 2022-2032 (KILOTON)
- TABLE 23. BIOPHARMA PLASTICS MARKET FOR BIOREACTOR BAGS, BY REGION, 2022-2032 ($MILLION)
- TABLE 24. BIOPHARMA PLASTICS MARKET FOR BIOREACTOR BAGS, BY REGION, 2022-2032 (KILOTON)
- TABLE 25. BIOPHARMA PLASTICS MARKET FOR SYRINGES, BY REGION, 2022-2032 ($MILLION)
- TABLE 26. BIOPHARMA PLASTICS MARKET FOR SYRINGES, BY REGION, 2022-2032 (KILOTON)
- TABLE 27. BIOPHARMA PLASTICS MARKET FOR DEPTH FILTERS, BY REGION, 2022-2032 ($MILLION)
- TABLE 28. BIOPHARMA PLASTICS MARKET FOR DEPTH FILTERS, BY REGION, 2022-2032 (KILOTON)
- TABLE 29. BIOPHARMA PLASTICS MARKET FOR DISPOSABLE MEDICAL CONNECTORS, BY REGION, 2022-2032 ($MILLION)
- TABLE 30. BIOPHARMA PLASTICS MARKET FOR DISPOSABLE MEDICAL CONNECTORS, BY REGION, 2022-2032 (KILOTON)
- TABLE 31. BIOPHARMA PLASTICS MARKET FOR OTHERS, BY REGION, 2022-2032 ($MILLION)
- TABLE 32. BIOPHARMA PLASTICS MARKET FOR OTHERS, BY REGION, 2022-2032 (KILOTON)
- TABLE 33. BIOPHARMA PLASTICS MARKET, BY REGION, 2022-2032 ($MILLION)
- TABLE 34. BIOPHARMA PLASTICS MARKET, BY REGION, 2022-2032 (KILOTON)
- TABLE 35. NORTH AMERICA BIOPHARMA PLASTICS MARKET, BY POLYMER, 2022-2032 ($MILLION)
- TABLE 36. NORTH AMERICA BIOPHARMA PLASTICS MARKET, BY POLYMER, 2022-2032 (KILOTON)
- TABLE 37. NORTH AMERICA BIOPHARMA PLASTICS MARKET, BY APPLICATION, 2022-2032 ($MILLION)
- TABLE 38. NORTH AMERICA BIOPHARMA PLASTICS MARKET, BY APPLICATION, 2022-2032 (KILOTON)
- TABLE 39. NORTH AMERICA BIOPHARMA PLASTICS MARKET, BY COUNTRY, 2022-2032 ($MILLION)
- TABLE 40. NORTH AMERICA BIOPHARMA PLASTICS MARKET, BY COUNTRY, 2022-2032 (KILOTON)
- TABLE 41. U.S. BIOPHARMA PLASTICS MARKET, BY POLYMER, 2022-2032 ($MILLION)
- TABLE 42. U.S. BIOPHARMA PLASTICS MARKET, BY POLYMER, 2022-2032 (KILOTON)
- TABLE 43. U.S. BIOPHARMA PLASTICS MARKET, BY APPLICATION, 2022-2032 ($MILLION)
- TABLE 44. U.S. BIOPHARMA PLASTICS MARKET, BY APPLICATION, 2022-2032 (KILOTON)
- TABLE 45. CANADA BIOPHARMA PLASTICS MARKET, BY POLYMER, 2022-2032 ($MILLION)
- TABLE 46. CANADA BIOPHARMA PLASTICS MARKET, BY POLYMER, 2022-2032 (KILOTON)
- TABLE 47. CANADA BIOPHARMA PLASTICS MARKET, BY APPLICATION, 2022-2032 ($MILLION)
- TABLE 48. CANADA BIOPHARMA PLASTICS MARKET, BY APPLICATION, 2022-2032 (KILOTON)
- TABLE 49. MEXICO BIOPHARMA PLASTICS MARKET, BY POLYMER, 2022-2032 ($MILLION)
- TABLE 50. MEXICO BIOPHARMA PLASTICS MARKET, BY POLYMER, 2022-2032 (KILOTON)
- TABLE 51. MEXICO BIOPHARMA PLASTICS MARKET, BY APPLICATION, 2022-2032 ($MILLION)
- TABLE 52. MEXICO BIOPHARMA PLASTICS MARKET, BY APPLICATION, 2022-2032 (KILOTON)
- TABLE 53. EUROPE BIOPHARMA PLASTICS MARKET, BY POLYMER, 2022-2032 ($MILLION)
- TABLE 54. EUROPE BIOPHARMA PLASTICS MARKET, BY POLYMER, 2022-2032 (KILOTON)
- TABLE 55. EUROPE BIOPHARMA PLASTICS MARKET, BY APPLICATION, 2022-2032 ($MILLION)
- TABLE 56. EUROPE BIOPHARMA PLASTICS MARKET, BY APPLICATION, 2022-2032 (KILOTON)
- TABLE 57. EUROPE BIOPHARMA PLASTICS MARKET, BY COUNTRY, 2022-2032 ($MILLION)
- TABLE 58. EUROPE BIOPHARMA PLASTICS MARKET, BY COUNTRY, 2022-2032 (KILOTON)
- TABLE 59. GERMANY BIOPHARMA PLASTICS MARKET, BY POLYMER, 2022-2032 ($MILLION)
- TABLE 60. GERMANY BIOPHARMA PLASTICS MARKET, BY POLYMER, 2022-2032 (KILOTON)
- TABLE 61. GERMANY BIOPHARMA PLASTICS MARKET, BY APPLICATION, 2022-2032 ($MILLION)
- TABLE 62. GERMANY BIOPHARMA PLASTICS MARKET, BY APPLICATION, 2022-2032 (KILOTON)
- TABLE 63. UK BIOPHARMA PLASTICS MARKET, BY POLYMER, 2022-2032 ($MILLION)
- TABLE 64. UK BIOPHARMA PLASTICS MARKET, BY POLYMER, 2022-2032 (KILOTON)
- TABLE 65. UK BIOPHARMA PLASTICS MARKET, BY APPLICATION, 2022-2032 ($MILLION)
- TABLE 66. UK BIOPHARMA PLASTICS MARKET, BY APPLICATION, 2022-2032 (KILOTON)
- TABLE 67. FRANCE BIOPHARMA PLASTICS MARKET, BY POLYMER, 2022-2032 ($MILLION)
- TABLE 68. FRANCE BIOPHARMA PLASTICS MARKET, BY POLYMER, 2022-2032 (KILOTON)
- TABLE 69. FRANCE BIOPHARMA PLASTICS MARKET, BY APPLICATION, 2022-2032 ($MILLION)
- TABLE 70. FRANCE BIOPHARMA PLASTICS MARKET, BY APPLICATION, 2022-2032 (KILOTON)
- TABLE 71. SPAIN BIOPHARMA PLASTICS MARKET, BY POLYMER, 2022-2032 ($MILLION)
- TABLE 72. SPAIN BIOPHARMA PLASTICS MARKET, BY POLYMER, 2022-2032 (KILOTON)
- TABLE 73. SPAIN BIOPHARMA PLASTICS MARKET, BY APPLICATION, 2022-2032 ($MILLION)
- TABLE 74. SPAIN BIOPHARMA PLASTICS MARKET, BY APPLICATION, 2022-2032 (KILOTON)
- TABLE 75. ITALY BIOPHARMA PLASTICS MARKET, BY POLYMER, 2022-2032 ($MILLION)
- TABLE 76. ITALY BIOPHARMA PLASTICS MARKET, BY POLYMER, 2022-2032 (KILOTON)
- TABLE 77. ITALY BIOPHARMA PLASTICS MARKET, BY APPLICATION, 2022-2032 ($MILLION)
- TABLE 78. ITALY BIOPHARMA PLASTICS MARKET, BY APPLICATION, 2022-2032 (KILOTON)
- TABLE 79. REST OF EUROPE BIOPHARMA PLASTICS MARKET, BY POLYMER, 2022-2032 ($MILLION)
- TABLE 80. REST OF EUROPE BIOPHARMA PLASTICS MARKET, BY POLYMER, 2022-2032 (KILOTON)
- TABLE 81. REST OF EUROPE BIOPHARMA PLASTICS MARKET, BY APPLICATION, 2022-2032 ($MILLION)
- TABLE 82. REST OF EUROPE BIOPHARMA PLASTICS MARKET, BY APPLICATION, 2022-2032 (KILOTON)
- TABLE 83. ASIA-PACIFIC BIOPHARMA PLASTICS MARKET, BY POLYMER, 2022-2032 ($MILLION)
- TABLE 84. ASIA-PACIFIC BIOPHARMA PLASTICS MARKET, BY POLYMER, 2022-2032 (KILOTON)
- TABLE 85. ASIA-PACIFIC BIOPHARMA PLASTICS MARKET, BY APPLICATION, 2022-2032 ($MILLION)
- TABLE 86. ASIA-PACIFIC BIOPHARMA PLASTICS MARKET, BY APPLICATION, 2022-2032 (KILOTON)
- TABLE 87. ASIA-PACIFIC BIOPHARMA PLASTICS MARKET, BY COUNTRY, 2022-2032 ($MILLION)
- TABLE 88. ASIA-PACIFIC BIOPHARMA PLASTICS MARKET, BY COUNTRY, 2022-2032 (KILOTON)
- TABLE 89. CHINA BIOPHARMA PLASTICS MARKET, BY POLYMER, 2022-2032 ($MILLION)
- TABLE 90. CHINA BIOPHARMA PLASTICS MARKET, BY POLYMER, 2022-2032 (KILOTON)
- TABLE 91. CHINA BIOPHARMA PLASTICS MARKET, BY APPLICATION, 2022-2032 ($MILLION)
- TABLE 92. CHINA BIOPHARMA PLASTICS MARKET, BY APPLICATION, 2022-2032 (KILOTON)
- TABLE 93. INDIA BIOPHARMA PLASTICS MARKET, BY POLYMER, 2022-2032 ($MILLION)
- TABLE 94. INDIA BIOPHARMA PLASTICS MARKET, BY POLYMER, 2022-2032 (KILOTON)
- TABLE 95. INDIA BIOPHARMA PLASTICS MARKET, BY APPLICATION, 2022-2032 ($MILLION)
- TABLE 96. INDIA BIOPHARMA PLASTICS MARKET, BY APPLICATION, 2022-2032 (KILOTON)
- TABLE 97. JAPAN BIOPHARMA PLASTICS MARKET, BY POLYMER, 2022-2032 ($MILLION)
- TABLE 98. JAPAN BIOPHARMA PLASTICS MARKET, BY POLYMER, 2022-2032 (KILOTON)
- TABLE 99. JAPAN BIOPHARMA PLASTICS MARKET, BY APPLICATION, 2022-2032 ($MILLION)
- TABLE 100. JAPAN BIOPHARMA PLASTICS MARKET, BY APPLICATION, 2022-2032 (KILOTON)
- TABLE 101. SOUTH KOREA BIOPHARMA PLASTICS MARKET, BY POLYMER, 2022-2032 ($MILLION)
- TABLE 102. SOUTH KOREA BIOPHARMA PLASTICS MARKET, BY POLYMER, 2022-2032 (KILOTON)
- TABLE 103. SOUTH KOREA BIOPHARMA PLASTICS MARKET, BY APPLICATION, 2022-2032 ($MILLION)
- TABLE 104. SOUTH KOREA BIOPHARMA PLASTICS MARKET, BY APPLICATION, 2022-2032 (KILOTON)
- TABLE 105. AUSTRALIA BIOPHARMA PLASTICS MARKET, BY POLYMER, 2022-2032 ($MILLION)
- TABLE 106. AUSTRALIA BIOPHARMA PLASTICS MARKET, BY POLYMER, 2022-2032 (KILOTON)
- TABLE 107. AUSTRALIA BIOPHARMA PLASTICS MARKET, BY APPLICATION, 2022-2032 ($MILLION)
- TABLE 108. AUSTRALIA BIOPHARMA PLASTICS MARKET, BY APPLICATION, 2022-2032 (KILOTON)
- TABLE 109. REST OF ASIA-PACIFIC BIOPHARMA PLASTICS MARKET, BY POLYMER, 2022-2032 ($MILLION)
- TABLE 110. REST OF ASIA-PACIFIC BIOPHARMA PLASTICS MARKET, BY POLYMER, 2022-2032 (KILOTON)
- TABLE 111. REST OF ASIA-PACIFIC BIOPHARMA PLASTICS MARKET, BY APPLICATION, 2022-2032 ($MILLION)
- TABLE 112. REST OF ASIA-PACIFIC BIOPHARMA PLASTICS MARKET, BY APPLICATION, 2022-2032 (KILOTON)
- TABLE 113. LAMEA BIOPHARMA PLASTICS MARKET, BY POLYMER, 2022-2032 ($MILLION)
- TABLE 114. LAMEA BIOPHARMA PLASTICS MARKET, BY POLYMER, 2022-2032 (KILOTON)
- TABLE 115. LAMEA BIOPHARMA PLASTICS MARKET, BY APPLICATION, 2022-2032 ($MILLION)
- TABLE 116. LAMEA BIOPHARMA PLASTICS MARKET, BY APPLICATION, 2022-2032 (KILOTON)
- TABLE 117. LAMEA BIOPHARMA PLASTICS MARKET, BY COUNTRY, 2022-2032 ($MILLION)
- TABLE 118. LAMEA BIOPHARMA PLASTICS MARKET, BY COUNTRY, 2022-2032 (KILOTON)
- TABLE 119. BRAZIL BIOPHARMA PLASTICS MARKET, BY POLYMER, 2022-2032 ($MILLION)
- TABLE 120. BRAZIL BIOPHARMA PLASTICS MARKET, BY POLYMER, 2022-2032 (KILOTON)
- TABLE 121. BRAZIL BIOPHARMA PLASTICS MARKET, BY APPLICATION, 2022-2032 ($MILLION)
- TABLE 122. BRAZIL BIOPHARMA PLASTICS MARKET, BY APPLICATION, 2022-2032 (KILOTON)
- TABLE 123. SAUDI ARABIA BIOPHARMA PLASTICS MARKET, BY POLYMER, 2022-2032 ($MILLION)
- TABLE 124. SAUDI ARABIA BIOPHARMA PLASTICS MARKET, BY POLYMER, 2022-2032 (KILOTON)
- TABLE 125. SAUDI ARABIA BIOPHARMA PLASTICS MARKET, BY APPLICATION, 2022-2032 ($MILLION)
- TABLE 126. SAUDI ARABIA BIOPHARMA PLASTICS MARKET, BY APPLICATION, 2022-2032 (KILOTON)
- TABLE 127. SOUTH AFRICA BIOPHARMA PLASTICS MARKET, BY POLYMER, 2022-2032 ($MILLION)
- TABLE 128. SOUTH AFRICA BIOPHARMA PLASTICS MARKET, BY POLYMER, 2022-2032 (KILOTON)
- TABLE 129. SOUTH AFRICA BIOPHARMA PLASTICS MARKET, BY APPLICATION, 2022-2032 ($MILLION)
- TABLE 130. SOUTH AFRICA BIOPHARMA PLASTICS MARKET, BY APPLICATION, 2022-2032 (KILOTON)
- TABLE 131. REST OF LAMEA BIOPHARMA PLASTICS MARKET, BY POLYMER, 2022-2032 ($MILLION)
- TABLE 132. REST OF LAMEA BIOPHARMA PLASTICS MARKET, BY POLYMER, 2022-2032 (KILOTON)
- TABLE 133. REST OF LAMEA BIOPHARMA PLASTICS MARKET, BY APPLICATION, 2022-2032 ($MILLION)
- TABLE 134. REST OF LAMEA BIOPHARMA PLASTICS MARKET, BY APPLICATION, 2022-2032 (KILOTON)
- TABLE 135. BASF SE: KEY EXECUTIVES
- TABLE 136. BASF SE: COMPANY SNAPSHOT
- TABLE 137. BASF SE: PRODUCT SEGMENTS
- TABLE 138. BASF SE: PRODUCT PORTFOLIO
- TABLE 139. SABIC: KEY EXECUTIVES
- TABLE 140. SABIC: COMPANY SNAPSHOT
- TABLE 141. SABIC: PRODUCT SEGMENTS
- TABLE 142. SABIC: PRODUCT PORTFOLIO
- TABLE 143. DOW INC.: KEY EXECUTIVES
- TABLE 144. DOW INC.: COMPANY SNAPSHOT
- TABLE 145. DOW INC.: PRODUCT SEGMENTS
- TABLE 146. DOW INC.: PRODUCT PORTFOLIO
- TABLE 147. COVESTRO AG.: KEY EXECUTIVES
- TABLE 148. COVESTRO AG.: COMPANY SNAPSHOT
- TABLE 149. COVESTRO AG.: PRODUCT SEGMENTS
- TABLE 150. COVESTRO AG.: PRODUCT PORTFOLIO
- TABLE 151. FORMOSA PLASTICS CORPORATION: KEY EXECUTIVES
- TABLE 152. FORMOSA PLASTICS CORPORATION: COMPANY SNAPSHOT
- TABLE 153. FORMOSA PLASTICS CORPORATION: PRODUCT SEGMENTS
- TABLE 154. FORMOSA PLASTICS CORPORATION: PRODUCT PORTFOLIO
- TABLE 155. SOLVAY: KEY EXECUTIVES
- TABLE 156. SOLVAY: COMPANY SNAPSHOT
- TABLE 157. SOLVAY: PRODUCT SEGMENTS
- TABLE 158. SOLVAY: PRODUCT PORTFOLIO
- TABLE 159. TORAY INDUSTRIES, INC.: KEY EXECUTIVES
- TABLE 160. TORAY INDUSTRIES, INC.: COMPANY SNAPSHOT
- TABLE 161. TORAY INDUSTRIES, INC.: PRODUCT SEGMENTS
- TABLE 162. TORAY INDUSTRIES, INC.: PRODUCT PORTFOLIO
- TABLE 163. LYONDELLBASELL INDUSTRIES HOLDINGS B.V.: KEY EXECUTIVES
- TABLE 164. LYONDELLBASELL INDUSTRIES HOLDINGS B.V.: COMPANY SNAPSHOT
- TABLE 165. LYONDELLBASELL INDUSTRIES HOLDINGS B.V.: PRODUCT SEGMENTS
- TABLE 166. LYONDELLBASELL INDUSTRIES HOLDINGS B.V.: PRODUCT PORTFOLIO
- TABLE 167. MITSUI & CO.PLASTICS LTD: KEY EXECUTIVES
- TABLE 168. MITSUI & CO.PLASTICS LTD: COMPANY SNAPSHOT
- TABLE 169. MITSUI & CO.PLASTICS LTD: PRODUCT SEGMENTS
- TABLE 170. MITSUI & CO.PLASTICS LTD: PRODUCT PORTFOLIO
- TABLE 171. INEOS GROUP: KEY EXECUTIVES
- TABLE 172. INEOS GROUP: COMPANY SNAPSHOT
- TABLE 173. INEOS GROUP: PRODUCT SEGMENTS
- TABLE 174. INEOS GROUP: PRODUCT PORTFOLIO
LIST OF FIGURES
- FIGURE 01. BIOPHARMA PLASTICS MARKET, 2022-2032
- FIGURE 02. SEGMENTATION OF BIOPHARMA PLASTICS MARKET,2022-2032
- FIGURE 03. TOP INVESTMENT POCKETS IN BIOPHARMA PLASTICS MARKET (2023-2032)
- FIGURE 04. MODEARTE BARGAINING POWER OF SUPPLIERS
- FIGURE 05. MODERATE THREAT OF NEW ENTRANTS
- FIGURE 06. HIGH THREAT OF SUBSTITUTES
- FIGURE 07. HIGH INTENSITY OF RIVALRY
- FIGURE 08. HIGH BARGAINING POWER OF BUYERS
- FIGURE 09. GLOBAL BIOPHARMA PLASTICS MARKET:DRIVERS, RESTRAINTS AND OPPORTUNITIES
- FIGURE 10. MARKET SHARE ANALYSIS OF BIOPHARMA PLASTICS MARKET BY KEY PLAYERS, 2022 (%)
- FIGURE 11. REGULATORY GUIDELINES: BIOPHARMA PLASTICS MARKET
- FIGURE 12. PATENT ANALYSIS BY COMPANY
- FIGURE 13. PATENT ANALYSIS BY COUNTRY
- FIGURE 14. PRICING ANALYSIS: BIOPHARMA PLASTICS MARKET 2022 AND 2032
- FIGURE 15. BIOPHARMA PLASTICS MARKET, BY POLYMER, 2022(%)
- FIGURE 16. COMPARATIVE SHARE ANALYSIS OF BIOPHARMA PLASTICS MARKET FOR POLYETHYLENE, BY COUNTRY 2022 AND 2032(%)
- FIGURE 17. COMPARATIVE SHARE ANALYSIS OF BIOPHARMA PLASTICS MARKET FOR POLYPROPYLENE, BY COUNTRY 2022 AND 2032(%)
- FIGURE 18. COMPARATIVE SHARE ANALYSIS OF BIOPHARMA PLASTICS MARKET FOR ACRYLONITRILE BUTADIENE STYRENE, BY COUNTRY 2022 AND 2032(%)
- FIGURE 19. COMPARATIVE SHARE ANALYSIS OF BIOPHARMA PLASTICS MARKET FOR POLYETHYLENE TEREPHTHALATE, BY COUNTRY 2022 AND 2032(%)
- FIGURE 20. COMPARATIVE SHARE ANALYSIS OF BIOPHARMA PLASTICS MARKET FOR POLYVINYL CHLORIDE, BY COUNTRY 2022 AND 2032(%)
- FIGURE 21. COMPARATIVE SHARE ANALYSIS OF BIOPHARMA PLASTICS MARKET FOR POLYTETRAFLUOROETHYLENE, BY COUNTRY 2022 AND 2032(%)
- FIGURE 22. COMPARATIVE SHARE ANALYSIS OF BIOPHARMA PLASTICS MARKET FOR OTHERS, BY COUNTRY 2022 AND 2032(%)
- FIGURE 23. BIOPHARMA PLASTICS MARKET, BY APPLICATION, 2022(%)
- FIGURE 24. COMPARATIVE SHARE ANALYSIS OF BIOPHARMA PLASTICS MARKET FOR PROTECTIVE WEAR, BY COUNTRY 2022 AND 2032(%)
- FIGURE 25. COMPARATIVE SHARE ANALYSIS OF BIOPHARMA PLASTICS MARKET FOR CONTAINERS, BY COUNTRY 2022 AND 2032(%)
- FIGURE 26. COMPARATIVE SHARE ANALYSIS OF BIOPHARMA PLASTICS MARKET FOR BIOREACTOR BAGS, BY COUNTRY 2022 AND 2032(%)
- FIGURE 27. COMPARATIVE SHARE ANALYSIS OF BIOPHARMA PLASTICS MARKET FOR SYRINGES, BY COUNTRY 2022 AND 2032(%)
- FIGURE 28. COMPARATIVE SHARE ANALYSIS OF BIOPHARMA PLASTICS MARKET FOR DEPTH FILTERS, BY COUNTRY 2022 AND 2032(%)
- FIGURE 29. COMPARATIVE SHARE ANALYSIS OF BIOPHARMA PLASTICS MARKET FOR DISPOSABLE MEDICAL CONNECTORS, BY COUNTRY 2022 AND 2032(%)
- FIGURE 30. COMPARATIVE SHARE ANALYSIS OF BIOPHARMA PLASTICS MARKET FOR OTHERS, BY COUNTRY 2022 AND 2032(%)
- FIGURE 31. BIOPHARMA PLASTICS MARKET BY REGION, 2022(%)
- FIGURE 32. U.S. BIOPHARMA PLASTICS MARKET, 2022-2032 ($MILLION)
- FIGURE 33. CANADA BIOPHARMA PLASTICS MARKET, 2022-2032 ($MILLION)
- FIGURE 34. MEXICO BIOPHARMA PLASTICS MARKET, 2022-2032 ($MILLION)
- FIGURE 35. GERMANY BIOPHARMA PLASTICS MARKET, 2022-2032 ($MILLION)
- FIGURE 36. UK BIOPHARMA PLASTICS MARKET, 2022-2032 ($MILLION)
- FIGURE 37. FRANCE BIOPHARMA PLASTICS MARKET, 2022-2032 ($MILLION)
- FIGURE 38. SPAIN BIOPHARMA PLASTICS MARKET, 2022-2032 ($MILLION)
- FIGURE 39. ITALY BIOPHARMA PLASTICS MARKET, 2022-2032 ($MILLION)
- FIGURE 40. REST OF EUROPE BIOPHARMA PLASTICS MARKET, 2022-2032 ($MILLION)
- FIGURE 41. CHINA BIOPHARMA PLASTICS MARKET, 2022-2032 ($MILLION)
- FIGURE 42. INDIA BIOPHARMA PLASTICS MARKET, 2022-2032 ($MILLION)
- FIGURE 43. JAPAN BIOPHARMA PLASTICS MARKET, 2022-2032 ($MILLION)
- FIGURE 44. SOUTH KOREA BIOPHARMA PLASTICS MARKET, 2022-2032 ($MILLION)
- FIGURE 45. AUSTRALIA BIOPHARMA PLASTICS MARKET, 2022-2032 ($MILLION)
- FIGURE 46. REST OF ASIA-PACIFIC BIOPHARMA PLASTICS MARKET, 2022-2032 ($MILLION)
- FIGURE 47. BRAZIL BIOPHARMA PLASTICS MARKET, 2022-2032 ($MILLION)
- FIGURE 48. SAUDI ARABIA BIOPHARMA PLASTICS MARKET, 2022-2032 ($MILLION)
- FIGURE 49. SOUTH AFRICA BIOPHARMA PLASTICS MARKET, 2022-2032 ($MILLION)
- FIGURE 50. REST OF LAMEA BIOPHARMA PLASTICS MARKET, 2022-2032 ($MILLION)
- FIGURE 51. TOP WINNING STRATEGIES, BY YEAR
- FIGURE 52. TOP WINNING STRATEGIES, BY DEVELOPMENT
- FIGURE 53. TOP WINNING STRATEGIES, BY COMPANY
- FIGURE 54. PRODUCT MAPPING OF TOP 10 PLAYERS
- FIGURE 55. COMPETITIVE DASHBOARD
- FIGURE 56. COMPETITIVE HEATMAP: BIOPHARMA PLASTICS MARKET
- FIGURE 57. TOP PLAYER POSITIONING, 2022
- FIGURE 58. BASF SE: NET SALES, 2020-2022 ($MILLION)
- FIGURE 59. BASF SE: REVENUE SHARE BY SEGMENT, 2021 (%)
- FIGURE 60. BASF SE: REVENUE SHARE BY REGION, 2021 (%)
- FIGURE 61. SABIC: NET SALES, 2020-2022 ($MILLION)
- FIGURE 62. SABIC: REVENUE SHARE BY SEGMENT, 2022 (%)
- FIGURE 63. SABIC: REVENUE SHARE BY REGION, 2022 (%)
- FIGURE 64. DOW INC.: NET REVENUE, 2020-2022 ($MILLION)
- FIGURE 65. DOW INC.: REVENUE SHARE BY SEGMENT, 2022 (%)
- FIGURE 66. DOW INC.: REVENUE SHARE BY REGION, 2022 (%)
- FIGURE 67. COVESTRO AG.: NET SALES, 2020-2022 ($MILLION)
- FIGURE 68. COVESTRO AG.: REVENUE SHARE BY SEGMENT, 2022 (%)
- FIGURE 69. COVESTRO AG.: REVENUE SHARE BY REGION, 2022 (%)
- FIGURE 70. FORMOSA PLASTICS CORPORATION: NET SALES, 2020-2022 ($MILLION)
- FIGURE 71. SOLVAY: NET SALES, 2020-2022 ($MILLION)
- FIGURE 72. SOLVAY: RESEARCH & DEVELOPMENT EXPENDITURE, 2020-2022 ($MILLION)
- FIGURE 73. SOLVAY: REVENUE SHARE BY REGION, 2022 (%)
- FIGURE 74. SOLVAY: REVENUE SHARE BY REGION, 2022 (%)
- FIGURE 75. TORAY INDUSTRIES, INC.: NET SALES, 2020-2022 ($MILLION)
- FIGURE 76. TORAY INDUSTRIES, INC.: REVENUE SHARE BY SEGMENT, 2022 (%)
- FIGURE 77. LYONDELLBASELL INDUSTRIES HOLDINGS B.V.: NET REVENUE, 2020-2022 ($MILLION)
- FIGURE 78. LYONDELLBASELL INDUSTRIES HOLDINGS B.V.: RESEARCH & DEVELOPMENT EXPENDITURE, 2020-2022 ($MILLION)
- FIGURE 79. LYONDELLBASELL INDUSTRIES HOLDINGS B.V.: REVENUE SHARE BY SEGMENT, 2022 (%)
- FIGURE 80. MITSUI & CO.PLASTICS LTD: NET REVENUE, 2020-2022 ($MILLION)
- FIGURE 81. MITSUI & CO.PLASTICS LTD: REVENUE SHARE BY SEGMENT, 2022 (%)
- FIGURE 82. INEOS GROUP: NET REVENUE, 2020-2022 ($MILLION)
- FIGURE 83. INEOS GROUP: REVENUE SHARE BY SEGMENT, 2022 (%)
- FIGURE 84. INEOS GROUP: REVENUE SHARE BY REGION, 2022 (%)
According to a new report published by Allied Market Research, titled, "Biopharma Plastics Market," The biopharma plastics market was valued at $5.0 billion in 2022, and is estimated to reach $14.9 billion by 2032, growing at a CAGR of 11.6% from 2023 to 2032.
Biologics are therapeutic products derived from living organisms and play a crucial role in treating various complex diseases like cancer, autoimmune disorders, and infectious diseases. As the demand for biologics continues to surge, so does the need for specialized packaging, storage, and delivery systems made from biopharma plastics. Personalized medicines, tailored to individual patients based on their genetic makeup and specific health conditions, have gained momentum as a promising approach to enhance treatment efficacy and reduce adverse effects. Plastics are essential in manufacturing customized drug delivery devices, such as injectable pens, inhalers, and implantable devices, ensuring accurate dosing and patient compliance.
The unique properties of biopharma plastics, including biocompatibility, chemical resistance, and the ability to maintain the stability of sensitive biologic drugs, make them ideal materials for use in the biopharmaceutical industry. Additionally, advancements in plastic manufacturing technologies have led to the development of innovative and specialized plastic materials, further driving the demand for biopharma plastics in the production of advanced drug delivery systems. As the healthcare sector continues to focus on precision medicine and the development of novel biologics, the biopharma plastics market is expected to witness significant growth.
The high cost of biopharma plastics is expected to hinder the growth and expansion of the biopharma plastics market. While these specialized plastic materials offer unique properties and advantages that cater to the stringent requirements of the biopharmaceutical industry, their production involves sophisticated technologies and raw materials, leading to elevated manufacturing costs. The significant expenses incurred during the production process are ultimately passed on to the end-users, including pharmaceutical companies, research laboratories, and healthcare institutions, making biopharma plastics an expensive choice for medical devices and drug packaging. The cost factor poses challenges for small and medium-sized enterprises (SMEs) and emerging pharmaceutical companies, which may find it financially burdensome to adopt biopharma plastics in their operations. As a result, these organizations might opt for more economical alternatives, potentially limiting the market demand for biopharma plastics. Additionally, stringent budget constraints in the healthcare sector, especially in developing regions, may deter the widespread adoption of high-cost biopharma plastics, thereby impeding market growth.
Advancements in biopharma plastic technologies are set to present highly lucrative opportunities to the biopharma plastics market. As the biopharmaceutical industry continues to advance and evolve, there is an increasing demand for innovative materials that can meet the specific needs and challenges of drug development, manufacturing, and delivery. Biopharma plastic technologies have been at the forefront of addressing these requirements, offering a wide range of cutting-edge solutions. One key area of advancement is the development of novel biomaterials with enhanced properties such as improved biocompatibility, reduced leachable and extractable, and better resistance to chemical interactions. These advancements ensure that the plastic materials used in pharmaceutical applications do not compromise the safety and efficacy of drugs, making them ideal for critical uses such as drug packaging, containers, and medical devices.
Moreover, the progress in nanotechnology and nanomaterials has enabled the creation of specialized plastic particles and coatings that can improve drug delivery systems, enabling targeted and controlled release of medications. This opens up new avenues for personalized medicine and enhances patient outcomes. Additionally, the integration of smart technologies into biopharma plastics is gaining momentum. These technologies include sensors, indicators, and tracking mechanisms that can monitor the condition and integrity of drugs during storage and transportation, ensuring product quality and patient safety.
The biopharma plastics market is segmented on the basis of polymer, application, and region. By polymer, the market is divided into polyethylene, polypropylene, acrylonitrile butadiene styrene, polyethylene terephthalate, polyvinyl chloride, polytetrafluoroethylene, and others. On the basis of the application, it is categorized into protective wear, containers, bioreactor bags, syringes, depth filters, disposable medical connectors, and others. Region-wise, the market is studied across North America, Europe, Asia-Pacific, and LAMEA.
The major players operating in the global biopharma plastics market are BASF SE, SABIC, DOW Inc, Covestro AG, Formosa Plastics Corporation, Solvay, TORAY INDUSTRIES, INC., LyondellBasell Industries Holdings B.V., Mitsui & Co. Plastics Ltd, and INEOS Group.
Other Players include Thermo Fisher Scientific, GE Healthcare, Lonza Group, Corning Incorporated, Saint-Gobain Life Sciences, Eppendorf AG, Merck KGaA, Pall Corporation, Entegris, Inc., Meissner Filtration Products, Inc., Repligen Corporation, West Pharmaceutical Services, Inc., Agilent Technologies and IDEX Health & Science LLC.
Key Benefits For Stakeholders
- This report provides a quantitative analysis of the market segments, current trends, estimations, and dynamics of the biopharma plastics market analysis from 2022 to 2032 to identify the prevailing biopharma plastics market opportunities.
- The market research is offered along with information related to key drivers, restraints, and opportunities.
- Porter's five forces analysis highlights the potency of buyers and suppliers to enable stakeholders make profit-oriented business decisions and strengthen their supplier-buyer network.
- In-depth analysis of the biopharma plastics market segmentation assists to determine the prevailing market opportunities.
- Major countries in each region are mapped according to their revenue contribution to the global market.
- Market player positioning facilitates benchmarking and provides a clear understanding of the present position of the market players.
- The report includes the analysis of the regional as well as global biopharma plastics market trends, key players, market segments, application areas, and market growth strategies.
Additional benefits you will get with this purchase are:
- Quarterly Update and* (only available with a corporate license, on listed price)
- 5 additional Company Profile of client Choice pre- or Post-purchase, as a free update.
- Free Upcoming Version on the Purchase of Five and Enterprise User License.
- 16 analyst hours of support* (post-purchase, if you find additional data requirements upon review of the report, you may receive support amounting to 16 analyst hours to solve questions, and post-sale queries)
- 15% Free Customization* (in case the scope or segment of the report does not match your requirements, 20% is equivalent to 3 working days of free work, applicable once)
- Free data Pack on the Five and Enterprise User License. (Excel version of the report)
- Free Updated report if the report is 6-12 months old or older.
- 24-hour priority response*
- Free Industry updates and white papers.
Possible Customization with this report (with additional cost and timeline talk to the sales executive to know more)
- Analysis of raw material in a product (by %)
- Manufacturing Capacity
- End user preferences and pain points
- Investment Opportunities
- Product Benchmarking / Product specification and applications
- Product Life Cycles
- Senario Analysis & Growth Trend Comparision
- Supply Chain Analysis & Vendor Margins
- Upcoming/New Entrant by Regions
- Market share analysis of players by products/segments
- New Product Development/ Product Matrix of Key Players
- Regulatory Guidelines
- Additional company profiles with specific to client's interest
- Additional country or region analysis- market size and forecast
- Average Selling Price Analysis / Price Point Analysis
- Brands Share Analysis
- Expanded list for Company Profiles
- Historic market data
- Import Export Analysis/Data
- Key player details (including location, contact details, supplier/vendor network etc. in excel format)
- List of customers/consumers/raw material suppliers- value chain analysis
- Market share analysis of players at global/region/country level
- Product Consumption Analysis
- Volume Market Size and Forecast
Key Market Segments
By Application
- Protective Wear
- Containers
- Bioreactor Bags
- Syringes
- Depth Filters
- Disposable Medical Connectors
- Others
By Polymer
- Polyethylene
- Polypropylene
- Acrylonitrile Butadiene Styrene
- Polyethylene Terephthalate
- Polyvinyl Chloride
- Polytetrafluoroethylene
- Others
By Region
- North America
- U.S.
- Canada
- Mexico
- Europe
- Germany
- UK
- France
- Spain
- Italy
- Rest of Europe
- Asia-Pacific
- China
- India
- Japan
- South Korea
- Australia
- Rest of Asia-Pacific
- LAMEA
- Brazil
- Saudi Arabia
- South Africa
- Rest of LAMEA
Key Market Players:
- BASF SE
- SABIC
- Solvay
- LyondellBasell Industries Holdings B.V.
- Dow Inc.
- Covestro AG.
- INEOS Group
- Formosa Plastics Corporation
- Mitsui & Co.Plastics Ltd
- TORAY INDUSTRIES, INC.
TABLE OF CONTENTS
CHAPTER 1: INTRODUCTION
- 1.1. Report description
- 1.2. Key market segments
- 1.3. Key benefits to the stakeholders
- 1.4. Research Methodology
- 1.4.1. Primary research
- 1.4.2. Secondary research
- 1.4.3. Analyst tools and models
CHAPTER 2: EXECUTIVE SUMMARY
- 2.1. CXO Perspective
CHAPTER 3: MARKET OVERVIEW
- 3.1. Market definition and scope
- 3.2. Key findings
- 3.2.1. Top impacting factors
- 3.2.2. Top investment pockets
- 3.3. Porter's five forces analysis
- 3.3.1. Modearte bargaining power of suppliers
- 3.3.2. Moderate threat of new entrants
- 3.3.3. High threat of substitutes
- 3.3.4. High intensity of rivalry
- 3.3.5. High bargaining power of buyers
- 3.4. Market dynamics
- 3.4.1. Drivers
- 3.4.1.1. Growing demand for sustainable packaging
- 3.4.1.2. Rising adoption of biologics and personalized medicines
- 3.4.1. Drivers
- 3.4.2. Restraints
- 3.4.2.1. High cost of biopharma plastics
- 3.4.3. Opportunities
- 3.4.3.1. Advancements in biopharma plastic technologies
- 3.5. COVID-19 Impact Analysis on the market
- 3.6. Market Share Analysis
- 3.7. Value Chain Analysis
- 3.8. Regulatory Guidelines
- 3.9. Patent Landscape
- 3.10. Pricing Analysis
CHAPTER 4: BIOPHARMA PLASTICS MARKET, BY POLYMER
- 4.1. Overview
- 4.1.1. Market size and forecast
- 4.2. Polyethylene
- 4.2.1. Key market trends, growth factors and opportunities
- 4.2.2. Market size and forecast, by region
- 4.2.3. Market share analysis by country
- 4.3. Polypropylene
- 4.3.1. Key market trends, growth factors and opportunities
- 4.3.2. Market size and forecast, by region
- 4.3.3. Market share analysis by country
- 4.4. Acrylonitrile Butadiene Styrene
- 4.4.1. Key market trends, growth factors and opportunities
- 4.4.2. Market size and forecast, by region
- 4.4.3. Market share analysis by country
- 4.5. Polyethylene Terephthalate
- 4.5.1. Key market trends, growth factors and opportunities
- 4.5.2. Market size and forecast, by region
- 4.5.3. Market share analysis by country
- 4.6. Polyvinyl Chloride
- 4.6.1. Key market trends, growth factors and opportunities
- 4.6.2. Market size and forecast, by region
- 4.6.3. Market share analysis by country
- 4.7. Polytetrafluoroethylene
- 4.7.1. Key market trends, growth factors and opportunities
- 4.7.2. Market size and forecast, by region
- 4.7.3. Market share analysis by country
- 4.8. Others
- 4.8.1. Key market trends, growth factors and opportunities
- 4.8.2. Market size and forecast, by region
- 4.8.3. Market share analysis by country
CHAPTER 5: BIOPHARMA PLASTICS MARKET, BY APPLICATION
- 5.1. Overview
- 5.1.1. Market size and forecast
- 5.2. Protective Wear
- 5.2.1. Key market trends, growth factors and opportunities
- 5.2.2. Market size and forecast, by region
- 5.2.3. Market share analysis by country
- 5.3. Containers
- 5.3.1. Key market trends, growth factors and opportunities
- 5.3.2. Market size and forecast, by region
- 5.3.3. Market share analysis by country
- 5.4. Bioreactor Bags
- 5.4.1. Key market trends, growth factors and opportunities
- 5.4.2. Market size and forecast, by region
- 5.4.3. Market share analysis by country
- 5.5. Syringes
- 5.5.1. Key market trends, growth factors and opportunities
- 5.5.2. Market size and forecast, by region
- 5.5.3. Market share analysis by country
- 5.6. Depth Filters
- 5.6.1. Key market trends, growth factors and opportunities
- 5.6.2. Market size and forecast, by region
- 5.6.3. Market share analysis by country
- 5.7. Disposable Medical Connectors
- 5.7.1. Key market trends, growth factors and opportunities
- 5.7.2. Market size and forecast, by region
- 5.7.3. Market share analysis by country
- 5.8. Others
- 5.8.1. Key market trends, growth factors and opportunities
- 5.8.2. Market size and forecast, by region
- 5.8.3. Market share analysis by country
CHAPTER 6: BIOPHARMA PLASTICS MARKET, BY REGION
- 6.1. Overview
- 6.1.1. Market size and forecast By Region
- 6.2. North America
- 6.2.1. Key market trends, growth factors and opportunities
- 6.2.2. Market size and forecast, by Polymer
- 6.2.3. Market size and forecast, by Application
- 6.2.4. Market size and forecast, by country
- 6.2.4.1. U.S.
- 6.2.4.1.1. Market size and forecast, by Polymer
- 6.2.4.1.2. Market size and forecast, by Application
- 6.2.4.2. Canada
- 6.2.4.2.1. Market size and forecast, by Polymer
- 6.2.4.2.2. Market size and forecast, by Application
- 6.2.4.3. Mexico
- 6.2.4.3.1. Market size and forecast, by Polymer
- 6.2.4.3.2. Market size and forecast, by Application
- 6.3. Europe
- 6.3.1. Key market trends, growth factors and opportunities
- 6.3.2. Market size and forecast, by Polymer
- 6.3.3. Market size and forecast, by Application
- 6.3.4. Market size and forecast, by country
- 6.3.4.1. Germany
- 6.3.4.1.1. Market size and forecast, by Polymer
- 6.3.4.1.2. Market size and forecast, by Application
- 6.3.4.2. UK
- 6.3.4.2.1. Market size and forecast, by Polymer
- 6.3.4.2.2. Market size and forecast, by Application
- 6.3.4.3. France
- 6.3.4.3.1. Market size and forecast, by Polymer
- 6.3.4.3.2. Market size and forecast, by Application
- 6.3.4.4. Spain
- 6.3.4.4.1. Market size and forecast, by Polymer
- 6.3.4.4.2. Market size and forecast, by Application
- 6.3.4.5. Italy
- 6.3.4.5.1. Market size and forecast, by Polymer
- 6.3.4.5.2. Market size and forecast, by Application
- 6.3.4.6. Rest of Europe
- 6.3.4.6.1. Market size and forecast, by Polymer
- 6.3.4.6.2. Market size and forecast, by Application
- 6.4. Asia-Pacific
- 6.4.1. Key market trends, growth factors and opportunities
- 6.4.2. Market size and forecast, by Polymer
- 6.4.3. Market size and forecast, by Application
- 6.4.4. Market size and forecast, by country
- 6.4.4.1. China
- 6.4.4.1.1. Market size and forecast, by Polymer
- 6.4.4.1.2. Market size and forecast, by Application
- 6.4.4.2. India
- 6.4.4.2.1. Market size and forecast, by Polymer
- 6.4.4.2.2. Market size and forecast, by Application
- 6.4.4.3. Japan
- 6.4.4.3.1. Market size and forecast, by Polymer
- 6.4.4.3.2. Market size and forecast, by Application
- 6.4.4.4. South Korea
- 6.4.4.4.1. Market size and forecast, by Polymer
- 6.4.4.4.2. Market size and forecast, by Application
- 6.4.4.5. Australia
- 6.4.4.5.1. Market size and forecast, by Polymer
- 6.4.4.5.2. Market size and forecast, by Application
- 6.4.4.6. Rest of Asia-Pacific
- 6.4.4.6.1. Market size and forecast, by Polymer
- 6.4.4.6.2. Market size and forecast, by Application
- 6.5. LAMEA
- 6.5.1. Key market trends, growth factors and opportunities
- 6.5.2. Market size and forecast, by Polymer
- 6.5.3. Market size and forecast, by Application
- 6.5.4. Market size and forecast, by country
- 6.5.4.1. Brazil
- 6.5.4.1.1. Market size and forecast, by Polymer
- 6.5.4.1.2. Market size and forecast, by Application
- 6.5.4.2. Saudi Arabia
- 6.5.4.2.1. Market size and forecast, by Polymer
- 6.5.4.2.2. Market size and forecast, by Application
- 6.5.4.3. South Africa
- 6.5.4.3.1. Market size and forecast, by Polymer
- 6.5.4.3.2. Market size and forecast, by Application
- 6.5.4.4. Rest of LAMEA
- 6.5.4.4.1. Market size and forecast, by Polymer
- 6.5.4.4.2. Market size and forecast, by Application
CHAPTER 7: COMPETITIVE LANDSCAPE
- 7.1. Introduction
- 7.2. Top winning strategies
- 7.3. Product Mapping of Top 10 Player
- 7.4. Competitive Dashboard
- 7.5. Competitive Heatmap
- 7.6. Top player positioning, 2022
CHAPTER 8: COMPANY PROFILES
- 8.1. BASF SE
- 8.1.1. Company overview
- 8.1.2. Key Executives
- 8.1.3. Company snapshot
- 8.1.4. Operating business segments
- 8.1.5. Product portfolio
- 8.1.6. Business performance
- 8.2. SABIC
- 8.2.1. Company overview
- 8.2.2. Key Executives
- 8.2.3. Company snapshot
- 8.2.4. Operating business segments
- 8.2.5. Product portfolio
- 8.2.6. Business performance
- 8.3. Dow Inc.
- 8.3.1. Company overview
- 8.3.2. Key Executives
- 8.3.3. Company snapshot
- 8.3.4. Operating business segments
- 8.3.5. Product portfolio
- 8.3.6. Business performance
- 8.4. Covestro AG.
- 8.4.1. Company overview
- 8.4.2. Key Executives
- 8.4.3. Company snapshot
- 8.4.4. Operating business segments
- 8.4.5. Product portfolio
- 8.4.6. Business performance
- 8.5. Formosa Plastics Corporation
- 8.5.1. Company overview
- 8.5.2. Key Executives
- 8.5.3. Company snapshot
- 8.5.4. Operating business segments
- 8.5.5. Product portfolio
- 8.5.6. Business performance
- 8.6. Solvay
- 8.6.1. Company overview
- 8.6.2. Key Executives
- 8.6.3. Company snapshot
- 8.6.4. Operating business segments
- 8.6.5. Product portfolio
- 8.6.6. Business performance
- 8.7. TORAY INDUSTRIES, INC.
- 8.7.1. Company overview
- 8.7.2. Key Executives
- 8.7.3. Company snapshot
- 8.7.4. Operating business segments
- 8.7.5. Product portfolio
- 8.7.6. Business performance
- 8.8. LyondellBasell Industries Holdings B.V.
- 8.8.1. Company overview
- 8.8.2. Key Executives
- 8.8.3. Company snapshot
- 8.8.4. Operating business segments
- 8.8.5. Product portfolio
- 8.8.6. Business performance
- 8.9. Mitsui & Co.Plastics Ltd
- 8.9.1. Company overview
- 8.9.2. Key Executives
- 8.9.3. Company snapshot
- 8.9.4. Operating business segments
- 8.9.5. Product portfolio
- 8.9.6. Business performance
- 8.10. INEOS Group
- 8.10.1. Company overview
- 8.10.2. Key Executives
- 8.10.3. Company snapshot
- 8.10.4. Operating business segments
- 8.10.5. Product portfolio
- 8.10.6. Business performance
