|
|
市場調査レポート
商品コード
1365822
アクセスコントロールハードウェア市場:タイプ別、業界別、2023年~2032年の世界機会分析と産業予測Access Control Hardware Market By Type, By Industry Vertical: Global Opportunity Analysis and Industry Forecast, 2023-2032 |
||||||
|
|
|||||||
|
|||||||


| アクセスコントロールハードウェア市場:タイプ別、業界別、2023年~2032年の世界機会分析と産業予測 |
|
出版日: 2023年08月01日
発行: Allied Market Research
ページ情報: 英文 241 Pages
納期: 2~3営業日
|

- 全表示
- 概要
- 図表
- 目次
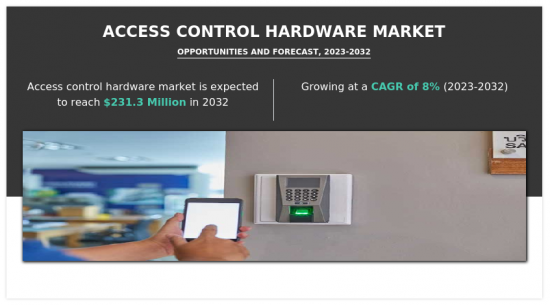
アクセスコントロールハードウェア市場は、2022年に1億830万米ドルと評価され、2023年から2032年にかけてCAGR 8%で成長し、2032年には2億3,130万米ドルに達すると予測されています。
建物やその内部の特定の場所へのアクセスを制限するために使用される物理的なコンポーネントは、アクセスコントロールハードウェアと呼ばれます。これらの技術は、許可された人だけにアクセスを許可し、それ以外の人はアクセスできないようにすることで、地域の安全性を高めることに貢献します。会社、学校、公共施設、住宅など、多くの場所でアクセスコントロール装置が設置されています。
アクセスコントロールハードウェア市場は、主に大幅な技術進歩により著しい成長を遂げています。生体認証、顔認証、モバイル・アクセス・コントロール、クラウドベースのソリューションなど、アクセス・コントロール技術の革新は業界に革命をもたらしました。これらの進歩により、より洗練された安全なアクセスコントロールシステムが実現し、商業施設と住宅の両方でセキュリティ強化に対する需要の高まりに対応しています。人工知能(AI)と機械学習(ML)の統合は、こうした技術的進歩をさらに加速させ、アクセスコントロールハードウェアをより効率的かつ効果的にしています。
しかし、アクセスコントロールハードウェア市場は、脆弱性やサイバー脅威に関する課題にも直面しています。アクセスコントロールシステムがインターネットを通じて相互接続され、さまざまな機器と統合されるようになったことで、サイバー攻撃の潜在的な標的となっています。このため、サイバーセキュリティの脆弱性やシステムへの不正アクセスのリスクに関して、顧客の間で大きな懸念が高まっています。このような侵害がもたらす潜在的な影響から、企業や組織はアクセスコントロールソリューションを導入する際、強固なセキュリティ対策を優先するようになっています。市場のベンダーは、高度なセキュリティ機能を開拓し、定期的なアップデートを実施することで、潜在的なサイバー脅威に先手を打ち、こうした懸念に熱心に取り組んでいます。
脆弱性やサイバー脅威がもたらす課題にもかかわらず、アクセスコントロールハードウェア市場は、さまざまな産業での利用の増加を通じて機会を見出しています。アクセスコントロールハードウェアの需要は、商業、医療、政府、交通、教育などのセクターで増加傾向にあります。各業界には固有のセキュリティ・ニーズがあり、アクセスコントロールソリューションは、これらの要件に対応するためのカスタマイズされた効果的な方法を提供します。政府機関では、アクセスコントロールハードウェアは、政府庁舎、安全な施設、制限区域へのアクセスを制御し、許可された職員のみが入場できるようにし、不正侵入のリスクを低減するために不可欠です。
アクセスコントロールハードウェア市場は、タイプ、業界別、地域別に区分されます。タイプ別では、電子ロック、リーダー、コントローラー、その他に分類されます。業界別では、アクセスコントロールハードウェア産業は、IT&テレコム、BFSI、防衛&航空宇宙、製造、医療、輸送&物流、政府、その他に細分化されます。地域別では、北米(米国、カナダ、メキシコ)、欧州(英国、ドイツ、フランス、その他の欧州地域)、アジア太平洋(中国、日本、インド、韓国、その他のアジア太平洋)、その他のアジア太平洋(中南米、中東・アフリカ)で分析しています。
目次
第1章 イントロダクション
第2章 エグゼクティブサマリー
第3章 市場概要
- 市場の定義と範囲
- 主な調査結果
- 影響要因
- 主な投資機会
- ポーターのファイブフォース分析
- 市場力学
- 促進要因
- スマートホーム・スマートビルシステムの採用
- 都市化とインフラ整備の増加
- 抑制要因
- 初期コストの高さ
- 機会
- モバイルアクセスコントロールソリューション
- 促進要因
- COVID-19市場への影響分析
第4章 アクセスコントロールハードウェア市場:タイプ別
- 概要
- 電子ロック
- リーダー
- コントローラー
- その他
第5章 アクセスコントロールハードウェア市場:業界別
- 概要
- ITおよびテレコム
- BFSI
- 防衛・航空宇宙
- 製造業
- 医療
- 運輸・物流
- 政府機関
- その他
第6章 アクセスコントロールハードウェア市場:地域別
- 概要
- 北米
- 米国
- カナダ
- メキシコ
- 欧州
- 英国
- ドイツ
- フランス
- その他
- アジア太平洋
- 中国
- 日本
- インド
- 韓国
- その他
- ラテンアメリカ
- ラテンアメリカ
- 中東
- アフリカ
第7章 競合情勢
- イントロダクション
- 主要成功戦略
- 主要10社の製品マッピング
- 競合ダッシュボード
- 競合ヒートマップ
- 主要企業のポジショニング、2022年
第8章 企業プロファイル
- Bosch Security Systems, LLC.
- Cisco Systems Inc.
- Hanwha Vision Co., Ltd.(Hanwha Group)
- Honeywell International Inc.
- Johnson Controls
- Schneider Electric SE.
- Siemens AG
- Southco, Inc.
- Suprema Inc.
- Thales Group(Gemalto NV)
LIST OF TABLES
- TABLE 01. GLOBAL ACCESS CONTROL HARDWARE MARKET, BY TYPE, 2022-2032 ($MILLION)
- TABLE 02. ACCESS CONTROL HARDWARE MARKET FOR ELECTRONIC LOCKS, BY REGION, 2022-2032 ($MILLION)
- TABLE 03. ACCESS CONTROL HARDWARE MARKET FOR READERS, BY REGION, 2022-2032 ($MILLION)
- TABLE 04. ACCESS CONTROL HARDWARE MARKET FOR CONTROLLERS, BY REGION, 2022-2032 ($MILLION)
- TABLE 05. ACCESS CONTROL HARDWARE MARKET FOR OTHERS, BY REGION, 2022-2032 ($MILLION)
- TABLE 06. GLOBAL ACCESS CONTROL HARDWARE MARKET, BY INDUSTRY VERTICAL, 2022-2032 ($MILLION)
- TABLE 07. ACCESS CONTROL HARDWARE MARKET FOR IT AND TELECOM, BY REGION, 2022-2032 ($MILLION)
- TABLE 08. ACCESS CONTROL HARDWARE MARKET FOR BFSI, BY REGION, 2022-2032 ($MILLION)
- TABLE 09. ACCESS CONTROL HARDWARE MARKET FOR DEFENSE AND AEROSPACE, BY REGION, 2022-2032 ($MILLION)
- TABLE 10. ACCESS CONTROL HARDWARE MARKET FOR MANUFACTURING, BY REGION, 2022-2032 ($MILLION)
- TABLE 11. ACCESS CONTROL HARDWARE MARKET FOR HEALTHCARE, BY REGION, 2022-2032 ($MILLION)
- TABLE 12. ACCESS CONTROL HARDWARE MARKET FOR TRANSPORTATION AND LOGISTICS, BY REGION, 2022-2032 ($MILLION)
- TABLE 13. ACCESS CONTROL HARDWARE MARKET FOR GOVERNMENT, BY REGION, 2022-2032 ($MILLION)
- TABLE 14. ACCESS CONTROL HARDWARE MARKET FOR OTHERS, BY REGION, 2022-2032 ($MILLION)
- TABLE 15. ACCESS CONTROL HARDWARE MARKET, BY REGION, 2022-2032 ($MILLION)
- TABLE 16. NORTH AMERICA ACCESS CONTROL HARDWARE MARKET, BY TYPE, 2022-2032 ($MILLION)
- TABLE 17. NORTH AMERICA ACCESS CONTROL HARDWARE MARKET, BY INDUSTRY VERTICAL, 2022-2032 ($MILLION)
- TABLE 18. NORTH AMERICA ACCESS CONTROL HARDWARE MARKET, BY COUNTRY, 2022-2032 ($MILLION)
- TABLE 19. U.S. ACCESS CONTROL HARDWARE MARKET, BY TYPE, 2022-2032 ($MILLION)
- TABLE 20. U.S. ACCESS CONTROL HARDWARE MARKET, BY INDUSTRY VERTICAL, 2022-2032 ($MILLION)
- TABLE 21. CANADA ACCESS CONTROL HARDWARE MARKET, BY TYPE, 2022-2032 ($MILLION)
- TABLE 22. CANADA ACCESS CONTROL HARDWARE MARKET, BY INDUSTRY VERTICAL, 2022-2032 ($MILLION)
- TABLE 23. MEXICO ACCESS CONTROL HARDWARE MARKET, BY TYPE, 2022-2032 ($MILLION)
- TABLE 24. MEXICO ACCESS CONTROL HARDWARE MARKET, BY INDUSTRY VERTICAL, 2022-2032 ($MILLION)
- TABLE 25. EUROPE ACCESS CONTROL HARDWARE MARKET, BY TYPE, 2022-2032 ($MILLION)
- TABLE 26. EUROPE ACCESS CONTROL HARDWARE MARKET, BY INDUSTRY VERTICAL, 2022-2032 ($MILLION)
- TABLE 27. EUROPE ACCESS CONTROL HARDWARE MARKET, BY COUNTRY, 2022-2032 ($MILLION)
- TABLE 28. UK ACCESS CONTROL HARDWARE MARKET, BY TYPE, 2022-2032 ($MILLION)
- TABLE 29. UK ACCESS CONTROL HARDWARE MARKET, BY INDUSTRY VERTICAL, 2022-2032 ($MILLION)
- TABLE 30. GERMANY ACCESS CONTROL HARDWARE MARKET, BY TYPE, 2022-2032 ($MILLION)
- TABLE 31. GERMANY ACCESS CONTROL HARDWARE MARKET, BY INDUSTRY VERTICAL, 2022-2032 ($MILLION)
- TABLE 32. FRANCE ACCESS CONTROL HARDWARE MARKET, BY TYPE, 2022-2032 ($MILLION)
- TABLE 33. FRANCE ACCESS CONTROL HARDWARE MARKET, BY INDUSTRY VERTICAL, 2022-2032 ($MILLION)
- TABLE 34. REST OF EUROPE ACCESS CONTROL HARDWARE MARKET, BY TYPE, 2022-2032 ($MILLION)
- TABLE 35. REST OF EUROPE ACCESS CONTROL HARDWARE MARKET, BY INDUSTRY VERTICAL, 2022-2032 ($MILLION)
- TABLE 36. ASIA-PACIFIC ACCESS CONTROL HARDWARE MARKET, BY TYPE, 2022-2032 ($MILLION)
- TABLE 37. ASIA-PACIFIC ACCESS CONTROL HARDWARE MARKET, BY INDUSTRY VERTICAL, 2022-2032 ($MILLION)
- TABLE 38. ASIA-PACIFIC ACCESS CONTROL HARDWARE MARKET, BY COUNTRY, 2022-2032 ($MILLION)
- TABLE 39. CHINA ACCESS CONTROL HARDWARE MARKET, BY TYPE, 2022-2032 ($MILLION)
- TABLE 40. CHINA ACCESS CONTROL HARDWARE MARKET, BY INDUSTRY VERTICAL, 2022-2032 ($MILLION)
- TABLE 41. JAPAN ACCESS CONTROL HARDWARE MARKET, BY TYPE, 2022-2032 ($MILLION)
- TABLE 42. JAPAN ACCESS CONTROL HARDWARE MARKET, BY INDUSTRY VERTICAL, 2022-2032 ($MILLION)
- TABLE 43. INDIA ACCESS CONTROL HARDWARE MARKET, BY TYPE, 2022-2032 ($MILLION)
- TABLE 44. INDIA ACCESS CONTROL HARDWARE MARKET, BY INDUSTRY VERTICAL, 2022-2032 ($MILLION)
- TABLE 45. SOUTH KOREA ACCESS CONTROL HARDWARE MARKET, BY TYPE, 2022-2032 ($MILLION)
- TABLE 46. SOUTH KOREA ACCESS CONTROL HARDWARE MARKET, BY INDUSTRY VERTICAL, 2022-2032 ($MILLION)
- TABLE 47. REST OF ASIA-PACIFIC ACCESS CONTROL HARDWARE MARKET, BY TYPE, 2022-2032 ($MILLION)
- TABLE 48. REST OF ASIA-PACIFIC ACCESS CONTROL HARDWARE MARKET, BY INDUSTRY VERTICAL, 2022-2032 ($MILLION)
- TABLE 49. LAMEA ACCESS CONTROL HARDWARE MARKET, BY TYPE, 2022-2032 ($MILLION)
- TABLE 50. LAMEA ACCESS CONTROL HARDWARE MARKET, BY INDUSTRY VERTICAL, 2022-2032 ($MILLION)
- TABLE 51. LAMEA ACCESS CONTROL HARDWARE MARKET, BY COUNTRY, 2022-2032 ($MILLION)
- TABLE 52. LATIN AMERICA ACCESS CONTROL HARDWARE MARKET, BY TYPE, 2022-2032 ($MILLION)
- TABLE 53. LATIN AMERICA ACCESS CONTROL HARDWARE MARKET, BY INDUSTRY VERTICAL, 2022-2032 ($MILLION)
- TABLE 54. MIDDLE EAST ACCESS CONTROL HARDWARE MARKET, BY TYPE, 2022-2032 ($MILLION)
- TABLE 55. MIDDLE EAST ACCESS CONTROL HARDWARE MARKET, BY INDUSTRY VERTICAL, 2022-2032 ($MILLION)
- TABLE 56. AFRICA ACCESS CONTROL HARDWARE MARKET, BY TYPE, 2022-2032 ($MILLION)
- TABLE 57. AFRICA ACCESS CONTROL HARDWARE MARKET, BY INDUSTRY VERTICAL, 2022-2032 ($MILLION)
- TABLE 58. BOSCH SECURITY SYSTEMS, LLC.: KEY EXECUTIVES
- TABLE 59. BOSCH SECURITY SYSTEMS, LLC.: COMPANY SNAPSHOT
- TABLE 60. BOSCH SECURITY SYSTEMS, LLC.: PRODUCT SEGMENTS
- TABLE 61. BOSCH SECURITY SYSTEMS, LLC.: PRODUCT PORTFOLIO
- TABLE 62. CISCO SYSTEMS INC.: KEY EXECUTIVES
- TABLE 63. CISCO SYSTEMS INC.: COMPANY SNAPSHOT
- TABLE 64. CISCO SYSTEMS INC.: PRODUCT SEGMENTS
- TABLE 65. CISCO SYSTEMS INC.: PRODUCT PORTFOLIO
- TABLE 66. CISCO SYSTEMS INC.: KEY STRATERGIES
- TABLE 67. HANWHA VISION CO., LTD. (HANWHA GROUP): KEY EXECUTIVES
- TABLE 68. HANWHA VISION CO., LTD. (HANWHA GROUP): COMPANY SNAPSHOT
- TABLE 69. HANWHA VISION CO., LTD. (HANWHA GROUP): PRODUCT SEGMENTS
- TABLE 70. HANWHA VISION CO., LTD. (HANWHA GROUP): PRODUCT PORTFOLIO
- TABLE 71. HANWHA VISION CO., LTD. (HANWHA GROUP): KEY STRATERGIES
- TABLE 72. HONEYWELL INTERNATIONAL INC.: KEY EXECUTIVES
- TABLE 73. HONEYWELL INTERNATIONAL INC.: COMPANY SNAPSHOT
- TABLE 74. HONEYWELL INTERNATIONAL INC.: PRODUCT SEGMENTS
- TABLE 75. HONEYWELL INTERNATIONAL INC.: PRODUCT PORTFOLIO
- TABLE 76. JOHNSON CONTROLS: KEY EXECUTIVES
- TABLE 77. JOHNSON CONTROLS: COMPANY SNAPSHOT
- TABLE 78. JOHNSON CONTROLS: SERVICE SEGMENTS
- TABLE 79. JOHNSON CONTROLS: PRODUCT PORTFOLIO
- TABLE 80. JOHNSON CONTROLS: KEY STRATERGIES
- TABLE 81. SCHNEIDER ELECTRIC SE.: KEY EXECUTIVES
- TABLE 82. SCHNEIDER ELECTRIC SE.: COMPANY SNAPSHOT
- TABLE 83. SCHNEIDER ELECTRIC SE.: PRODUCT SEGMENTS
- TABLE 84. SCHNEIDER ELECTRIC SE.: PRODUCT PORTFOLIO
- TABLE 85. SCHNEIDER ELECTRIC SE.: KEY STRATERGIES
- TABLE 86. SIEMENS AG: KEY EXECUTIVES
- TABLE 87. SIEMENS AG: COMPANY SNAPSHOT
- TABLE 88. SIEMENS AG: PRODUCT SEGMENTS
- TABLE 89. SIEMENS AG: PRODUCT PORTFOLIO
- TABLE 90. SOUTHCO, INC.: KEY EXECUTIVES
- TABLE 91. SOUTHCO, INC.: COMPANY SNAPSHOT
- TABLE 92. SOUTHCO, INC.: PRODUCT SEGMENTS
- TABLE 93. SOUTHCO, INC.: PRODUCT PORTFOLIO
- TABLE 94. SUPREMA INC.: KEY EXECUTIVES
- TABLE 95. SUPREMA INC.: COMPANY SNAPSHOT
- TABLE 96. SUPREMA INC.: PRODUCT SEGMENTS
- TABLE 97. SUPREMA INC.: PRODUCT PORTFOLIO
- TABLE 98. SUPREMA INC.: KEY STRATERGIES
- TABLE 99. THALES GROUP (GEMALTO NV): KEY EXECUTIVES
- TABLE 100. THALES GROUP (GEMALTO NV): COMPANY SNAPSHOT
- TABLE 101. THALES GROUP (GEMALTO NV): PRODUCT SEGMENTS
- TABLE 102. THALES GROUP (GEMALTO NV): PRODUCT PORTFOLIO
- TABLE 103. THALES GROUP (GEMALTO NV): KEY STRATERGIES
LIST OF FIGURES
- FIGURE 01. ACCESS CONTROL HARDWARE MARKET, 2022-2032
- FIGURE 02. SEGMENTATION OF ACCESS CONTROL HARDWARE MARKET,2022-2032
- FIGURE 03. TOP INVESTMENT POCKETS IN ACCESS CONTROL HARDWARE MARKET (2023-2032)
- FIGURE 04. MODERATE BARGAINING POWER OF SUPPLIERS
- FIGURE 05. MODERATELY TO HIGH THREAT OF NEW ENTRANTS
- FIGURE 06. MODERATE THREAT OF SUBSTITUTES
- FIGURE 07. MODERATELY TO HIGH INTENSITY OF RIVALRY
- FIGURE 08. MODERATELY TO HIGH BARGAINING POWER OF BUYERS
- FIGURE 09. GLOBAL ACCESS CONTROL HARDWARE MARKET:DRIVERS, RESTRAINTS AND OPPORTUNITIES
- FIGURE 10. ACCESS CONTROL HARDWARE MARKET, BY TYPE, 2022(%)
- FIGURE 11. COMPARATIVE SHARE ANALYSIS OF ACCESS CONTROL HARDWARE MARKET FOR ELECTRONIC LOCKS, BY COUNTRY 2022 AND 2032(%)
- FIGURE 12. COMPARATIVE SHARE ANALYSIS OF ACCESS CONTROL HARDWARE MARKET FOR READERS, BY COUNTRY 2022 AND 2032(%)
- FIGURE 13. COMPARATIVE SHARE ANALYSIS OF ACCESS CONTROL HARDWARE MARKET FOR CONTROLLERS, BY COUNTRY 2022 AND 2032(%)
- FIGURE 14. COMPARATIVE SHARE ANALYSIS OF ACCESS CONTROL HARDWARE MARKET FOR OTHERS, BY COUNTRY 2022 AND 2032(%)
- FIGURE 15. ACCESS CONTROL HARDWARE MARKET, BY INDUSTRY VERTICAL, 2022(%)
- FIGURE 16. COMPARATIVE SHARE ANALYSIS OF ACCESS CONTROL HARDWARE MARKET FOR IT AND TELECOM, BY COUNTRY 2022 AND 2032(%)
- FIGURE 17. COMPARATIVE SHARE ANALYSIS OF ACCESS CONTROL HARDWARE MARKET FOR BFSI, BY COUNTRY 2022 AND 2032(%)
- FIGURE 18. COMPARATIVE SHARE ANALYSIS OF ACCESS CONTROL HARDWARE MARKET FOR DEFENSE AND AEROSPACE, BY COUNTRY 2022 AND 2032(%)
- FIGURE 19. COMPARATIVE SHARE ANALYSIS OF ACCESS CONTROL HARDWARE MARKET FOR MANUFACTURING, BY COUNTRY 2022 AND 2032(%)
- FIGURE 20. COMPARATIVE SHARE ANALYSIS OF ACCESS CONTROL HARDWARE MARKET FOR HEALTHCARE, BY COUNTRY 2022 AND 2032(%)
- FIGURE 21. COMPARATIVE SHARE ANALYSIS OF ACCESS CONTROL HARDWARE MARKET FOR TRANSPORTATION AND LOGISTICS, BY COUNTRY 2022 AND 2032(%)
- FIGURE 22. COMPARATIVE SHARE ANALYSIS OF ACCESS CONTROL HARDWARE MARKET FOR GOVERNMENT, BY COUNTRY 2022 AND 2032(%)
- FIGURE 23. COMPARATIVE SHARE ANALYSIS OF ACCESS CONTROL HARDWARE MARKET FOR OTHERS, BY COUNTRY 2022 AND 2032(%)
- FIGURE 24. ACCESS CONTROL HARDWARE MARKET BY REGION, 2022(%)
- FIGURE 25. U.S. ACCESS CONTROL HARDWARE MARKET, 2022-2032 ($MILLION)
- FIGURE 26. CANADA ACCESS CONTROL HARDWARE MARKET, 2022-2032 ($MILLION)
- FIGURE 27. MEXICO ACCESS CONTROL HARDWARE MARKET, 2022-2032 ($MILLION)
- FIGURE 28. UK ACCESS CONTROL HARDWARE MARKET, 2022-2032 ($MILLION)
- FIGURE 29. GERMANY ACCESS CONTROL HARDWARE MARKET, 2022-2032 ($MILLION)
- FIGURE 30. FRANCE ACCESS CONTROL HARDWARE MARKET, 2022-2032 ($MILLION)
- FIGURE 31. REST OF EUROPE ACCESS CONTROL HARDWARE MARKET, 2022-2032 ($MILLION)
- FIGURE 32. CHINA ACCESS CONTROL HARDWARE MARKET, 2022-2032 ($MILLION)
- FIGURE 33. JAPAN ACCESS CONTROL HARDWARE MARKET, 2022-2032 ($MILLION)
- FIGURE 34. INDIA ACCESS CONTROL HARDWARE MARKET, 2022-2032 ($MILLION)
- FIGURE 35. SOUTH KOREA ACCESS CONTROL HARDWARE MARKET, 2022-2032 ($MILLION)
- FIGURE 36. REST OF ASIA-PACIFIC ACCESS CONTROL HARDWARE MARKET, 2022-2032 ($MILLION)
- FIGURE 37. LATIN AMERICA ACCESS CONTROL HARDWARE MARKET, 2022-2032 ($MILLION)
- FIGURE 38. MIDDLE EAST ACCESS CONTROL HARDWARE MARKET, 2022-2032 ($MILLION)
- FIGURE 39. AFRICA ACCESS CONTROL HARDWARE MARKET, 2022-2032 ($MILLION)
- FIGURE 40. TOP WINNING STRATEGIES, BY YEAR (2021-2023)
- FIGURE 41. TOP WINNING STRATEGIES, BY DEVELOPMENT (2021-2023)
- FIGURE 42. TOP WINNING STRATEGIES, BY COMPANY (2021-2023)
- FIGURE 43. PRODUCT MAPPING OF TOP 10 PLAYERS
- FIGURE 44. COMPETITIVE DASHBOARD
- FIGURE 45. COMPETITIVE HEATMAP: ACCESS CONTROL HARDWARE MARKET
- FIGURE 46. TOP PLAYER POSITIONING, 2022
- FIGURE 47. BOSCH SECURITY SYSTEMS, LLC.: NET REVENUE, 2020-2022 ($MILLION)
- FIGURE 48. BOSCH SECURITY SYSTEMS, LLC.: RESEARCH & DEVELOPMENT EXPENDITURE, 2020-2022 ($MILLION)
- FIGURE 49. BOSCH SECURITY SYSTEMS, LLC.: REVENUE SHARE BY SEGMENT, 2022 (%)
- FIGURE 50. BOSCH SECURITY SYSTEMS, LLC.: REVENUE SHARE BY REGION, 2022 (%)
- FIGURE 51. CISCO SYSTEMS INC.: RESEARCH & DEVELOPMENT EXPENDITURE, 2020-2022 ($MILLION)
- FIGURE 52. CISCO SYSTEMS INC.: NET SALES, 2020-2022 ($MILLION)
- FIGURE 53. CISCO SYSTEMS INC.: REVENUE SHARE BY SEGMENT, 2022 (%)
- FIGURE 54. CISCO SYSTEMS INC.: REVENUE SHARE BY REGION, 2022 (%)
- FIGURE 55. HANWHA VISION CO., LTD. (HANWHA GROUP): NET SALES, 2020-2022 ($MILLION)
- FIGURE 56. HONEYWELL INTERNATIONAL INC.: NET REVENUE, 2020-2022 ($MILLION)
- FIGURE 57. HONEYWELL INTERNATIONAL INC.: RESEARCH & DEVELOPMENT EXPENDITURE, 2020-2022 ($MILLION)
- FIGURE 58. HONEYWELL INTERNATIONAL INC.: REVENUE SHARE BY SEGMENT, 2022 (%)
- FIGURE 59. HONEYWELL INTERNATIONAL INC.: REVENUE SHARE BY REGION, 2022 (%)
- FIGURE 60. JOHNSON CONTROLS: NET REVENUE, 2020-2022 ($MILLION)
- FIGURE 61. JOHNSON CONTROLS: RESEARCH & DEVELOPMENT EXPENDITURE, 2020-2022 ($MILLION)
- FIGURE 62. JOHNSON CONTROLS: REVENUE SHARE BY SEGMENT, 2022 (%)
- FIGURE 63. JOHNSON CONTROLS: REVENUE SHARE BY REGION, 2022 (%)
- FIGURE 64. SCHNEIDER ELECTRIC SE.: NET REVENUE, 2020-2022 ($MILLION)
- FIGURE 65. SCHNEIDER ELECTRIC SE.: RESEARCH & DEVELOPMENT EXPENDITURE, 2020-2022 ($MILLION)
- FIGURE 66. SCHNEIDER ELECTRIC SE.: REVENUE SHARE BY SEGMENT, 2022 (%)
- FIGURE 67. SCHNEIDER ELECTRIC SE.: REVENUE SHARE BY REGION, 2022 (%)
- FIGURE 68. SIEMENS AG: NET REVENUE, 2020-2022 ($MILLION)
- FIGURE 69. SIEMENS AG: REVENUE SHARE BY SEGMENT, 2022 (%)
- FIGURE 70. SIEMENS AG: REVENUE SHARE BY REGION, 2022 (%)
- FIGURE 71. THALES GROUP (GEMALTO NV): NET REVENUE, 2020-2022 ($MILLION)
- FIGURE 72. THALES GROUP (GEMALTO NV): REVENUE SHARE BY REGION, 2022 (%)
- FIGURE 73. THALES GROUP (GEMALTO NV): REVENUE SHARE BY SEGMENT, 2022 (%)
According to a new report published by Allied Market Research, titled, "Access control hardware Market," The access control hardware market was valued at $108.30 million in 2022, and is estimated to reach $231.3 million by 2032, growing at a CAGR of 8% from 2023 to 2032.
The physical components used to restrict access to a building or certain locations inside it are referred to as access control hardware. By letting only authorized individuals access while preventing others, these technologies contribute to making the area safer. Many locations, including companies, schools, public buildings, and houses, have access control devices.
The access control hardware market is witnessing remarkable growth primarily due to significant technological advancements. Innovations in access control technologies, such as biometric authentication, facial recognition, mobile access control, and cloud-based solutions, have revolutionized the industry. These advancements have led to more sophisticated and secure access control systems, catering to the increasing demands for enhanced security in both commercial and residential settings. The integration of artificial intelligence (AI) and machine learning (ML) has further accelerated these technological advancements, making access control hardware more efficient and effective.
However, the access control hardware market also faces challenges related to vulnerabilities and cyber threats. With access control systems becoming more interconnected through the internet and integrated with various devices, they have become potential targets for cyberattacks. This has raised significant concerns among customers regarding cybersecurity vulnerabilities and the risk of unauthorized access to their systems. The potential consequences of such breaches have led businesses and organizations to prioritize robust security measures when implementing access control solutions. Vendors in the market are diligently addressing these concerns by developing advanced security features and implementing regular updates to stay ahead of potential cyber threats.
Despite the challenges posed by vulnerabilities and cyber threats, the Access control hardware market is finding opportunities through its increasing use in various industries. The demand for access control hardware is on the rise across sectors such as commercial, healthcare, government, transportation, and education. Each industry has specific security needs, and access control solutions offer tailored and effective ways to address these requirements. In government institutions, access control hardware is essential for controlling access to government buildings, secure facilities, and restricted areas, ensuring that only authorized personnel can enter and reducing the risk of unauthorized breaches.
The access control hardware market is segmented on the basis of type, industry vertical, and region. By type, the market is categorized into electronic locks, readers, controllers, and others. By industry vertical, the access control hardware industry is fragmented into IT & telecom, BFSI, defense & aerospace, manufacturing, healthcare, transportation & logistics, government, and others. By region, the market is analyzed across North America (U.S., Canada, and Mexico), Europe (UK, Germany, France, and rest of Europe), Asia-Pacific (China, Japan, India, South Korea, and rest of Asia-Pacific) and LAMEA (Latin America, Middle East, and Africa).
The Major companies profiled in the report include: Bosch Security System Inc., Cisco Systems Inc., Hanwha Techwin Co. Ltd., Honeywell International Inc., Johnson Controls, Schneider Electric SE, Siemens AG, Southco, Inc., Suprema Inc., and Thales Group (Gemalto NV).
Key Benefits For Stakeholders
- This report provides a quantitative analysis of the market segments, current trends, estimations, and dynamics of the access control hardware market analysis from 2022 to 2032 to identify the prevailing access control hardware market opportunities.
- The market research is offered along with information related to key drivers, restraints, and opportunities.
- Porter's five forces analysis highlights the potency of buyers and suppliers to enable stakeholders make profit-oriented business decisions and strengthen their supplier-buyer network.
- In-depth analysis of the access control hardware market segmentation assists to determine the prevailing market opportunities.
- Major countries in each region are mapped according to their revenue contribution to the global market.
- Market player positioning facilitates benchmarking and provides a clear understanding of the present position of the market players.
- The report includes the analysis of the regional as well as global access control hardware market trends, key players, market segments, application areas, and market growth strategies.
Additional benefits you will get with this purchase are:
- Quarterly Update and* (only available with a corporate license, on listed price)
- 5 additional Company Profile of client Choice pre- or Post-purchase, as a free update.
- Free Upcoming Version on the Purchase of Five and Enterprise User License.
- 16 analyst hours of support* (post-purchase, if you find additional data requirements upon review of the report, you may receive support amounting to 16 analyst hours to solve questions, and post-sale queries)
- 15% Free Customization* (in case the scope or segment of the report does not match your requirements, 20% is equivalent to 3 working days of free work, applicable once)
- Free data Pack on the Five and Enterprise User License. (Excel version of the report)
- Free Updated report if the report is 6-12 months old or older.
- 24-hour priority response*
- Free Industry updates and white papers.
Possible Customization with this report (with additional cost and timeline talk to the sales executive to know more)
- Product Benchmarking / Product specification and applications
- Product Life Cycles
- Supply Chain Analysis & Vendor Margins
- Upcoming/New Entrant by Regions
- Market share analysis of players by products/segments
- New Product Development/ Product Matrix of Key Players
- Additional company profiles with specific to client's interest
- Additional country or region analysis- market size and forecast
- Expanded list for Company Profiles
- Historic market data
- Key player details (including location, contact details, supplier/vendor network etc. in excel format)
- Market share analysis of players at global/region/country level
Key Market Segments
By Industry Vertical
- Defense and Aerospace
- Manufacturing
- Healthcare
- Transportation and Logistics
- Government
- Others
- IT and Telecom
- BFSI
By Type
- Electronic Locks
- Readers
- Controllers
- Others
By Region
- North America
- U.S.
- Canada
- Mexico
- Europe
- UK
- Germany
- France
- Rest of Europe
- Asia-Pacific
- China
- Japan
- India
- South Korea
- Rest of Asia-Pacific
- LAMEA
- Latin America
- Middle East
- Africa
Key Market Players:
- Honeywell International Inc.
- Hanwha Vision Co., Ltd. (Hanwha Group)
- Suprema Inc.
- Bosch Security Systems, LLC.
- Southco, Inc.
- Thales Group (Gemalto NV)
- Cisco Systems Inc.
- Schneider Electric SE.
- Johnson Controls
- Siemens AG
TABLE OF CONTENTS
CHAPTER 1: INTRODUCTION
- 1.1. Report description
- 1.2. Key market segments
- 1.3. Key benefits to the stakeholders
- 1.4. Research Methodology
- 1.4.1. Primary research
- 1.4.2. Secondary research
- 1.4.3. Analyst tools and models
CHAPTER 2: EXECUTIVE SUMMARY
- 2.1. CXO Perspective
CHAPTER 3: MARKET OVERVIEW
- 3.1. Market definition and scope
- 3.2. Key findings
- 3.2.1. Top impacting factors
- 3.2.2. Top investment pockets
- 3.3. Porter's five forces analysis
- 3.3.1. Moderate bargaining power of suppliers
- 3.3.2. Moderately to high threat of new entrants
- 3.3.3. Moderate threat of substitutes
- 3.3.4. Moderately to high intensity of rivalry
- 3.3.5. Moderately to high bargaining power of buyers
- 3.4. Market dynamics
- 3.4.1. Drivers
- 3.4.1.1. Adoption of smart homes and smart building systems
- 3.4.1.2. Increasing urbanization and infrastructure development
- 3.4.1. Drivers
- 3.4.2. Restraints
- 3.4.2.1. High initial costs
- 3.4.3. Opportunities
- 3.4.3.1. Mobile access control solutions
- 3.5. COVID-19 Impact Analysis on the market
CHAPTER 4: ACCESS CONTROL HARDWARE MARKET, BY TYPE
- 4.1. Overview
- 4.1.1. Market size and forecast
- 4.2. Electronic Locks
- 4.2.1. Key market trends, growth factors and opportunities
- 4.2.2. Market size and forecast, by region
- 4.2.3. Market share analysis by country
- 4.3. Readers
- 4.3.1. Key market trends, growth factors and opportunities
- 4.3.2. Market size and forecast, by region
- 4.3.3. Market share analysis by country
- 4.4. Controllers
- 4.4.1. Key market trends, growth factors and opportunities
- 4.4.2. Market size and forecast, by region
- 4.4.3. Market share analysis by country
- 4.5. Others
- 4.5.1. Key market trends, growth factors and opportunities
- 4.5.2. Market size and forecast, by region
- 4.5.3. Market share analysis by country
CHAPTER 5: ACCESS CONTROL HARDWARE MARKET, BY INDUSTRY VERTICAL
- 5.1. Overview
- 5.1.1. Market size and forecast
- 5.2. IT and Telecom
- 5.2.1. Key market trends, growth factors and opportunities
- 5.2.2. Market size and forecast, by region
- 5.2.3. Market share analysis by country
- 5.3. BFSI
- 5.3.1. Key market trends, growth factors and opportunities
- 5.3.2. Market size and forecast, by region
- 5.3.3. Market share analysis by country
- 5.4. Defense and Aerospace
- 5.4.1. Key market trends, growth factors and opportunities
- 5.4.2. Market size and forecast, by region
- 5.4.3. Market share analysis by country
- 5.5. Manufacturing
- 5.5.1. Key market trends, growth factors and opportunities
- 5.5.2. Market size and forecast, by region
- 5.5.3. Market share analysis by country
- 5.6. Healthcare
- 5.6.1. Key market trends, growth factors and opportunities
- 5.6.2. Market size and forecast, by region
- 5.6.3. Market share analysis by country
- 5.7. Transportation and Logistics
- 5.7.1. Key market trends, growth factors and opportunities
- 5.7.2. Market size and forecast, by region
- 5.7.3. Market share analysis by country
- 5.8. Government
- 5.8.1. Key market trends, growth factors and opportunities
- 5.8.2. Market size and forecast, by region
- 5.8.3. Market share analysis by country
- 5.9. Others
- 5.9.1. Key market trends, growth factors and opportunities
- 5.9.2. Market size and forecast, by region
- 5.9.3. Market share analysis by country
CHAPTER 6: ACCESS CONTROL HARDWARE MARKET, BY REGION
- 6.1. Overview
- 6.1.1. Market size and forecast By Region
- 6.2. North America
- 6.2.1. Key market trends, growth factors and opportunities
- 6.2.2. Market size and forecast, by Type
- 6.2.3. Market size and forecast, by Industry Vertical
- 6.2.4. Market size and forecast, by country
- 6.2.4.1. U.S.
- 6.2.4.1.1. Market size and forecast, by Type
- 6.2.4.1.2. Market size and forecast, by Industry Vertical
- 6.2.4.2. Canada
- 6.2.4.2.1. Market size and forecast, by Type
- 6.2.4.2.2. Market size and forecast, by Industry Vertical
- 6.2.4.3. Mexico
- 6.2.4.3.1. Market size and forecast, by Type
- 6.2.4.3.2. Market size and forecast, by Industry Vertical
- 6.3. Europe
- 6.3.1. Key market trends, growth factors and opportunities
- 6.3.2. Market size and forecast, by Type
- 6.3.3. Market size and forecast, by Industry Vertical
- 6.3.4. Market size and forecast, by country
- 6.3.4.1. UK
- 6.3.4.1.1. Market size and forecast, by Type
- 6.3.4.1.2. Market size and forecast, by Industry Vertical
- 6.3.4.2. Germany
- 6.3.4.2.1. Market size and forecast, by Type
- 6.3.4.2.2. Market size and forecast, by Industry Vertical
- 6.3.4.3. France
- 6.3.4.3.1. Market size and forecast, by Type
- 6.3.4.3.2. Market size and forecast, by Industry Vertical
- 6.3.4.4. Rest of Europe
- 6.3.4.4.1. Market size and forecast, by Type
- 6.3.4.4.2. Market size and forecast, by Industry Vertical
- 6.4. Asia-Pacific
- 6.4.1. Key market trends, growth factors and opportunities
- 6.4.2. Market size and forecast, by Type
- 6.4.3. Market size and forecast, by Industry Vertical
- 6.4.4. Market size and forecast, by country
- 6.4.4.1. China
- 6.4.4.1.1. Market size and forecast, by Type
- 6.4.4.1.2. Market size and forecast, by Industry Vertical
- 6.4.4.2. Japan
- 6.4.4.2.1. Market size and forecast, by Type
- 6.4.4.2.2. Market size and forecast, by Industry Vertical
- 6.4.4.3. India
- 6.4.4.3.1. Market size and forecast, by Type
- 6.4.4.3.2. Market size and forecast, by Industry Vertical
- 6.4.4.4. South Korea
- 6.4.4.4.1. Market size and forecast, by Type
- 6.4.4.4.2. Market size and forecast, by Industry Vertical
- 6.4.4.5. Rest of Asia-Pacific
- 6.4.4.5.1. Market size and forecast, by Type
- 6.4.4.5.2. Market size and forecast, by Industry Vertical
- 6.5. LAMEA
- 6.5.1. Key market trends, growth factors and opportunities
- 6.5.2. Market size and forecast, by Type
- 6.5.3. Market size and forecast, by Industry Vertical
- 6.5.4. Market size and forecast, by country
- 6.5.4.1. Latin America
- 6.5.4.1.1. Market size and forecast, by Type
- 6.5.4.1.2. Market size and forecast, by Industry Vertical
- 6.5.4.2. Middle East
- 6.5.4.2.1. Market size and forecast, by Type
- 6.5.4.2.2. Market size and forecast, by Industry Vertical
- 6.5.4.3. Africa
- 6.5.4.3.1. Market size and forecast, by Type
- 6.5.4.3.2. Market size and forecast, by Industry Vertical
CHAPTER 7: COMPETITIVE LANDSCAPE
- 7.1. Introduction
- 7.2. Top winning strategies
- 7.3. Product Mapping of Top 10 Player
- 7.4. Competitive Dashboard
- 7.5. Competitive Heatmap
- 7.6. Top player positioning, 2022
CHAPTER 8: COMPANY PROFILES
- 8.1. Bosch Security Systems, LLC.
- 8.1.1. Company overview
- 8.1.2. Key Executives
- 8.1.3. Company snapshot
- 8.1.4. Operating business segments
- 8.1.5. Product portfolio
- 8.1.6. Business performance
- 8.2. Cisco Systems Inc.
- 8.2.1. Company overview
- 8.2.2. Key Executives
- 8.2.3. Company snapshot
- 8.2.4. Operating business segments
- 8.2.5. Product portfolio
- 8.2.6. Business performance
- 8.2.7. Key strategic moves and developments
- 8.3. Hanwha Vision Co., Ltd. (Hanwha Group)
- 8.3.1. Company overview
- 8.3.2. Key Executives
- 8.3.3. Company snapshot
- 8.3.4. Operating business segments
- 8.3.5. Product portfolio
- 8.3.6. Business performance
- 8.3.7. Key strategic moves and developments
- 8.4. Honeywell International Inc.
- 8.4.1. Company overview
- 8.4.2. Key Executives
- 8.4.3. Company snapshot
- 8.4.4. Operating business segments
- 8.4.5. Product portfolio
- 8.4.6. Business performance
- 8.5. Johnson Controls
- 8.5.1. Company overview
- 8.5.2. Key Executives
- 8.5.3. Company snapshot
- 8.5.4. Operating business segments
- 8.5.5. Product portfolio
- 8.5.6. Business performance
- 8.5.7. Key strategic moves and developments
- 8.6. Schneider Electric SE.
- 8.6.1. Company overview
- 8.6.2. Key Executives
- 8.6.3. Company snapshot
- 8.6.4. Operating business segments
- 8.6.5. Product portfolio
- 8.6.6. Business performance
- 8.6.7. Key strategic moves and developments
- 8.7. Siemens AG
- 8.7.1. Company overview
- 8.7.2. Key Executives
- 8.7.3. Company snapshot
- 8.7.4. Operating business segments
- 8.7.5. Product portfolio
- 8.7.6. Business performance
- 8.8. Southco, Inc.
- 8.8.1. Company overview
- 8.8.2. Key Executives
- 8.8.3. Company snapshot
- 8.8.4. Operating business segments
- 8.8.5. Product portfolio
- 8.9. Suprema Inc.
- 8.9.1. Company overview
- 8.9.2. Key Executives
- 8.9.3. Company snapshot
- 8.9.4. Operating business segments
- 8.9.5. Product portfolio
- 8.9.6. Key strategic moves and developments
- 8.10. Thales Group (Gemalto NV)
- 8.10.1. Company overview
- 8.10.2. Key Executives
- 8.10.3. Company snapshot
- 8.10.4. Operating business segments
- 8.10.5. Product portfolio
- 8.10.6. Business performance
- 8.10.7. Key strategic moves and developments