
|
市場調査レポート
商品コード
1365813
リチウム採掘装置市場:採掘タイプ別、プロセスタイプ別、ソリューション別:世界の機会分析と産業予測、2023~2032年Lithium mining equipment Market By Mine type (Lithium brine deposits, Pegmatite lithium deposits, Other), By Process type (Extraction, Processing), By Solution (Sales, Services): Global Opportunity Analysis and Industry Forecast, 2023-2032 |
||||||
|
|||||||

| リチウム採掘装置市場:採掘タイプ別、プロセスタイプ別、ソリューション別:世界の機会分析と産業予測、2023~2032年 |
|
出版日: 2023年08月01日
発行: Allied Market Research
ページ情報: 英文 240 Pages
納期: 2~3営業日
|

- 全表示
- 概要
- 図表
- 目次
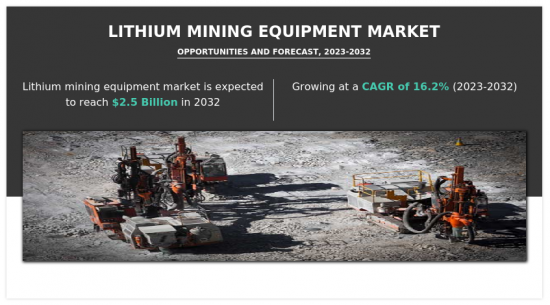
リチウム採掘装置市場は、2020年に3億7,160万米ドルと評価され、2023年から2032年にかけて16.2%のCAGRで成長し、2032年には25億米ドルに達すると推定されます。
世界のエレクトロニクス産業の成長は、リチウム採掘装置市場に大きなプラスの影響を与えています。エレクトロニクス産業はリチウムイオン電池に大きく依存しており、スマートフォンやノートパソコンから電気自動車や再生可能エネルギー貯蔵システムまで、幅広い機器に不可欠な電源となっています。エレクトロニクス産業の拡大に伴い、これらの機器に電力を供給するリチウムイオン電池の需要も増加しています。この電池需要の急増は、リチウム資源に対するニーズの高まりに直結し、リチウム含有鉱物を採掘・加工するためのリチウム採掘装置への投資の増加につながります。例えば、2022年10月、Honda MotorとLG Energy Solution (LGES)は合弁会社を設立し、その提携の一環として、米国オハイオ州で新しいリチウムイオン電池工場が操業を開始する予定で、投資額は44億米ドルと見積もられています。
目次
第1章 イントロダクション
第2章 エグゼクティブサマリー
第3章 市場概要
- 市場の定義と範囲
- 主な調査結果
- 影響要因
- 主な投資機会
- ポーターのファイブフォース分析
- 市場力学
- 促進要因
- エレクトロニクス産業の成長
- リチウムイオン電池の利点
- リチウムの産業用途の増加
- 抑制要因
- リチウム加工コストの高さ
- 採掘装置の初期コストが高い
- 機会
- 電気自動車(EV)需要の増加
- 促進要因
- COVID-19市場への影響分析
第4章 リチウム採掘装置市場:採掘タイプ別
- 概要
- リチウム塩水鉱床
- ペグマタイトリチウム鉱床
- その他
第5章 リチウム採掘装置市場:プロセスタイプ別
- 概要
- 抽出
- 加工
第6章 リチウム採掘装置市場:ソリューション別
- 概要
- 販売
- サービス
第7章 リチウム採掘装置市場:地域別
- 概要
- 北米
- 米国
- カナダ
- メキシコ
- 欧州
- ドイツ
- フランス
- 英国
- ポルトガル
- その他
- アジア太平洋
- 中国
- インド
- 韓国
- オーストラリア
- その他
- ラテンアメリカ
- ラテンアメリカ
- 中東
- アフリカ
第8章 競合情勢
- イントロダクション
- 主要成功戦略
- 主要10社の製品マッピング
- 競合ダッシュボード
- 競合ヒートマップ
- 主要企業のポジショニング、2020年
第9章 企業プロファイル
- Aquatech International LLC
- Caterpillar Inc.
- FEECO International, Inc.
- Koch Separation Solutions
- NOV INC.
- Saltworks Technologies Inc.
- FLSmidth & Co. A/S
- EDDY Pump Corporation
- Samco Technologies, Inc.
- Storage & Transfer Technologies(STT)
LIST OF TABLES
- TABLE 01. GLOBAL LITHIUM MINING EQUIPMENT MARKET, BY MINE TYPE, 2020-2032 ($MILLION)
- TABLE 02. LITHIUM MINING EQUIPMENT MARKET FOR LITHIUM BRINE DEPOSITS, BY REGION, 2020-2032 ($MILLION)
- TABLE 03. LITHIUM MINING EQUIPMENT MARKET FOR PEGMATITE LITHIUM DEPOSITS, BY REGION, 2020-2032 ($MILLION)
- TABLE 04. LITHIUM MINING EQUIPMENT MARKET FOR OTHER, BY REGION, 2020-2032 ($MILLION)
- TABLE 05. GLOBAL LITHIUM MINING EQUIPMENT MARKET, BY PROCESS TYPE, 2020-2032 ($MILLION)
- TABLE 06. LITHIUM MINING EQUIPMENT MARKET FOR EXTRACTION, BY REGION, 2020-2032 ($MILLION)
- TABLE 07. LITHIUM MINING EQUIPMENT MARKET FOR PROCESSING, BY REGION, 2020-2032 ($MILLION)
- TABLE 08. GLOBAL LITHIUM MINING EQUIPMENT MARKET, BY SOLUTION, 2020-2032 ($MILLION)
- TABLE 09. LITHIUM MINING EQUIPMENT MARKET FOR SALES, BY REGION, 2020-2032 ($MILLION)
- TABLE 10. LITHIUM MINING EQUIPMENT MARKET FOR SERVICES, BY REGION, 2020-2032 ($MILLION)
- TABLE 11. LITHIUM MINING EQUIPMENT MARKET, BY REGION, 2020-2032 ($MILLION)
- TABLE 12. NORTH AMERICA LITHIUM MINING EQUIPMENT MARKET, BY MINE TYPE, 2020-2032 ($MILLION)
- TABLE 13. NORTH AMERICA LITHIUM MINING EQUIPMENT MARKET, BY PROCESS TYPE, 2020-2032 ($MILLION)
- TABLE 14. NORTH AMERICA LITHIUM MINING EQUIPMENT MARKET, BY SOLUTION, 2020-2032 ($MILLION)
- TABLE 15. NORTH AMERICA LITHIUM MINING EQUIPMENT MARKET, BY COUNTRY, 2020-2032 ($MILLION)
- TABLE 16. U.S. LITHIUM MINING EQUIPMENT MARKET, BY MINE TYPE, 2020-2032 ($MILLION)
- TABLE 17. U.S. LITHIUM MINING EQUIPMENT MARKET, BY PROCESS TYPE, 2020-2032 ($MILLION)
- TABLE 18. U.S. LITHIUM MINING EQUIPMENT MARKET, BY SOLUTION, 2020-2032 ($MILLION)
- TABLE 19. CANADA LITHIUM MINING EQUIPMENT MARKET, BY MINE TYPE, 2020-2032 ($MILLION)
- TABLE 20. CANADA LITHIUM MINING EQUIPMENT MARKET, BY PROCESS TYPE, 2020-2032 ($MILLION)
- TABLE 21. CANADA LITHIUM MINING EQUIPMENT MARKET, BY SOLUTION, 2020-2032 ($MILLION)
- TABLE 22. MEXICO LITHIUM MINING EQUIPMENT MARKET, BY MINE TYPE, 2020-2032 ($MILLION)
- TABLE 23. MEXICO LITHIUM MINING EQUIPMENT MARKET, BY PROCESS TYPE, 2020-2032 ($MILLION)
- TABLE 24. MEXICO LITHIUM MINING EQUIPMENT MARKET, BY SOLUTION, 2020-2032 ($MILLION)
- TABLE 25. EUROPE LITHIUM MINING EQUIPMENT MARKET, BY MINE TYPE, 2020-2032 ($MILLION)
- TABLE 26. EUROPE LITHIUM MINING EQUIPMENT MARKET, BY PROCESS TYPE, 2020-2032 ($MILLION)
- TABLE 27. EUROPE LITHIUM MINING EQUIPMENT MARKET, BY SOLUTION, 2020-2032 ($MILLION)
- TABLE 28. EUROPE LITHIUM MINING EQUIPMENT MARKET, BY COUNTRY, 2020-2032 ($MILLION)
- TABLE 29. GERMANY LITHIUM MINING EQUIPMENT MARKET, BY MINE TYPE, 2020-2032 ($MILLION)
- TABLE 30. GERMANY LITHIUM MINING EQUIPMENT MARKET, BY PROCESS TYPE, 2020-2032 ($MILLION)
- TABLE 31. GERMANY LITHIUM MINING EQUIPMENT MARKET, BY SOLUTION, 2020-2032 ($MILLION)
- TABLE 32. FRANCE LITHIUM MINING EQUIPMENT MARKET, BY MINE TYPE, 2020-2032 ($MILLION)
- TABLE 33. FRANCE LITHIUM MINING EQUIPMENT MARKET, BY PROCESS TYPE, 2020-2032 ($MILLION)
- TABLE 34. FRANCE LITHIUM MINING EQUIPMENT MARKET, BY SOLUTION, 2020-2032 ($MILLION)
- TABLE 35. UK LITHIUM MINING EQUIPMENT MARKET, BY MINE TYPE, 2020-2032 ($MILLION)
- TABLE 36. UK LITHIUM MINING EQUIPMENT MARKET, BY PROCESS TYPE, 2020-2032 ($MILLION)
- TABLE 37. UK LITHIUM MINING EQUIPMENT MARKET, BY SOLUTION, 2020-2032 ($MILLION)
- TABLE 38. PORTUGAL LITHIUM MINING EQUIPMENT MARKET, BY MINE TYPE, 2020-2032 ($MILLION)
- TABLE 39. PORTUGAL LITHIUM MINING EQUIPMENT MARKET, BY PROCESS TYPE, 2020-2032 ($MILLION)
- TABLE 40. PORTUGAL LITHIUM MINING EQUIPMENT MARKET, BY SOLUTION, 2020-2032 ($MILLION)
- TABLE 41. REST OF EUROPE LITHIUM MINING EQUIPMENT MARKET, BY MINE TYPE, 2020-2032 ($MILLION)
- TABLE 42. REST OF EUROPE LITHIUM MINING EQUIPMENT MARKET, BY PROCESS TYPE, 2020-2032 ($MILLION)
- TABLE 43. REST OF EUROPE LITHIUM MINING EQUIPMENT MARKET, BY SOLUTION, 2020-2032 ($MILLION)
- TABLE 44. ASIA-PACIFIC LITHIUM MINING EQUIPMENT MARKET, BY MINE TYPE, 2020-2032 ($MILLION)
- TABLE 45. ASIA-PACIFIC LITHIUM MINING EQUIPMENT MARKET, BY PROCESS TYPE, 2020-2032 ($MILLION)
- TABLE 46. ASIA-PACIFIC LITHIUM MINING EQUIPMENT MARKET, BY SOLUTION, 2020-2032 ($MILLION)
- TABLE 47. ASIA-PACIFIC LITHIUM MINING EQUIPMENT MARKET, BY COUNTRY, 2020-2032 ($MILLION)
- TABLE 48. CHINA LITHIUM MINING EQUIPMENT MARKET, BY MINE TYPE, 2020-2032 ($MILLION)
- TABLE 49. CHINA LITHIUM MINING EQUIPMENT MARKET, BY PROCESS TYPE, 2020-2032 ($MILLION)
- TABLE 50. CHINA LITHIUM MINING EQUIPMENT MARKET, BY SOLUTION, 2020-2032 ($MILLION)
- TABLE 51. INDIA LITHIUM MINING EQUIPMENT MARKET, BY MINE TYPE, 2020-2032 ($MILLION)
- TABLE 52. INDIA LITHIUM MINING EQUIPMENT MARKET, BY PROCESS TYPE, 2020-2032 ($MILLION)
- TABLE 53. INDIA LITHIUM MINING EQUIPMENT MARKET, BY SOLUTION, 2020-2032 ($MILLION)
- TABLE 54. SOUTH KOREA LITHIUM MINING EQUIPMENT MARKET, BY MINE TYPE, 2020-2032 ($MILLION)
- TABLE 55. SOUTH KOREA LITHIUM MINING EQUIPMENT MARKET, BY PROCESS TYPE, 2020-2032 ($MILLION)
- TABLE 56. SOUTH KOREA LITHIUM MINING EQUIPMENT MARKET, BY SOLUTION, 2020-2032 ($MILLION)
- TABLE 57. AUSTRALIA LITHIUM MINING EQUIPMENT MARKET, BY MINE TYPE, 2020-2032 ($MILLION)
- TABLE 58. AUSTRALIA LITHIUM MINING EQUIPMENT MARKET, BY PROCESS TYPE, 2020-2032 ($MILLION)
- TABLE 59. AUSTRALIA LITHIUM MINING EQUIPMENT MARKET, BY SOLUTION, 2020-2032 ($MILLION)
- TABLE 60. REST OF ASIA-PACIFIC LITHIUM MINING EQUIPMENT MARKET, BY MINE TYPE, 2020-2032 ($MILLION)
- TABLE 61. REST OF ASIA-PACIFIC LITHIUM MINING EQUIPMENT MARKET, BY PROCESS TYPE, 2020-2032 ($MILLION)
- TABLE 62. REST OF ASIA-PACIFIC LITHIUM MINING EQUIPMENT MARKET, BY SOLUTION, 2020-2032 ($MILLION)
- TABLE 63. LAMEA LITHIUM MINING EQUIPMENT MARKET, BY MINE TYPE, 2020-2032 ($MILLION)
- TABLE 64. LAMEA LITHIUM MINING EQUIPMENT MARKET, BY PROCESS TYPE, 2020-2032 ($MILLION)
- TABLE 65. LAMEA LITHIUM MINING EQUIPMENT MARKET, BY SOLUTION, 2020-2032 ($MILLION)
- TABLE 66. LAMEA LITHIUM MINING EQUIPMENT MARKET, BY COUNTRY, 2020-2032 ($MILLION)
- TABLE 67. LATIN AMERICA LITHIUM MINING EQUIPMENT MARKET, BY MINE TYPE, 2020-2032 ($MILLION)
- TABLE 68. LATIN AMERICA LITHIUM MINING EQUIPMENT MARKET, BY PROCESS TYPE, 2020-2032 ($MILLION)
- TABLE 69. LATIN AMERICA LITHIUM MINING EQUIPMENT MARKET, BY SOLUTION, 2020-2032 ($MILLION)
- TABLE 70. MIDDLE EAST LITHIUM MINING EQUIPMENT MARKET, BY MINE TYPE, 2020-2032 ($MILLION)
- TABLE 71. MIDDLE EAST LITHIUM MINING EQUIPMENT MARKET, BY PROCESS TYPE, 2020-2032 ($MILLION)
- TABLE 72. MIDDLE EAST LITHIUM MINING EQUIPMENT MARKET, BY SOLUTION, 2020-2032 ($MILLION)
- TABLE 73. AFRICA LITHIUM MINING EQUIPMENT MARKET, BY MINE TYPE, 2020-2032 ($MILLION)
- TABLE 74. AFRICA LITHIUM MINING EQUIPMENT MARKET, BY PROCESS TYPE, 2020-2032 ($MILLION)
- TABLE 75. AFRICA LITHIUM MINING EQUIPMENT MARKET, BY SOLUTION, 2020-2032 ($MILLION)
- TABLE 76. AQUATECH INTERNATIONAL LLC: KEY EXECUTIVES
- TABLE 77. AQUATECH INTERNATIONAL LLC: COMPANY SNAPSHOT
- TABLE 78. AQUATECH INTERNATIONAL LLC: SERVICE SEGMENTS
- TABLE 79. AQUATECH INTERNATIONAL LLC: PRODUCT PORTFOLIO
- TABLE 80. AQUATECH INTERNATIONAL LLC: KEY STRATERGIES
- TABLE 81. CATERPILLAR INC.: KEY EXECUTIVES
- TABLE 82. CATERPILLAR INC.: COMPANY SNAPSHOT
- TABLE 83. CATERPILLAR INC.: PRODUCT SEGMENTS
- TABLE 84. CATERPILLAR INC.: PRODUCT PORTFOLIO
- TABLE 85. FEECO INTERNATIONAL, INC.: KEY EXECUTIVES
- TABLE 86. FEECO INTERNATIONAL, INC.: COMPANY SNAPSHOT
- TABLE 87. FEECO INTERNATIONAL, INC.: PRODUCT SEGMENTS
- TABLE 88. FEECO INTERNATIONAL, INC.: PRODUCT PORTFOLIO
- TABLE 89. KOCH SEPARATION SOLUTIONS: KEY EXECUTIVES
- TABLE 90. KOCH SEPARATION SOLUTIONS: COMPANY SNAPSHOT
- TABLE 91. KOCH SEPARATION SOLUTIONS: PRODUCT SEGMENTS
- TABLE 92. KOCH SEPARATION SOLUTIONS: PRODUCT PORTFOLIO
- TABLE 93. KOCH SEPARATION SOLUTIONS: KEY STRATERGIES
- TABLE 94. NOV INC.: KEY EXECUTIVES
- TABLE 95. NOV INC.: COMPANY SNAPSHOT
- TABLE 96. NOV INC.: PRODUCT SEGMENTS
- TABLE 97. NOV INC.: PRODUCT PORTFOLIO
- TABLE 98. SALTWORKS TECHNOLOGIES INC.: KEY EXECUTIVES
- TABLE 99. SALTWORKS TECHNOLOGIES INC.: COMPANY SNAPSHOT
- TABLE 100. SALTWORKS TECHNOLOGIES INC.: PRODUCT SEGMENTS
- TABLE 101. SALTWORKS TECHNOLOGIES INC.: PRODUCT PORTFOLIO
- TABLE 102. FLSMIDTH & CO. A/S: KEY EXECUTIVES
- TABLE 103. FLSMIDTH & CO. A/S: COMPANY SNAPSHOT
- TABLE 104. FLSMIDTH & CO. A/S: PRODUCT SEGMENTS
- TABLE 105. FLSMIDTH & CO. A/S: PRODUCT PORTFOLIO
- TABLE 106. EDDY PUMP CORPORATION: KEY EXECUTIVES
- TABLE 107. EDDY PUMP CORPORATION: COMPANY SNAPSHOT
- TABLE 108. EDDY PUMP CORPORATION: PRODUCT SEGMENTS
- TABLE 109. EDDY PUMP CORPORATION: PRODUCT PORTFOLIO
- TABLE 110. SAMCO TECHNOLOGIES, INC.: KEY EXECUTIVES
- TABLE 111. SAMCO TECHNOLOGIES, INC.: COMPANY SNAPSHOT
- TABLE 112. SAMCO TECHNOLOGIES, INC.: PRODUCT SEGMENTS
- TABLE 113. SAMCO TECHNOLOGIES, INC.: PRODUCT PORTFOLIO
- TABLE 114. STORAGE & TRANSFER TECHNOLOGIES (STT): KEY EXECUTIVES
- TABLE 115. STORAGE & TRANSFER TECHNOLOGIES (STT): COMPANY SNAPSHOT
- TABLE 116. STORAGE & TRANSFER TECHNOLOGIES (STT): PRODUCT SEGMENTS
- TABLE 117. STORAGE & TRANSFER TECHNOLOGIES (STT): PRODUCT PORTFOLIO
LIST OF FIGURES
- FIGURE 01. LITHIUM MINING EQUIPMENT MARKET, 2020-2032
- FIGURE 02. SEGMENTATION OF LITHIUM MINING EQUIPMENT MARKET,2020-2032
- FIGURE 03. TOP INVESTMENT POCKETS IN LITHIUM MINING EQUIPMENT MARKET (2023-2032)
- FIGURE 04. LOW BARGAINING POWER OF SUPPLIERS
- FIGURE 05. LOW THREAT OF NEW ENTRANTS
- FIGURE 06. LOW THREAT OF SUBSTITUTES
- FIGURE 07. LOW INTENSITY OF RIVALRY
- FIGURE 08. LOW BARGAINING POWER OF BUYERS
- FIGURE 09. GLOBAL LITHIUM MINING EQUIPMENT MARKET:DRIVERS, RESTRAINTS AND OPPORTUNITIES
- FIGURE 10. LITHIUM MINING EQUIPMENT MARKET, BY MINE TYPE, 2020(%)
- FIGURE 11. COMPARATIVE SHARE ANALYSIS OF LITHIUM MINING EQUIPMENT MARKET FOR LITHIUM BRINE DEPOSITS, BY COUNTRY 2020 AND 2032(%)
- FIGURE 12. COMPARATIVE SHARE ANALYSIS OF LITHIUM MINING EQUIPMENT MARKET FOR PEGMATITE LITHIUM DEPOSITS, BY COUNTRY 2020 AND 2032(%)
- FIGURE 13. COMPARATIVE SHARE ANALYSIS OF LITHIUM MINING EQUIPMENT MARKET FOR OTHER, BY COUNTRY 2020 AND 2032(%)
- FIGURE 14. LITHIUM MINING EQUIPMENT MARKET, BY PROCESS TYPE, 2020(%)
- FIGURE 15. COMPARATIVE SHARE ANALYSIS OF LITHIUM MINING EQUIPMENT MARKET FOR EXTRACTION, BY COUNTRY 2020 AND 2032(%)
- FIGURE 16. COMPARATIVE SHARE ANALYSIS OF LITHIUM MINING EQUIPMENT MARKET FOR PROCESSING, BY COUNTRY 2020 AND 2032(%)
- FIGURE 17. LITHIUM MINING EQUIPMENT MARKET, BY SOLUTION, 2020(%)
- FIGURE 18. COMPARATIVE SHARE ANALYSIS OF LITHIUM MINING EQUIPMENT MARKET FOR SALES, BY COUNTRY 2020 AND 2032(%)
- FIGURE 19. COMPARATIVE SHARE ANALYSIS OF LITHIUM MINING EQUIPMENT MARKET FOR SERVICES, BY COUNTRY 2020 AND 2032(%)
- FIGURE 20. LITHIUM MINING EQUIPMENT MARKET BY REGION, 2020(%)
- FIGURE 21. U.S. LITHIUM MINING EQUIPMENT MARKET, 2020-2032 ($MILLION)
- FIGURE 22. CANADA LITHIUM MINING EQUIPMENT MARKET, 2020-2032 ($MILLION)
- FIGURE 23. MEXICO LITHIUM MINING EQUIPMENT MARKET, 2020-2032 ($MILLION)
- FIGURE 24. GERMANY LITHIUM MINING EQUIPMENT MARKET, 2020-2032 ($MILLION)
- FIGURE 25. FRANCE LITHIUM MINING EQUIPMENT MARKET, 2020-2032 ($MILLION)
- FIGURE 26. UK LITHIUM MINING EQUIPMENT MARKET, 2020-2032 ($MILLION)
- FIGURE 27. PORTUGAL LITHIUM MINING EQUIPMENT MARKET, 2020-2032 ($MILLION)
- FIGURE 28. REST OF EUROPE LITHIUM MINING EQUIPMENT MARKET, 2020-2032 ($MILLION)
- FIGURE 29. CHINA LITHIUM MINING EQUIPMENT MARKET, 2020-2032 ($MILLION)
- FIGURE 30. INDIA LITHIUM MINING EQUIPMENT MARKET, 2020-2032 ($MILLION)
- FIGURE 31. SOUTH KOREA LITHIUM MINING EQUIPMENT MARKET, 2020-2032 ($MILLION)
- FIGURE 32. AUSTRALIA LITHIUM MINING EQUIPMENT MARKET, 2020-2032 ($MILLION)
- FIGURE 33. REST OF ASIA-PACIFIC LITHIUM MINING EQUIPMENT MARKET, 2020-2032 ($MILLION)
- FIGURE 34. LATIN AMERICA LITHIUM MINING EQUIPMENT MARKET, 2020-2032 ($MILLION)
- FIGURE 35. MIDDLE EAST LITHIUM MINING EQUIPMENT MARKET, 2020-2032 ($MILLION)
- FIGURE 36. AFRICA LITHIUM MINING EQUIPMENT MARKET, 2020-2032 ($MILLION)
- FIGURE 37. TOP WINNING STRATEGIES, BY YEAR (2022-2023)
- FIGURE 38. TOP WINNING STRATEGIES, BY DEVELOPMENT (2022-2023)
- FIGURE 39. TOP WINNING STRATEGIES, BY COMPANY (2022-2023)
- FIGURE 40. PRODUCT MAPPING OF TOP 10 PLAYERS
- FIGURE 41. COMPETITIVE DASHBOARD
- FIGURE 42. COMPETITIVE HEATMAP: LITHIUM MINING EQUIPMENT MARKET
- FIGURE 43. TOP PLAYER POSITIONING, 2020
- FIGURE 44. CATERPILLAR INC.: NET REVENUE, 2020-2022 ($MILLION)
- FIGURE 45. CATERPILLAR INC.: RESEARCH & DEVELOPMENT EXPENDITURE, 2020-2022 ($MILLION)
- FIGURE 46. CATERPILLAR INC.: REVENUE SHARE BY SEGMENT, 2022 (%)
- FIGURE 47. CATERPILLAR INC.: REVENUE SHARE BY REGION, 2022 (%)
- FIGURE 48. NOV INC.: NET REVENUE, 2020-2022 ($MILLION)
- FIGURE 49. NOV INC.: REVENUE SHARE BY SEGMENT, 2022 (%)
- FIGURE 50. NOV INC.: REVENUE SHARE BY REGION, 2022 (%)
- FIGURE 51. FLSMIDTH & CO. A/S: NET SALES, 2020-2022 ($MILLION)
- FIGURE 52. FLSMIDTH & CO. A/S: REVENUE SHARE BY SEGMENT, 2022 (%)
- FIGURE 53. FLSMIDTH & CO. A/S: REVENUE SHARE BY REGION, 2021 (%)
According to a new report published by Allied Market Research, titled, "Lithium mining equipment Market," The lithium mining equipment market was valued at $371.60 million in 2020, and is estimated to reach $2.5 billion by 2032, growing at a CAGR of 16.2% from 2023 to 2032.
The growth of the electronics industry worldwide has a significant positive impact on the lithium mining equipment market. The electronics industry relies heavily on lithium-ion batteries, which are essential power sources for a wide range of devices, from smartphones and laptops to electric vehicles and renewable energy storage systems. As the electronics industry expands, there is a corresponding increase in the demand for lithium-ion batteries to power these devices. This surge in battery demand directly translates to a higher need for lithium resources, leading to increased investments in lithium mining equipment to extract and process lithium-bearing minerals. For instance, in October 2022, Honda Motor and LG Energy Solution (LGES) had a joint venture, and as part of that collaboration, a new lithium-ion battery factory is expected to begin operation in Ohio, the U.S., with an estimated $4.4 billion in investment.
In addition, various countries have implemented policies and incentives to promote the adoption of electric vehicles, renewable energy, and clean technologies. These policies create a supportive environment for industries dependent on lithium resources, contributing to the growth of the lithium equipment market. However, lithium mining has a significant environmental impact, such as habitat disruption, water pollution, and greenhouse gas emissions. Contrarily, advancements in mining technologies and equipment lead to increased efficiency, reduced environmental impact, and improved safety. Ongoing R&D efforts in the mining sector drive the adoption of innovative equipment and processes, further fueling market growth.
Furthermore, due to the rise in inflation mainly driven by the Ukraine-Russia war, the fluctuating market demand, as well as the lithium prices have historically been subject to volatility due to factors such as supply-demand imbalances, changes in battery technology, and global economic conditions. This has led to slow-paced growth of the lithium mining equipment market and its related industries.
The lithium mining equipment market is segmented on the basis of mine type, process type, solutions, and region. By mine type, the market is bifurcated into lithium brine deposits, pegmatite lithium deposits, and others. Furthermore, the process type segment is further categorized into extraction and processing. Depending upon the solution, the market is categorized into sales and services. Region-wise, it is analyzed across North America (U.S., Canada, and Mexico), Europe (Germany, France, Portugal, UK, and rest of Europe), Asia-Pacific (China, India, Australia, South Korea, and rest of Asia-Pacific), and LAMEA (Latin America, Middle East, and Africa).
Competitive analysis and profiles of the major players in the lithium mining equipment market are provided in the report. Major companies in the report include Aquatech International LLC, Caterpillar Inc., EDDY Pump Corporation, FEECO International, Inc., FLSmidth & Co. A/S, Koch Separation Solutions, NOV INC., Saltworks Technologies Inc., Samco Technologies, Inc., and Storage & Transfer Technologies (STT).
Key Benefits For Stakeholders
- This report provides a quantitative analysis of the market segments, current trends, estimations, and dynamics of the lithium mining equipment market analysis from 2020 to 2032 to identify the prevailing lithium mining equipment market opportunities.
- The market research is offered along with information related to key drivers, restraints, and opportunities.
- Porter's five forces analysis highlights the potency of buyers and suppliers to enable stakeholders make profit-oriented business decisions and strengthen their supplier-buyer network.
- In-depth analysis of the lithium mining equipment market segmentation assists to determine the prevailing market opportunities.
- Major countries in each region are mapped according to their revenue contribution to the global market.
- Market player positioning facilitates benchmarking and provides a clear understanding of the present position of the market players.
- The report includes the analysis of the regional as well as global lithium mining equipment market trends, key players, market segments, application areas, and market growth strategies.
Additional benefits you will get with this purchase are:
- Quarterly Update and* (only available with a corporate license, on listed price)
- 5 additional Company Profile of client Choice pre- or Post-purchase, as a free update.
- Free Upcoming Version on the Purchase of Five and Enterprise User License.
- 16 analyst hours of support* (post-purchase, if you find additional data requirements upon review of the report, you may receive support amounting to 16 analyst hours to solve questions, and post-sale queries)
- 15% Free Customization* (in case the scope or segment of the report does not match your requirements, 20% is equivalent to 3 working days of free work, applicable once)
- Free data Pack on the Five and Enterprise User License. (Excel version of the report)
- Free Updated report if the report is 6-12 months old or older.
- 24-hour priority response*
- Free Industry updates and white papers.
Possible Customization with this report (with additional cost and timeline talk to the sales executive to know more)
- Analysis of raw material in a product (by %)
- Manufacturing Capacity
- End user preferences and pain points
- Industry life cycle assessment, by region
- Product Benchmarking / Product specification and applications
- Senario Analysis & Growth Trend Comparision
- Technology Trend Analysis
- Distributor margin Analysis
- Market share analysis of players by products/segments
- New Product Development/ Product Matrix of Key Players
- Pain Point Analysis
- Strategic Recommedations
- Additional company profiles with specific to client's interest
- Additional country or region analysis- market size and forecast
- Average Selling Price Analysis / Price Point Analysis
- Brands Share Analysis
- Criss-cross segment analysis- market size and forecast
- Expanded list for Company Profiles
- Historic market data
- Import Export Analysis/Data
- Key player details (including location, contact details, supplier/vendor network etc. in excel format)
- Market share analysis of players at global/region/country level
- SWOT Analysis
- Volume Market Size and Forecast
Key Market Segments
By Mine type
- Lithium brine deposits
- Pegmatite lithium deposits
- Other
By Process type
- Extraction
- Processing
By Solution
- Sales
- Services
By Region
- North America
- U.S.
- Canada
- Mexico
- Europe
- Germany
- France
- UK
- Portugal
- Rest of Europe
- Asia-Pacific
- China
- India
- South Korea
- Australia
- Rest of Asia-Pacific
- LAMEA
- Latin America
- Middle East
- Africa
Key Market Players:
- Caterpillar Inc.
- Koch Separation Solutions
- NOV INC.
- Storage & Transfer Technologies (STT)
- EDDY Pump Corporation
- FEECO International, Inc.
- Samco Technologies, Inc.
- Saltworks Technologies Inc.
- FLSmidth & Co. A/S
- Aquatech International LLC
TABLE OF CONTENTS
CHAPTER 1: INTRODUCTION
- 1.1. Report description
- 1.2. Key market segments
- 1.3. Key benefits to the stakeholders
- 1.4. Research Methodology
- 1.4.1. Primary research
- 1.4.2. Secondary research
- 1.4.3. Analyst tools and models
CHAPTER 2: EXECUTIVE SUMMARY
- 2.1. CXO Perspective
CHAPTER 3: MARKET OVERVIEW
- 3.1. Market definition and scope
- 3.2. Key findings
- 3.2.1. Top impacting factors
- 3.2.2. Top investment pockets
- 3.3. Porter's five forces analysis
- 3.3.1. Low bargaining power of suppliers
- 3.3.2. Low threat of new entrants
- 3.3.3. Low threat of substitutes
- 3.3.4. Low intensity of rivalry
- 3.3.5. Low bargaining power of buyers
- 3.4. Market dynamics
- 3.4.1. Drivers
- 3.4.1.1. Growth of the electronics industry
- 3.4.1.2. Advantages of lithium-ion batteries
- 3.4.1.3. Increasing industrial applications of lithium
- 3.4.1. Drivers
- 3.4.2. Restraints
- 3.4.2.1. High cost of lithium processing
- 3.4.2.2. High initial cost of mining equipment
- 3.4.3. Opportunities
- 3.4.3.1. Rise in demand for electric vehicles (EVs)
- 3.5. COVID-19 Impact Analysis on the market
CHAPTER 4: LITHIUM MINING EQUIPMENT MARKET, BY MINE TYPE
- 4.1. Overview
- 4.1.1. Market size and forecast
- 4.2. Lithium brine deposits
- 4.2.1. Key market trends, growth factors and opportunities
- 4.2.2. Market size and forecast, by region
- 4.2.3. Market share analysis by country
- 4.3. Pegmatite lithium deposits
- 4.3.1. Key market trends, growth factors and opportunities
- 4.3.2. Market size and forecast, by region
- 4.3.3. Market share analysis by country
- 4.4. Other
- 4.4.1. Key market trends, growth factors and opportunities
- 4.4.2. Market size and forecast, by region
- 4.4.3. Market share analysis by country
CHAPTER 5: LITHIUM MINING EQUIPMENT MARKET, BY PROCESS TYPE
- 5.1. Overview
- 5.1.1. Market size and forecast
- 5.2. Extraction
- 5.2.1. Key market trends, growth factors and opportunities
- 5.2.2. Market size and forecast, by region
- 5.2.3. Market share analysis by country
- 5.3. Processing
- 5.3.1. Key market trends, growth factors and opportunities
- 5.3.2. Market size and forecast, by region
- 5.3.3. Market share analysis by country
CHAPTER 6: LITHIUM MINING EQUIPMENT MARKET, BY SOLUTION
- 6.1. Overview
- 6.1.1. Market size and forecast
- 6.2. Sales
- 6.2.1. Key market trends, growth factors and opportunities
- 6.2.2. Market size and forecast, by region
- 6.2.3. Market share analysis by country
- 6.3. Services
- 6.3.1. Key market trends, growth factors and opportunities
- 6.3.2. Market size and forecast, by region
- 6.3.3. Market share analysis by country
CHAPTER 7: LITHIUM MINING EQUIPMENT MARKET, BY REGION
- 7.1. Overview
- 7.1.1. Market size and forecast By Region
- 7.2. North America
- 7.2.1. Key market trends, growth factors and opportunities
- 7.2.2. Market size and forecast, by Mine type
- 7.2.3. Market size and forecast, by Process type
- 7.2.4. Market size and forecast, by Solution
- 7.2.5. Market size and forecast, by country
- 7.2.5.1. U.S.
- 7.2.5.1.1. Market size and forecast, by Mine type
- 7.2.5.1.2. Market size and forecast, by Process type
- 7.2.5.1.3. Market size and forecast, by Solution
- 7.2.5.2. Canada
- 7.2.5.2.1. Market size and forecast, by Mine type
- 7.2.5.2.2. Market size and forecast, by Process type
- 7.2.5.2.3. Market size and forecast, by Solution
- 7.2.5.3. Mexico
- 7.2.5.3.1. Market size and forecast, by Mine type
- 7.2.5.3.2. Market size and forecast, by Process type
- 7.2.5.3.3. Market size and forecast, by Solution
- 7.3. Europe
- 7.3.1. Key market trends, growth factors and opportunities
- 7.3.2. Market size and forecast, by Mine type
- 7.3.3. Market size and forecast, by Process type
- 7.3.4. Market size and forecast, by Solution
- 7.3.5. Market size and forecast, by country
- 7.3.5.1. Germany
- 7.3.5.1.1. Market size and forecast, by Mine type
- 7.3.5.1.2. Market size and forecast, by Process type
- 7.3.5.1.3. Market size and forecast, by Solution
- 7.3.5.2. France
- 7.3.5.2.1. Market size and forecast, by Mine type
- 7.3.5.2.2. Market size and forecast, by Process type
- 7.3.5.2.3. Market size and forecast, by Solution
- 7.3.5.3. UK
- 7.3.5.3.1. Market size and forecast, by Mine type
- 7.3.5.3.2. Market size and forecast, by Process type
- 7.3.5.3.3. Market size and forecast, by Solution
- 7.3.5.4. Portugal
- 7.3.5.4.1. Market size and forecast, by Mine type
- 7.3.5.4.2. Market size and forecast, by Process type
- 7.3.5.4.3. Market size and forecast, by Solution
- 7.3.5.5. Rest of Europe
- 7.3.5.5.1. Market size and forecast, by Mine type
- 7.3.5.5.2. Market size and forecast, by Process type
- 7.3.5.5.3. Market size and forecast, by Solution
- 7.4. Asia-Pacific
- 7.4.1. Key market trends, growth factors and opportunities
- 7.4.2. Market size and forecast, by Mine type
- 7.4.3. Market size and forecast, by Process type
- 7.4.4. Market size and forecast, by Solution
- 7.4.5. Market size and forecast, by country
- 7.4.5.1. China
- 7.4.5.1.1. Market size and forecast, by Mine type
- 7.4.5.1.2. Market size and forecast, by Process type
- 7.4.5.1.3. Market size and forecast, by Solution
- 7.4.5.2. India
- 7.4.5.2.1. Market size and forecast, by Mine type
- 7.4.5.2.2. Market size and forecast, by Process type
- 7.4.5.2.3. Market size and forecast, by Solution
- 7.4.5.3. South Korea
- 7.4.5.3.1. Market size and forecast, by Mine type
- 7.4.5.3.2. Market size and forecast, by Process type
- 7.4.5.3.3. Market size and forecast, by Solution
- 7.4.5.4. Australia
- 7.4.5.4.1. Market size and forecast, by Mine type
- 7.4.5.4.2. Market size and forecast, by Process type
- 7.4.5.4.3. Market size and forecast, by Solution
- 7.4.5.5. Rest of Asia-Pacific
- 7.4.5.5.1. Market size and forecast, by Mine type
- 7.4.5.5.2. Market size and forecast, by Process type
- 7.4.5.5.3. Market size and forecast, by Solution
- 7.5. LAMEA
- 7.5.1. Key market trends, growth factors and opportunities
- 7.5.2. Market size and forecast, by Mine type
- 7.5.3. Market size and forecast, by Process type
- 7.5.4. Market size and forecast, by Solution
- 7.5.5. Market size and forecast, by country
- 7.5.5.1. Latin America
- 7.5.5.1.1. Market size and forecast, by Mine type
- 7.5.5.1.2. Market size and forecast, by Process type
- 7.5.5.1.3. Market size and forecast, by Solution
- 7.5.5.2. Middle East
- 7.5.5.2.1. Market size and forecast, by Mine type
- 7.5.5.2.2. Market size and forecast, by Process type
- 7.5.5.2.3. Market size and forecast, by Solution
- 7.5.5.3. Africa
- 7.5.5.3.1. Market size and forecast, by Mine type
- 7.5.5.3.2. Market size and forecast, by Process type
- 7.5.5.3.3. Market size and forecast, by Solution
CHAPTER 8: COMPETITIVE LANDSCAPE
- 8.1. Introduction
- 8.2. Top winning strategies
- 8.3. Product Mapping of Top 10 Player
- 8.4. Competitive Dashboard
- 8.5. Competitive Heatmap
- 8.6. Top player positioning, 2020
CHAPTER 9: COMPANY PROFILES
- 9.1. Aquatech International LLC
- 9.1.1. Company overview
- 9.1.2. Key Executives
- 9.1.3. Company snapshot
- 9.1.4. Operating business segments
- 9.1.5. Product portfolio
- 9.1.6. Key strategic moves and developments
- 9.2. Caterpillar Inc.
- 9.2.1. Company overview
- 9.2.2. Key Executives
- 9.2.3. Company snapshot
- 9.2.4. Operating business segments
- 9.2.5. Product portfolio
- 9.2.6. Business performance
- 9.3. FEECO International, Inc.
- 9.3.1. Company overview
- 9.3.2. Key Executives
- 9.3.3. Company snapshot
- 9.3.4. Operating business segments
- 9.3.5. Product portfolio
- 9.4. Koch Separation Solutions
- 9.4.1. Company overview
- 9.4.2. Key Executives
- 9.4.3. Company snapshot
- 9.4.4. Operating business segments
- 9.4.5. Product portfolio
- 9.4.6. Key strategic moves and developments
- 9.5. NOV INC.
- 9.5.1. Company overview
- 9.5.2. Key Executives
- 9.5.3. Company snapshot
- 9.5.4. Operating business segments
- 9.5.5. Product portfolio
- 9.5.6. Business performance
- 9.6. Saltworks Technologies Inc.
- 9.6.1. Company overview
- 9.6.2. Key Executives
- 9.6.3. Company snapshot
- 9.6.4. Operating business segments
- 9.6.5. Product portfolio
- 9.7. FLSmidth & Co. A/S
- 9.7.1. Company overview
- 9.7.2. Key Executives
- 9.7.3. Company snapshot
- 9.7.4. Operating business segments
- 9.7.5. Product portfolio
- 9.7.6. Business performance
- 9.8. EDDY Pump Corporation
- 9.8.1. Company overview
- 9.8.2. Key Executives
- 9.8.3. Company snapshot
- 9.8.4. Operating business segments
- 9.8.5. Product portfolio
- 9.9. Samco Technologies, Inc.
- 9.9.1. Company overview
- 9.9.2. Key Executives
- 9.9.3. Company snapshot
- 9.9.4. Operating business segments
- 9.9.5. Product portfolio
- 9.10. Storage & Transfer Technologies (STT)
- 9.10.1. Company overview
- 9.10.2. Key Executives
- 9.10.3. Company snapshot
- 9.10.4. Operating business segments
- 9.10.5. Product portfolio
