|
|
市場調査レポート
商品コード
1365749
動物モデル市場:動物タイプ別、用途別、エンドユーザー別:世界の機会分析と産業予測、2023~2032年Animal Model Market By Animal Type, By Application, By End User : Global Opportunity Analysis and Industry Forecast, 2023-2032 |
||||||
|
|
|||||||
|
|||||||


| 動物モデル市場:動物タイプ別、用途別、エンドユーザー別:世界の機会分析と産業予測、2023~2032年 |
|
出版日: 2023年08月01日
発行: Allied Market Research
ページ情報: 英文 295 Pages
納期: 2~3営業日
|

- 全表示
- 概要
- 図表
- 目次
動物モデル市場は2022年に19億米ドルと評価され、2023年から2032年にかけてCAGR 6.6%で成長し、2032年には36億米ドルに達すると推定されています。

ワクチンは、感染症の予防と制御に最も効果的で経済的なツールです。SARS-CoV-2の急速な拡大、臨床例間のばらつき、転帰、高い死亡率のため、世界保健機関(WHO)が2020年1月にCOVID-19を国際的に懸念される公衆衛生上の緊急事態とし、2020年3月にパンデミックと宣言すると、薬理学的治療法とワクチンの開発競争が始まっています。COVID-19のワクチン開発においては、研究を迅速に進め、結果としてワクチンの登録と入手を可能にするために、信頼性が高く、十分に特性化された実験モデルの使用と選択が重要でした。国立医薬品図書館による2021年の報告によると、COVID-19の研究に関与した動物モデルには、マウス、ゴールデンハムスター、フェレット、霊長類以外の動物、ブタが含まれます。302種類以上のワクチンが開発中で、そのうち117種類が臨床試験に成功しています。このように、感染症ワクチンの市場開拓における動物モデルの使用増加は、市場の成長に大きく貢献すると予想されます。
CRISPR(clustered regularly interspaced short palindromic repeats)技術の採用増加は、動物モデル市場の主要な促進要因として浮上しています。CRISPR技術は、科学者が動物を含む様々な生物のDNAに標的を定めた改変を加えることを可能にすることで、正確かつ効率的なゲノム編集を可能にします。この画期的な遺伝子編集ツールは、遺伝学と生物医学研究の分野を大きく発展させ、動物モデルの作成に数多くの応用を提供しています。さらに、CRISPR技術によって作製された動物モデルは、新薬の発見において極めて重要です。この技術は、ヒト化された免疫系を反映するようにDNAが改変された、高度にカスタマイズされたマウスやラットを作製するもので、研究において精密なモデル化を可能にするだけでなく、標的の検証や有効性の評価も可能にします。この技術が使用される以前は、実験動物の作製に最大18ヵ月を要していたが、現在では創始動物の作製にかかる時間は3分の1から2分の1であり、他の前臨床動物モデルよりも費用対効果が高くなっています。このように、CRISPRの普及とマウスモデルを用いた研究の増加は、市場の成長を促進すると予想されます。例えば、米国の医療・健康研究開発投資は、2020年に11.1%増の2,451億米ドルに達しました。医薬品開発プロセスでマウスモデルを効果的に使用するための研究活動の増加が、市場の成長を促進すると予想されます。しかし、研究における動物の使用に関する倫理的ガイドラインが動物モデル市場の成長を抑制すると予想されます。
世界の動物モデル市場は、動物の種類、用途、エンドユーザー、地域に区分されます。動物タイプ別では、ラット、マウス、モルモット、ウサギ、その他に分類されます。その他には、ゼブラフィッシュ、両生類・爬虫類、ハムスター、チンチラ、スナネズミ、アルマジロなどが含まれます。用途別では、創薬・研究開発、基礎研究、その他に分けられます。その他には、医療機器開発、生産・品質管理などが含まれます。エンドユーザー別では、製薬・バイオ企業、学術研究機関、その他に分類されます。その他には、医療機器企業、CRO(医薬品開発業務受託機関)、製造受託機関などが含まれます。地域別では、市場は北米、欧州、アジア太平洋、ラテンアメリカ・中東・アフリカで分析されます。
目次
第1章 イントロダクション
第2章 エグゼクティブサマリー
第3章 市場概要
- 市場の定義と範囲
- 主な調査結果
- 影響要因
- 主な投資機会
- ポーターのファイブフォース分析
- 市場力学
- 促進要因
- ウイルス学および感染症における動物モデルの使用増加
- 薬物試験におけるヒトと動物の生理学的類似性
- CRISPR技術の採用増加
- 抑制要因
- 代替検査法の利用可能性
- 機会
- 新興市場における成長機会
- 促進要因
第4章 動物モデル市場:動物タイプ別
- 概要
- ラット
- マウス
- モルモット
- ウサギ
- その他
第5章 動物モデル市場:用途別
- 概要
- 創薬・研究開発
- 基礎研究
- その他
第6章 動物モデル市場:エンドユーザー別
- 概要
- 製薬・バイオ企業
- 学術研究機関
- その他
第7章 動物モデル市場:地域別
- 概要
- 北米
- 米国
- カナダ
- メキシコ
- 欧州
- ドイツ
- フランス
- 英国
- イタリア
- スペイン
- その他
- アジア太平洋
- 日本
- 中国
- オーストラリア
- インド
- 韓国
- その他
- ラテンアメリカ・中東・アフリカ
- ブラジル
- サウジアラビア
- 南アフリカ
- その他
第8章 競争情勢
- イントロダクション
- 主要成功戦略
- 主要10企業の製品マッピング
- 競合ダッシュボード
- 競合ヒートマップ
- 主要企業のポジショニング、2022年
第9章 企業プロファイル
- Charles River Laboratories
- Inotiv, Inc.
- Genoway S.A.
- Hera Biolabs
- Crown Bioscience Inc.
- Ozgene Pty Ltd.
- Taconic Biosciences
- The Jackson Laboratory.
- Trans Genic Inc.
- Janvier Labs, LLC
LIST OF TABLES
- TABLE 01. GLOBAL ANIMAL MODEL MARKET, BY ANIMAL TYPE, 2022-2032 ($MILLION)
- TABLE 02. ANIMAL MODEL MARKET FOR RAT, BY REGION, 2022-2032 ($MILLION)
- TABLE 03. ANIMAL MODEL MARKET FOR MICE, BY REGION, 2022-2032 ($MILLION)
- TABLE 04. ANIMAL MODEL MARKET FOR GUINEA PIGS, BY REGION, 2022-2032 ($MILLION)
- TABLE 05. ANIMAL MODEL MARKET FOR RABBITS, BY REGION, 2022-2032 ($MILLION)
- TABLE 06. ANIMAL MODEL MARKET FOR OTHERS, BY REGION, 2022-2032 ($MILLION)
- TABLE 07. GLOBAL ANIMAL MODEL MARKET, BY APPLICATION, 2022-2032 ($MILLION)
- TABLE 08. ANIMAL MODEL MARKET FOR DRUG DISCOVERY AND DEVELOPMENT, BY REGION, 2022-2032 ($MILLION)
- TABLE 09. ANIMAL MODEL MARKET FOR BASIC RESEARCH, BY REGION, 2022-2032 ($MILLION)
- TABLE 10. ANIMAL MODEL MARKET FOR OTHERS, BY REGION, 2022-2032 ($MILLION)
- TABLE 11. GLOBAL ANIMAL MODEL MARKET, BY END USER, 2022-2032 ($MILLION)
- TABLE 12. ANIMAL MODEL MARKET FOR PHARMA AND BIOTECH COMPANIES, BY REGION, 2022-2032 ($MILLION)
- TABLE 13. ANIMAL MODEL MARKET FOR ACADEMIC RESEARCH INSTITUTES, BY REGION, 2022-2032 ($MILLION)
- TABLE 14. ANIMAL MODEL MARKET FOR OTHERS, BY REGION, 2022-2032 ($MILLION)
- TABLE 15. ANIMAL MODEL MARKET, BY REGION, 2022-2032 ($MILLION)
- TABLE 16. NORTH AMERICA ANIMAL MODEL MARKET, BY ANIMAL TYPE, 2022-2032 ($MILLION)
- TABLE 17. NORTH AMERICA ANIMAL MODEL MARKET, BY APPLICATION, 2022-2032 ($MILLION)
- TABLE 18. NORTH AMERICA ANIMAL MODEL MARKET, BY END USER, 2022-2032 ($MILLION)
- TABLE 19. NORTH AMERICA ANIMAL MODEL MARKET, BY COUNTRY, 2022-2032 ($MILLION)
- TABLE 20. U.S. ANIMAL MODEL MARKET, BY ANIMAL TYPE, 2022-2032 ($MILLION)
- TABLE 21. U.S. ANIMAL MODEL MARKET, BY APPLICATION, 2022-2032 ($MILLION)
- TABLE 22. U.S. ANIMAL MODEL MARKET, BY END USER, 2022-2032 ($MILLION)
- TABLE 23. CANADA ANIMAL MODEL MARKET, BY ANIMAL TYPE, 2022-2032 ($MILLION)
- TABLE 24. CANADA ANIMAL MODEL MARKET, BY APPLICATION, 2022-2032 ($MILLION)
- TABLE 25. CANADA ANIMAL MODEL MARKET, BY END USER, 2022-2032 ($MILLION)
- TABLE 26. MEXICO ANIMAL MODEL MARKET, BY ANIMAL TYPE, 2022-2032 ($MILLION)
- TABLE 27. MEXICO ANIMAL MODEL MARKET, BY APPLICATION, 2022-2032 ($MILLION)
- TABLE 28. MEXICO ANIMAL MODEL MARKET, BY END USER, 2022-2032 ($MILLION)
- TABLE 29. EUROPE ANIMAL MODEL MARKET, BY ANIMAL TYPE, 2022-2032 ($MILLION)
- TABLE 30. EUROPE ANIMAL MODEL MARKET, BY APPLICATION, 2022-2032 ($MILLION)
- TABLE 31. EUROPE ANIMAL MODEL MARKET, BY END USER, 2022-2032 ($MILLION)
- TABLE 32. EUROPE ANIMAL MODEL MARKET, BY COUNTRY, 2022-2032 ($MILLION)
- TABLE 33. GERMANY ANIMAL MODEL MARKET, BY ANIMAL TYPE, 2022-2032 ($MILLION)
- TABLE 34. GERMANY ANIMAL MODEL MARKET, BY APPLICATION, 2022-2032 ($MILLION)
- TABLE 35. GERMANY ANIMAL MODEL MARKET, BY END USER, 2022-2032 ($MILLION)
- TABLE 36. FRANCE ANIMAL MODEL MARKET, BY ANIMAL TYPE, 2022-2032 ($MILLION)
- TABLE 37. FRANCE ANIMAL MODEL MARKET, BY APPLICATION, 2022-2032 ($MILLION)
- TABLE 38. FRANCE ANIMAL MODEL MARKET, BY END USER, 2022-2032 ($MILLION)
- TABLE 39. UK ANIMAL MODEL MARKET, BY ANIMAL TYPE, 2022-2032 ($MILLION)
- TABLE 40. UK ANIMAL MODEL MARKET, BY APPLICATION, 2022-2032 ($MILLION)
- TABLE 41. UK ANIMAL MODEL MARKET, BY END USER, 2022-2032 ($MILLION)
- TABLE 42. ITALY ANIMAL MODEL MARKET, BY ANIMAL TYPE, 2022-2032 ($MILLION)
- TABLE 43. ITALY ANIMAL MODEL MARKET, BY APPLICATION, 2022-2032 ($MILLION)
- TABLE 44. ITALY ANIMAL MODEL MARKET, BY END USER, 2022-2032 ($MILLION)
- TABLE 45. SPAIN ANIMAL MODEL MARKET, BY ANIMAL TYPE, 2022-2032 ($MILLION)
- TABLE 46. SPAIN ANIMAL MODEL MARKET, BY APPLICATION, 2022-2032 ($MILLION)
- TABLE 47. SPAIN ANIMAL MODEL MARKET, BY END USER, 2022-2032 ($MILLION)
- TABLE 48. REST OF EUROPE ANIMAL MODEL MARKET, BY ANIMAL TYPE, 2022-2032 ($MILLION)
- TABLE 49. REST OF EUROPE ANIMAL MODEL MARKET, BY APPLICATION, 2022-2032 ($MILLION)
- TABLE 50. REST OF EUROPE ANIMAL MODEL MARKET, BY END USER, 2022-2032 ($MILLION)
- TABLE 51. ASIA-PACIFIC ANIMAL MODEL MARKET, BY ANIMAL TYPE, 2022-2032 ($MILLION)
- TABLE 52. ASIA-PACIFIC ANIMAL MODEL MARKET, BY APPLICATION, 2022-2032 ($MILLION)
- TABLE 53. ASIA-PACIFIC ANIMAL MODEL MARKET, BY END USER, 2022-2032 ($MILLION)
- TABLE 54. ASIA-PACIFIC ANIMAL MODEL MARKET, BY COUNTRY, 2022-2032 ($MILLION)
- TABLE 55. JAPAN ANIMAL MODEL MARKET, BY ANIMAL TYPE, 2022-2032 ($MILLION)
- TABLE 56. JAPAN ANIMAL MODEL MARKET, BY APPLICATION, 2022-2032 ($MILLION)
- TABLE 57. JAPAN ANIMAL MODEL MARKET, BY END USER, 2022-2032 ($MILLION)
- TABLE 58. CHINA ANIMAL MODEL MARKET, BY ANIMAL TYPE, 2022-2032 ($MILLION)
- TABLE 59. CHINA ANIMAL MODEL MARKET, BY APPLICATION, 2022-2032 ($MILLION)
- TABLE 60. CHINA ANIMAL MODEL MARKET, BY END USER, 2022-2032 ($MILLION)
- TABLE 61. AUSTRALIA ANIMAL MODEL MARKET, BY ANIMAL TYPE, 2022-2032 ($MILLION)
- TABLE 62. AUSTRALIA ANIMAL MODEL MARKET, BY APPLICATION, 2022-2032 ($MILLION)
- TABLE 63. AUSTRALIA ANIMAL MODEL MARKET, BY END USER, 2022-2032 ($MILLION)
- TABLE 64. INDIA ANIMAL MODEL MARKET, BY ANIMAL TYPE, 2022-2032 ($MILLION)
- TABLE 65. INDIA ANIMAL MODEL MARKET, BY APPLICATION, 2022-2032 ($MILLION)
- TABLE 66. INDIA ANIMAL MODEL MARKET, BY END USER, 2022-2032 ($MILLION)
- TABLE 67. SOUTH KOREA ANIMAL MODEL MARKET, BY ANIMAL TYPE, 2022-2032 ($MILLION)
- TABLE 68. SOUTH KOREA ANIMAL MODEL MARKET, BY APPLICATION, 2022-2032 ($MILLION)
- TABLE 69. SOUTH KOREA ANIMAL MODEL MARKET, BY END USER, 2022-2032 ($MILLION)
- TABLE 70. REST OF ASIA-PACIFIC ANIMAL MODEL MARKET, BY ANIMAL TYPE, 2022-2032 ($MILLION)
- TABLE 71. REST OF ASIA-PACIFIC ANIMAL MODEL MARKET, BY APPLICATION, 2022-2032 ($MILLION)
- TABLE 72. REST OF ASIA-PACIFIC ANIMAL MODEL MARKET, BY END USER, 2022-2032 ($MILLION)
- TABLE 73. LAMEA ANIMAL MODEL MARKET, BY ANIMAL TYPE, 2022-2032 ($MILLION)
- TABLE 74. LAMEA ANIMAL MODEL MARKET, BY APPLICATION, 2022-2032 ($MILLION)
- TABLE 75. LAMEA ANIMAL MODEL MARKET, BY END USER, 2022-2032 ($MILLION)
- TABLE 76. LAMEA ANIMAL MODEL MARKET, BY COUNTRY, 2022-2032 ($MILLION)
- TABLE 77. BRAZIL ANIMAL MODEL MARKET, BY ANIMAL TYPE, 2022-2032 ($MILLION)
- TABLE 78. BRAZIL ANIMAL MODEL MARKET, BY APPLICATION, 2022-2032 ($MILLION)
- TABLE 79. BRAZIL ANIMAL MODEL MARKET, BY END USER, 2022-2032 ($MILLION)
- TABLE 80. SAUDI ARABIA ANIMAL MODEL MARKET, BY ANIMAL TYPE, 2022-2032 ($MILLION)
- TABLE 81. SAUDI ARABIA ANIMAL MODEL MARKET, BY APPLICATION, 2022-2032 ($MILLION)
- TABLE 82. SAUDI ARABIA ANIMAL MODEL MARKET, BY END USER, 2022-2032 ($MILLION)
- TABLE 83. SOUTH AFRICA ANIMAL MODEL MARKET, BY ANIMAL TYPE, 2022-2032 ($MILLION)
- TABLE 84. SOUTH AFRICA ANIMAL MODEL MARKET, BY APPLICATION, 2022-2032 ($MILLION)
- TABLE 85. SOUTH AFRICA ANIMAL MODEL MARKET, BY END USER, 2022-2032 ($MILLION)
- TABLE 86. REST OF LAMEA ANIMAL MODEL MARKET, BY ANIMAL TYPE, 2022-2032 ($MILLION)
- TABLE 87. REST OF LAMEA ANIMAL MODEL MARKET, BY APPLICATION, 2022-2032 ($MILLION)
- TABLE 88. REST OF LAMEA ANIMAL MODEL MARKET, BY END USER, 2022-2032 ($MILLION)
- TABLE 89. CHARLES RIVER LABORATORIES: KEY EXECUTIVES
- TABLE 90. CHARLES RIVER LABORATORIES: COMPANY SNAPSHOT
- TABLE 91. CHARLES RIVER LABORATORIES: PRODUCT SEGMENTS
- TABLE 92. CHARLES RIVER LABORATORIES: SERVICE SEGMENTS
- TABLE 93. CHARLES RIVER LABORATORIES: PRODUCT PORTFOLIO
- TABLE 94. CHARLES RIVER LABORATORIES: KEY STRATERGIES
- TABLE 95. INOTIV, INC.: KEY EXECUTIVES
- TABLE 96. INOTIV, INC.: COMPANY SNAPSHOT
- TABLE 97. INOTIV, INC.: PRODUCT SEGMENTS
- TABLE 98. INOTIV, INC.: PRODUCT PORTFOLIO
- TABLE 99. GENOWAY S.A.: KEY EXECUTIVES
- TABLE 100. GENOWAY S.A.: COMPANY SNAPSHOT
- TABLE 101. GENOWAY S.A.: PRODUCT SEGMENTS
- TABLE 102. GENOWAY S.A.: PRODUCT PORTFOLIO
- TABLE 103. GENOWAY S.A.: KEY STRATERGIES
- TABLE 104. HERA BIOLABS: KEY EXECUTIVES
- TABLE 105. HERA BIOLABS: COMPANY SNAPSHOT
- TABLE 106. HERA BIOLABS: PRODUCT SEGMENTS
- TABLE 107. HERA BIOLABS: SERVICE SEGMENTS
- TABLE 108. HERA BIOLABS: PRODUCT PORTFOLIO
- TABLE 109. CROWN BIOSCIENCE INC.: KEY EXECUTIVES
- TABLE 110. CROWN BIOSCIENCE INC.: COMPANY SNAPSHOT
- TABLE 111. CROWN BIOSCIENCE INC.: PRODUCT SEGMENTS
- TABLE 112. CROWN BIOSCIENCE INC.: SERVICE SEGMENTS
- TABLE 113. CROWN BIOSCIENCE INC.: PRODUCT PORTFOLIO
- TABLE 114. OZGENE PTY LTD.: KEY EXECUTIVES
- TABLE 115. OZGENE PTY LTD.: COMPANY SNAPSHOT
- TABLE 116. OZGENE PTY LTD.: PRODUCT SEGMENTS
- TABLE 117. OZGENE PTY LTD.: SERVICE SEGMENTS
- TABLE 118. OZGENE PTY LTD.: PRODUCT PORTFOLIO
- TABLE 119. TACONIC BIOSCIENCES: KEY EXECUTIVES
- TABLE 120. TACONIC BIOSCIENCES: COMPANY SNAPSHOT
- TABLE 121. TACONIC BIOSCIENCES: PRODUCT SEGMENTS
- TABLE 122. TACONIC BIOSCIENCES: PRODUCT PORTFOLIO
- TABLE 123. TACONIC BIOSCIENCES: KEY STRATERGIES
- TABLE 124. THE JACKSON LABORATORY.: KEY EXECUTIVES
- TABLE 125. THE JACKSON LABORATORY.: COMPANY SNAPSHOT
- TABLE 126. THE JACKSON LABORATORY.: PRODUCT SEGMENTS
- TABLE 127. THE JACKSON LABORATORY.: PRODUCT PORTFOLIO
- TABLE 128. TRANS GENIC INC.: KEY EXECUTIVES
- TABLE 129. TRANS GENIC INC.: COMPANY SNAPSHOT
- TABLE 130. TRANS GENIC INC.: PRODUCT SEGMENTS
- TABLE 131. TRANS GENIC INC.: PRODUCT PORTFOLIO
- TABLE 132. JANVIER LABS, LLC: KEY EXECUTIVES
- TABLE 133. JANVIER LABS, LLC: COMPANY SNAPSHOT
- TABLE 134. JANVIER LABS, LLC: PRODUCT SEGMENTS
- TABLE 135. JANVIER LABS, LLC: PRODUCT PORTFOLIO
LIST OF FIGURES
- FIGURE 01. ANIMAL MODEL MARKET, 2022-2032
- FIGURE 02. SEGMENTATION OF ANIMAL MODEL MARKET,2022-2032
- FIGURE 03. TOP INVESTMENT POCKETS IN ANIMAL MODEL MARKET (2023-2032)
- FIGURE 04. LOW BARGAINING POWER OF SUPPLIERS
- FIGURE 05. LOW THREAT OF NEW ENTRANTS
- FIGURE 06. LOW THREAT OF SUBSTITUTES
- FIGURE 07. LOW INTENSITY OF RIVALRY
- FIGURE 08. LOW BARGAINING POWER OF BUYERS
- FIGURE 09. GLOBAL ANIMAL MODEL MARKET:DRIVERS, RESTRAINTS AND OPPORTUNITIES
- FIGURE 10. ANIMAL MODEL MARKET, BY ANIMAL TYPE, 2022 AND 2032(%)
- FIGURE 11. COMPARATIVE SHARE ANALYSIS OF ANIMAL MODEL MARKET FOR RAT, BY COUNTRY 2022 AND 2032(%)
- FIGURE 12. COMPARATIVE SHARE ANALYSIS OF ANIMAL MODEL MARKET FOR MICE, BY COUNTRY 2022 AND 2032(%)
- FIGURE 13. COMPARATIVE SHARE ANALYSIS OF ANIMAL MODEL MARKET FOR GUINEA PIGS, BY COUNTRY 2022 AND 2032(%)
- FIGURE 14. COMPARATIVE SHARE ANALYSIS OF ANIMAL MODEL MARKET FOR RABBITS, BY COUNTRY 2022 AND 2032(%)
- FIGURE 15. COMPARATIVE SHARE ANALYSIS OF ANIMAL MODEL MARKET FOR OTHERS, BY COUNTRY 2022 AND 2032(%)
- FIGURE 16. ANIMAL MODEL MARKET, BY APPLICATION, 2022 AND 2032(%)
- FIGURE 17. COMPARATIVE SHARE ANALYSIS OF ANIMAL MODEL MARKET FOR DRUG DISCOVERY AND DEVELOPMENT, BY COUNTRY 2022 AND 2032(%)
- FIGURE 18. COMPARATIVE SHARE ANALYSIS OF ANIMAL MODEL MARKET FOR BASIC RESEARCH, BY COUNTRY 2022 AND 2032(%)
- FIGURE 19. COMPARATIVE SHARE ANALYSIS OF ANIMAL MODEL MARKET FOR OTHERS, BY COUNTRY 2022 AND 2032(%)
- FIGURE 20. ANIMAL MODEL MARKET, BY END USER, 2022 AND 2032(%)
- FIGURE 21. COMPARATIVE SHARE ANALYSIS OF ANIMAL MODEL MARKET FOR PHARMA AND BIOTECH COMPANIES, BY COUNTRY 2022 AND 2032(%)
- FIGURE 22. COMPARATIVE SHARE ANALYSIS OF ANIMAL MODEL MARKET FOR ACADEMIC RESEARCH INSTITUTES, BY COUNTRY 2022 AND 2032(%)
- FIGURE 23. COMPARATIVE SHARE ANALYSIS OF ANIMAL MODEL MARKET FOR OTHERS, BY COUNTRY 2022 AND 2032(%)
- FIGURE 24. ANIMAL MODEL MARKET BY REGION, 2022 AND 2032(%)
- FIGURE 25. U.S. ANIMAL MODEL MARKET, 2022-2032 ($MILLION)
- FIGURE 26. CANADA ANIMAL MODEL MARKET, 2022-2032 ($MILLION)
- FIGURE 27. MEXICO ANIMAL MODEL MARKET, 2022-2032 ($MILLION)
- FIGURE 28. GERMANY ANIMAL MODEL MARKET, 2022-2032 ($MILLION)
- FIGURE 29. FRANCE ANIMAL MODEL MARKET, 2022-2032 ($MILLION)
- FIGURE 30. UK ANIMAL MODEL MARKET, 2022-2032 ($MILLION)
- FIGURE 31. ITALY ANIMAL MODEL MARKET, 2022-2032 ($MILLION)
- FIGURE 32. SPAIN ANIMAL MODEL MARKET, 2022-2032 ($MILLION)
- FIGURE 33. REST OF EUROPE ANIMAL MODEL MARKET, 2022-2032 ($MILLION)
- FIGURE 34. JAPAN ANIMAL MODEL MARKET, 2022-2032 ($MILLION)
- FIGURE 35. CHINA ANIMAL MODEL MARKET, 2022-2032 ($MILLION)
- FIGURE 36. AUSTRALIA ANIMAL MODEL MARKET, 2022-2032 ($MILLION)
- FIGURE 37. INDIA ANIMAL MODEL MARKET, 2022-2032 ($MILLION)
- FIGURE 38. SOUTH KOREA ANIMAL MODEL MARKET, 2022-2032 ($MILLION)
- FIGURE 39. REST OF ASIA-PACIFIC ANIMAL MODEL MARKET, 2022-2032 ($MILLION)
- FIGURE 40. BRAZIL ANIMAL MODEL MARKET, 2022-2032 ($MILLION)
- FIGURE 41. SAUDI ARABIA ANIMAL MODEL MARKET, 2022-2032 ($MILLION)
- FIGURE 42. SOUTH AFRICA ANIMAL MODEL MARKET, 2022-2032 ($MILLION)
- FIGURE 43. REST OF LAMEA ANIMAL MODEL MARKET, 2022-2032 ($MILLION)
- FIGURE 44. TOP WINNING STRATEGIES, BY YEAR (2020-2023)
- FIGURE 45. TOP WINNING STRATEGIES, BY DEVELOPMENT (2020-2023)
- FIGURE 46. TOP WINNING STRATEGIES, BY COMPANY (2020-2023)
- FIGURE 47. PRODUCT MAPPING OF TOP 10 PLAYERS
- FIGURE 48. COMPETITIVE DASHBOARD
- FIGURE 49. COMPETITIVE HEATMAP: ANIMAL MODEL MARKET
- FIGURE 50. TOP PLAYER POSITIONING, 2022
- FIGURE 51. CHARLES RIVER LABORATORIES: NET REVENUE, 2020-2022 ($MILLION)
- FIGURE 52. CHARLES RIVER LABORATORIES: REVENUE SHARE BY SEGMENT, 2022 (%)
- FIGURE 53. CHARLES RIVER LABORATORIES: REVENUE SHARE BY REGION, 2022 (%)
- FIGURE 54. INOTIV, INC.: NET REVENUE, 2020-2022 ($MILLION)
- FIGURE 55. INOTIV, INC.: REVENUE SHARE BY SEGMENT, 2022 (%)
- FIGURE 56. INOTIV, INC.: REVENUE SHARE BY REGION, 2022 (%)
- FIGURE 57. TRANS GENIC INC.: NET REVENUE, 2020-2022 ($MILLION)
According to a new report published by Allied Market Research, titled, "Animal Model Market," The animal model market was valued at $1.9 billion in 2022, and is estimated to reach $3.6 billion by 2032, growing at a CAGR of 6.6% from 2023 to 2032.
Vaccines are the most effective and economical tools in preventing and controlling infectious diseases. Owing to the rapid spread of SARS-CoV-2, the variability among clinical cases, their outcomes, and high mortality rates, a race to find pharmacological treatments and vaccines was initiated once the World Health Organization (WHO) declared COVID-19 a public health emergency of international concern in January 2020 and a pandemic in March 2020. In context, of vaccine development for COVID-19, the use and choice of reliable and well-characterized experimental models were important for the rapid advancement of research and, consequently, the registration and availability of the vaccines. According to a 2021 report by the National Library of Medicines, animal models involved in the study of COVID-19 include mice, golden hamsters, ferrets, nonhuman primates, and pigs. More than 302 vaccines were under development, of which 117 of them have successfully entered clinical trials. Thus, increase in usage of animal models in the development of vaccines for infectious diseases is expected to contribute significantly in the growth of the market.
Increased adoption of CRISPR (clustered regularly interspaced short palindromic repeats) technology has emerged as a major driver of the animal model market. CRISPR technology allows for precise and efficient genome editing by enabling scientists to make targeted modifications in the DNA of various organisms, including animals. This revolutionary gene-editing tool has significantly advanced the field of genetics and biomedical research, offering numerous applications in the creation of animal models. Furthermore, animal models generated by CRISPR technology have been crucial in the discovery of new medicines. This technology generates highly customized mice and rats whose DNA has been altered to reflect a humanized immune system, which enables precision modeling in research as well as target validation and efficacy assessment. Prior to the use of this technology, it took up to 18 months to produce test animals, whereas now it takes anywhere from one-third to one-half the time to create a founder animal, making it more cost-effective than alternative preclinical animal models. Thus, rise in adoption CRISPR and increase in mouse model-based research are expected to drive the growth of the market. For instance, the U.S. medical and health research and development investment reached $245.1 billion in 2020, an 11.1% increase in 2020. Increase in research activities in the mice model to effectively use them in drug development process is expected to drive the growth of the market. However, ethical guidelines for the use of animals in research are expected to restrain the growth of the animal model market.
The global animal model market is segmented into animal type, application, end user, and region. On the basis of animal type, the market is categorized into rat, mice, guinea pigs, rabbits, and others. The others include zebrafish, amphibians & reptiles, hamsters, chinchillas, gerbils, and armadillo. By application, the market is divided into drug discovery & development, basic research, and others. The others include medical device development, and production & quality control. Depending on end user, the market is segregated into pharma & biotech companies, academic research institutes, and others. The others segment includes medical device companies, contract research organizations (CROs), and contract manufacturing organizations. Region wise, the market is analyzed across North America, Europe, Asia-Pacific, and LAMEA
The key players that operate in the global animal model market are The Jackson Laboratory, Janvier Labs, LLC, Genoway S.A., Hera Biolabs, Crown Bioscience Inc, Ozgene Pty Ltd., Taconic Biosciences, Trans Genic Inc., Inotiv, Inc., and Charles River Laboratories.
Key Benefits For Stakeholders
- This report provides a quantitative analysis of the market segments, current trends, estimations, and dynamics of the animal model market analysis from 2022 to 2032 to identify the prevailing animal model market opportunities.
- The market research is offered along with information related to key drivers, restraints, and opportunities.
- Porter's five forces analysis highlights the potency of buyers and suppliers to enable stakeholders make profit-oriented business decisions and strengthen their supplier-buyer network.
- In-depth analysis of the animal model market segmentation assists to determine the prevailing market opportunities.
- Major countries in each region are mapped according to their revenue contribution to the global market.
- Market player positioning facilitates benchmarking and provides a clear understanding of the present position of the market players.
- The report includes the analysis of the regional as well as global animal model market trends, key players, market segments, application areas, and market growth strategies.
Additional benefits you will get with this purchase are:
- Quarterly Update and* (only available with a corporate license, on listed price)
- 5 additional Company Profile of client Choice pre- or Post-purchase, as a free update.
- Free Upcoming Version on the Purchase of Five and Enterprise User License.
- 16 analyst hours of support* (post-purchase, if you find additional data requirements upon review of the report, you may receive support amounting to 16 analyst hours to solve questions, and post-sale queries)
- 15% Free Customization* (in case the scope or segment of the report does not match your requirements, 20% is equivalent to 3 working days of free work, applicable once)
- Free data Pack on the Five and Enterprise User License. (Excel version of the report)
- Free Updated report if the report is 6-12 months old or older.
- 24-hour priority response*
- Free Industry updates and white papers.
Possible Customization with this report (with additional cost and timeline talk to the sales executive to know more)
- Additional company profiles with specific to client's interest
- Additional country or region analysis- market size and forecast
Key Market Segments
By Animal Type
- Rat
- Mice
- Guinea pigs
- Rabbits
- Others
By Application
- Drug discovery and development
- Basic research
- Others
By End User
- Others
- Pharma and biotech companies
- Academic research institutes
By Region
- North America
- U.S.
- Canada
- Mexico
- Europe
- Germany
- France
- UK
- Italy
- Spain
- Rest of Europe
- Asia-Pacific
- Japan
- China
- Australia
- India
- South Korea
- Rest of Asia-Pacific
- LAMEA
- Brazil
- Saudi Arabia
- South Africa
- Rest of LAMEA
Key Market Players:
- The Jackson Laboratory.
- Hera Biolabs
- Janvier Labs, LLC
- Inotiv, Inc.
- Charles River Laboratories
- Taconic Biosciences
- Crown Bioscience Inc.
- Ozgene Pty Ltd.
- Trans Genic Inc.
- Genoway S.A.
TABLE OF CONTENTS
CHAPTER 1: INTRODUCTION
- 1.1. Report description
- 1.2. Key market segments
- 1.3. Key benefits to the stakeholders
- 1.4. Research Methodology
- 1.4.1. Primary research
- 1.4.2. Secondary research
- 1.4.3. Analyst tools and models
CHAPTER 2: EXECUTIVE SUMMARY
- 2.1. CXO Perspective
CHAPTER 3: MARKET OVERVIEW
- 3.1. Market definition and scope
- 3.2. Key findings
- 3.2.1. Top impacting factors
- 3.2.2. Top investment pockets
- 3.3. Porter's five forces analysis
- 3.3.1. Low bargaining power of suppliers
- 3.3.2. Low threat of new entrants
- 3.3.3. Low threat of substitutes
- 3.3.4. Low intensity of rivalry
- 3.3.5. Low bargaining power of buyers
- 3.4. Market dynamics
- 3.4.1. Drivers
- 3.4.1.1. Rise in usage of animal models in virology and infectious diseases
- 3.4.1.2. Physiological similarity of humans and animals for drug testing
- 3.4.1.3. Increase in adoption of CRISPR technology
- 3.4.2. Restraints
- 3.4.2.1. Availability of alternative testing methods
- 3.4.3. Opportunities
- 3.4.3.1. Growth opportunities in emerging markets
- 3.4.1. Drivers
CHAPTER 4: ANIMAL MODEL MARKET, BY ANIMAL TYPE
- 4.1. Overview
- 4.1.1. Market size and forecast
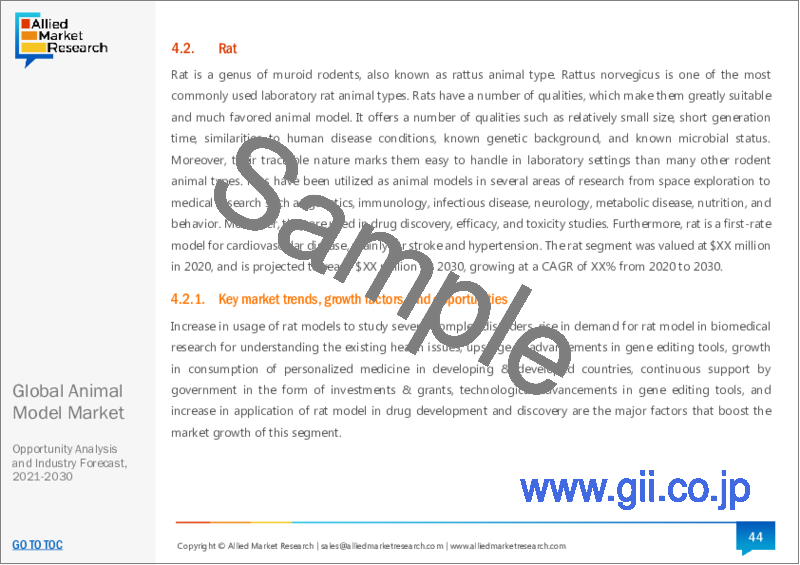
- 4.2. Rat
- 4.2.1. Key market trends, growth factors and opportunities
- 4.2.2. Market size and forecast, by region
- 4.2.3. Market share analysis by country
- 4.3. Mice
- 4.3.1. Key market trends, growth factors and opportunities
- 4.3.2. Market size and forecast, by region
- 4.3.3. Market share analysis by country
- 4.4. Guinea pigs
- 4.4.1. Key market trends, growth factors and opportunities
- 4.4.2. Market size and forecast, by region
- 4.4.3. Market share analysis by country
- 4.5. Rabbits
- 4.5.1. Key market trends, growth factors and opportunities
- 4.5.2. Market size and forecast, by region
- 4.5.3. Market share analysis by country
- 4.6. Others
- 4.6.1. Key market trends, growth factors and opportunities
- 4.6.2. Market size and forecast, by region
- 4.6.3. Market share analysis by country
CHAPTER 5: ANIMAL MODEL MARKET, BY APPLICATION
- 5.1. Overview
- 5.1.1. Market size and forecast
- 5.2. Drug discovery and development
- 5.2.1. Key market trends, growth factors and opportunities
- 5.2.2. Market size and forecast, by region
- 5.2.3. Market share analysis by country
- 5.3. Basic research
- 5.3.1. Key market trends, growth factors and opportunities
- 5.3.2. Market size and forecast, by region
- 5.3.3. Market share analysis by country
- 5.4. Others
- 5.4.1. Key market trends, growth factors and opportunities
- 5.4.2. Market size and forecast, by region
- 5.4.3. Market share analysis by country
CHAPTER 6: ANIMAL MODEL MARKET, BY END USER
- 6.1. Overview
- 6.1.1. Market size and forecast
- 6.2. Pharma and biotech companies
- 6.2.1. Key market trends, growth factors and opportunities
- 6.2.2. Market size and forecast, by region
- 6.2.3. Market share analysis by country
- 6.3. Academic research institutes
- 6.3.1. Key market trends, growth factors and opportunities
- 6.3.2. Market size and forecast, by region
- 6.3.3. Market share analysis by country
- 6.4. Others
- 6.4.1. Key market trends, growth factors and opportunities
- 6.4.2. Market size and forecast, by region
- 6.4.3. Market share analysis by country
CHAPTER 7: ANIMAL MODEL MARKET, BY REGION
- 7.1. Overview
- 7.1.1. Market size and forecast By Region
- 7.2. North America
- 7.2.1. Key market trends, growth factors and opportunities
- 7.2.2. Market size and forecast, by Animal Type
- 7.2.3. Market size and forecast, by Application
- 7.2.4. Market size and forecast, by End User
- 7.2.5. Market size and forecast, by country
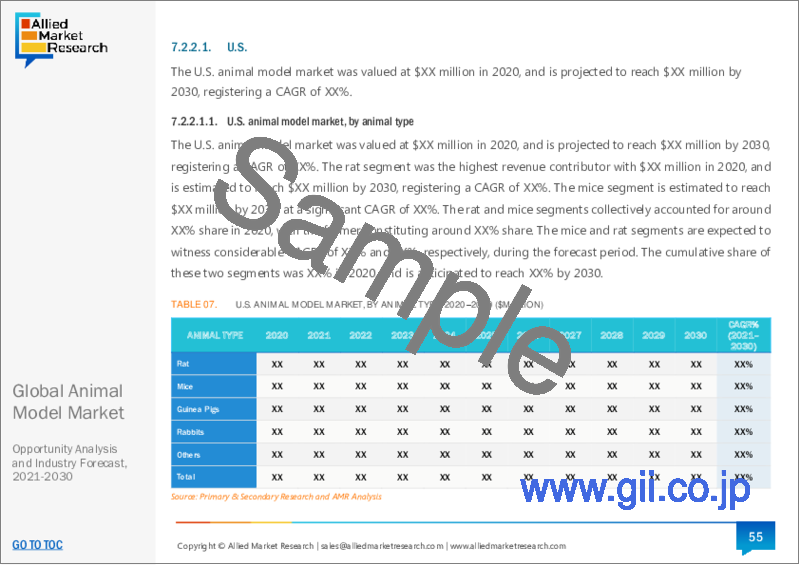
- 7.2.5.1. U.S.
- 7.2.5.1.1. Market size and forecast, by Animal Type
- 7.2.5.1.2. Market size and forecast, by Application
- 7.2.5.1.3. Market size and forecast, by End User
- 7.2.5.2. Canada
- 7.2.5.2.1. Market size and forecast, by Animal Type
- 7.2.5.2.2. Market size and forecast, by Application
- 7.2.5.2.3. Market size and forecast, by End User
- 7.2.5.3. Mexico
- 7.2.5.3.1. Market size and forecast, by Animal Type
- 7.2.5.3.2. Market size and forecast, by Application
- 7.2.5.3.3. Market size and forecast, by End User
- 7.3. Europe
- 7.3.1. Key market trends, growth factors and opportunities
- 7.3.2. Market size and forecast, by Animal Type
- 7.3.3. Market size and forecast, by Application
- 7.3.4. Market size and forecast, by End User
- 7.3.5. Market size and forecast, by country
- 7.3.5.1. Germany
- 7.3.5.1.1. Market size and forecast, by Animal Type
- 7.3.5.1.2. Market size and forecast, by Application
- 7.3.5.1.3. Market size and forecast, by End User
- 7.3.5.2. France
- 7.3.5.2.1. Market size and forecast, by Animal Type
- 7.3.5.2.2. Market size and forecast, by Application
- 7.3.5.2.3. Market size and forecast, by End User
- 7.3.5.3. UK
- 7.3.5.3.1. Market size and forecast, by Animal Type
- 7.3.5.3.2. Market size and forecast, by Application
- 7.3.5.3.3. Market size and forecast, by End User
- 7.3.5.4. Italy
- 7.3.5.4.1. Market size and forecast, by Animal Type
- 7.3.5.4.2. Market size and forecast, by Application
- 7.3.5.4.3. Market size and forecast, by End User
- 7.3.5.5. Spain
- 7.3.5.5.1. Market size and forecast, by Animal Type
- 7.3.5.5.2. Market size and forecast, by Application
- 7.3.5.5.3. Market size and forecast, by End User
- 7.3.5.6. Rest of Europe
- 7.3.5.6.1. Market size and forecast, by Animal Type
- 7.3.5.6.2. Market size and forecast, by Application
- 7.3.5.6.3. Market size and forecast, by End User
- 7.4. Asia-Pacific
- 7.4.1. Key market trends, growth factors and opportunities
- 7.4.2. Market size and forecast, by Animal Type
- 7.4.3. Market size and forecast, by Application
- 7.4.4. Market size and forecast, by End User
- 7.4.5. Market size and forecast, by country
- 7.4.5.1. Japan
- 7.4.5.1.1. Market size and forecast, by Animal Type
- 7.4.5.1.2. Market size and forecast, by Application
- 7.4.5.1.3. Market size and forecast, by End User
- 7.4.5.2. China
- 7.4.5.2.1. Market size and forecast, by Animal Type
- 7.4.5.2.2. Market size and forecast, by Application
- 7.4.5.2.3. Market size and forecast, by End User
- 7.4.5.3. Australia
- 7.4.5.3.1. Market size and forecast, by Animal Type
- 7.4.5.3.2. Market size and forecast, by Application
- 7.4.5.3.3. Market size and forecast, by End User
- 7.4.5.4. India
- 7.4.5.4.1. Market size and forecast, by Animal Type
- 7.4.5.4.2. Market size and forecast, by Application
- 7.4.5.4.3. Market size and forecast, by End User
- 7.4.5.5. South Korea
- 7.4.5.5.1. Market size and forecast, by Animal Type
- 7.4.5.5.2. Market size and forecast, by Application
- 7.4.5.5.3. Market size and forecast, by End User
- 7.4.5.6. Rest of Asia-Pacific
- 7.4.5.6.1. Market size and forecast, by Animal Type
- 7.4.5.6.2. Market size and forecast, by Application
- 7.4.5.6.3. Market size and forecast, by End User
- 7.5. LAMEA
- 7.5.1. Key market trends, growth factors and opportunities
- 7.5.2. Market size and forecast, by Animal Type
- 7.5.3. Market size and forecast, by Application
- 7.5.4. Market size and forecast, by End User
- 7.5.5. Market size and forecast, by country
- 7.5.5.1. Brazil
- 7.5.5.1.1. Market size and forecast, by Animal Type
- 7.5.5.1.2. Market size and forecast, by Application
- 7.5.5.1.3. Market size and forecast, by End User
- 7.5.5.2. Saudi Arabia
- 7.5.5.2.1. Market size and forecast, by Animal Type
- 7.5.5.2.2. Market size and forecast, by Application
- 7.5.5.2.3. Market size and forecast, by End User
- 7.5.5.3. South Africa
- 7.5.5.3.1. Market size and forecast, by Animal Type
- 7.5.5.3.2. Market size and forecast, by Application
- 7.5.5.3.3. Market size and forecast, by End User
- 7.5.5.4. Rest of LAMEA
- 7.5.5.4.1. Market size and forecast, by Animal Type
- 7.5.5.4.2. Market size and forecast, by Application
- 7.5.5.4.3. Market size and forecast, by End User
CHAPTER 8: COMPETITIVE LANDSCAPE
- 8.1. Introduction
- 8.2. Top winning strategies
- 8.3. Product Mapping of Top 10 Player
- 8.4. Competitive Dashboard
- 8.5. Competitive Heatmap
- 8.6. Top player positioning, 2022
CHAPTER 9: COMPANY PROFILES
- 9.1. Charles River Laboratories
- 9.1.1. Company overview
- 9.1.2. Key Executives
- 9.1.3. Company snapshot
- 9.1.4. Operating business segments
- 9.1.5. Product portfolio
- 9.1.6. Business performance
- 9.1.7. Key strategic moves and developments
- 9.2. Inotiv, Inc.
- 9.2.1. Company overview
- 9.2.2. Key Executives
- 9.2.3. Company snapshot
- 9.2.4. Operating business segments
- 9.2.5. Product portfolio
- 9.2.6. Business performance
- 9.3. Genoway S.A.
- 9.3.1. Company overview
- 9.3.2. Key Executives
- 9.3.3. Company snapshot
- 9.3.4. Operating business segments
- 9.3.5. Product portfolio
- 9.3.6. Key strategic moves and developments
- 9.4. Hera Biolabs
- 9.4.1. Company overview
- 9.4.2. Key Executives
- 9.4.3. Company snapshot
- 9.4.4. Operating business segments
- 9.4.5. Product portfolio
- 9.5. Crown Bioscience Inc.
- 9.5.1. Company overview
- 9.5.2. Key Executives
- 9.5.3. Company snapshot
- 9.5.4. Operating business segments
- 9.5.5. Product portfolio
- 9.6. Ozgene Pty Ltd.
- 9.6.1. Company overview
- 9.6.2. Key Executives
- 9.6.3. Company snapshot
- 9.6.4. Operating business segments
- 9.6.5. Product portfolio
- 9.7. Taconic Biosciences
- 9.7.1. Company overview
- 9.7.2. Key Executives
- 9.7.3. Company snapshot
- 9.7.4. Operating business segments
- 9.7.5. Product portfolio
- 9.7.6. Key strategic moves and developments
- 9.8. The Jackson Laboratory.
- 9.8.1. Company overview
- 9.8.2. Key Executives
- 9.8.3. Company snapshot
- 9.8.4. Operating business segments
- 9.8.5. Product portfolio
- 9.9. Trans Genic Inc.
- 9.9.1. Company overview
- 9.9.2. Key Executives
- 9.9.3. Company snapshot
- 9.9.4. Operating business segments
- 9.9.5. Product portfolio
- 9.9.6. Business performance
- 9.10. Janvier Labs, LLC
- 9.10.1. Company overview
- 9.10.2. Key Executives
- 9.10.3. Company snapshot
- 9.10.4. Operating business segments
- 9.10.5. Product portfolio
