 |
市場調査レポート
商品コード
1365626
防衛地理空間市場:技術別、タイプ別、用途別:世界の機会分析と産業予測、2023~2032年Defense Geospatial Market By Technology (Geographic Information System, Global Positioning System, Remote Sensing), By Type, By Application : Global Opportunity Analysis and Industry Forecast, 2023-2032 |
||||||

| 防衛地理空間市場:技術別、タイプ別、用途別:世界の機会分析と産業予測、2023~2032年 |
|
出版日: 2023年07月01日
発行: Allied Market Research
ページ情報: 英文 280 Pages
納期: 2~3営業日
|
- 全表示
- 概要
- 図表
- 目次
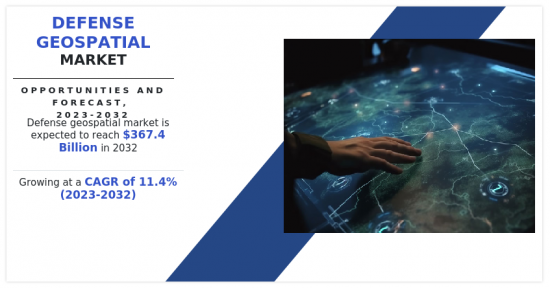
防衛地理空間市場は、世界中で偵察、監視の需要が増加しているため、2023年から2032年にかけて11.4%の大幅な成長率が見込まれています。
目次
第1章 イントロダクション
第2章 エグゼクティブサマリー
第3章 市場概要
- 市場の定義と範囲
- 主な調査結果
- 影響要因
- 主な投資機会
- ポーターのファイブフォース分析
- 市場力学
- 促進要因
- 偵察・監視需要
- 他のシステムとの統合
- 抑制要因
- データのプライバシーと保護に関する懸念
- 高コストとアクセシビリティの欠如
- 機会
- 地理空間システムと組み合わされたAI
- 防衛地理空間におけるARとVRの利用
- 促進要因
- COVID-19市場への影響分析
第4章 防衛地理空間市場:技術別
- 概要
- 地理情報システム(GIS)
- 全地球測位システム(GPS)
- リモートセンシング
第5章 防衛地理空間市場:タイプ別
- 概要
- サーフェス分析
- ネットワーク分析
- ジオ可視化
第6章 防衛地理空間市場:用途別
- 概要
- 軍事ロジスティクス
- 情報収集
- 戦場管理
第7章 防衛地理空間市場:地域別
- 概要
- 北米
- 米国
- カナダ
- メキシコ
- 欧州
- 英国
- ドイツ
- フランス
- イタリア
- その他
- アジア太平洋
- 中国
- 日本
- インド
- 韓国
- その他
- ラテンアメリカ
- ラテンアメリカ
- 中東
- アフリカ
第8章 競合情勢
- イントロダクション
- 主要成功戦略
- 主要10社の製品マッピング
- 競合ダッシュボード
- 競合ヒートマップ
- 主要企業のポジショニング、2022年
第9章 企業プロファイル
- TerraGo
- BlackSky
- Orbital Insights
- MapLarge
- Maxar Technologies
- Trimble Inc.
- Esri
- Hexagon AB
- NV5 Global, Inc.
- Airbus
LIST OF TABLES
- TABLE 01. GLOBAL DEFENSE GEOSPATIAL MARKET, BY TECHNOLOGY, 2022-2032 ($MILLION)
- TABLE 02. DEFENSE GEOSPATIAL MARKET FOR GEOGRAPHIC INFORMATION SYSTEM (GIS), BY REGION, 2022-2032 ($MILLION)
- TABLE 03. DEFENSE GEOSPATIAL MARKET FOR GLOBAL POSITIONING SYSTEM (GPS), BY REGION, 2022-2032 ($MILLION)
- TABLE 04. DEFENSE GEOSPATIAL MARKET FOR REMOTE SENSING, BY REGION, 2022-2032 ($MILLION)
- TABLE 05. GLOBAL DEFENSE GEOSPATIAL MARKET, BY TYPE, 2022-2032 ($MILLION)
- TABLE 06. DEFENSE GEOSPATIAL MARKET FOR SURFACE ANALYSIS, BY REGION, 2022-2032 ($MILLION)
- TABLE 07. DEFENSE GEOSPATIAL MARKET FOR NETWORK ANALYSIS, BY REGION, 2022-2032 ($MILLION)
- TABLE 08. DEFENSE GEOSPATIAL MARKET FOR GEO VISUALIZATION, BY REGION, 2022-2032 ($MILLION)
- TABLE 09. GLOBAL DEFENSE GEOSPATIAL MARKET, BY APPLICATION, 2022-2032 ($MILLION)
- TABLE 10. DEFENSE GEOSPATIAL MARKET FOR MILITARY LOGISTICS, BY REGION, 2022-2032 ($MILLION)
- TABLE 11. DEFENSE GEOSPATIAL MARKET FOR INTELLIGENCE GATHERING, BY REGION, 2022-2032 ($MILLION)
- TABLE 12. DEFENSE GEOSPATIAL MARKET FOR BATTLEFIELD MANAGEMENT, BY REGION, 2022-2032 ($MILLION)
- TABLE 13. DEFENSE GEOSPATIAL MARKET, BY REGION, 2022-2032 ($MILLION)
- TABLE 14. NORTH AMERICA DEFENSE GEOSPATIAL MARKET, BY TECHNOLOGY, 2022-2032 ($MILLION)
- TABLE 15. NORTH AMERICA DEFENSE GEOSPATIAL MARKET, BY TYPE, 2022-2032 ($MILLION)
- TABLE 16. NORTH AMERICA DEFENSE GEOSPATIAL MARKET, BY APPLICATION, 2022-2032 ($MILLION)
- TABLE 17. NORTH AMERICA DEFENSE GEOSPATIAL MARKET, BY COUNTRY, 2022-2032 ($MILLION)
- TABLE 18. U.S. DEFENSE GEOSPATIAL MARKET, BY TECHNOLOGY, 2022-2032 ($MILLION)
- TABLE 19. U.S. DEFENSE GEOSPATIAL MARKET, BY TYPE, 2022-2032 ($MILLION)
- TABLE 20. U.S. DEFENSE GEOSPATIAL MARKET, BY APPLICATION, 2022-2032 ($MILLION)
- TABLE 21. CANADA DEFENSE GEOSPATIAL MARKET, BY TECHNOLOGY, 2022-2032 ($MILLION)
- TABLE 22. CANADA DEFENSE GEOSPATIAL MARKET, BY TYPE, 2022-2032 ($MILLION)
- TABLE 23. CANADA DEFENSE GEOSPATIAL MARKET, BY APPLICATION, 2022-2032 ($MILLION)
- TABLE 24. MEXICO DEFENSE GEOSPATIAL MARKET, BY TECHNOLOGY, 2022-2032 ($MILLION)
- TABLE 25. MEXICO DEFENSE GEOSPATIAL MARKET, BY TYPE, 2022-2032 ($MILLION)
- TABLE 26. MEXICO DEFENSE GEOSPATIAL MARKET, BY APPLICATION, 2022-2032 ($MILLION)
- TABLE 27. EUROPE DEFENSE GEOSPATIAL MARKET, BY TECHNOLOGY, 2022-2032 ($MILLION)
- TABLE 28. EUROPE DEFENSE GEOSPATIAL MARKET, BY TYPE, 2022-2032 ($MILLION)
- TABLE 29. EUROPE DEFENSE GEOSPATIAL MARKET, BY APPLICATION, 2022-2032 ($MILLION)
- TABLE 30. EUROPE DEFENSE GEOSPATIAL MARKET, BY COUNTRY, 2022-2032 ($MILLION)
- TABLE 31. UK DEFENSE GEOSPATIAL MARKET, BY TECHNOLOGY, 2022-2032 ($MILLION)
- TABLE 32. UK DEFENSE GEOSPATIAL MARKET, BY TYPE, 2022-2032 ($MILLION)
- TABLE 33. UK DEFENSE GEOSPATIAL MARKET, BY APPLICATION, 2022-2032 ($MILLION)
- TABLE 34. GERMANY DEFENSE GEOSPATIAL MARKET, BY TECHNOLOGY, 2022-2032 ($MILLION)
- TABLE 35. GERMANY DEFENSE GEOSPATIAL MARKET, BY TYPE, 2022-2032 ($MILLION)
- TABLE 36. GERMANY DEFENSE GEOSPATIAL MARKET, BY APPLICATION, 2022-2032 ($MILLION)
- TABLE 37. FRANCE DEFENSE GEOSPATIAL MARKET, BY TECHNOLOGY, 2022-2032 ($MILLION)
- TABLE 38. FRANCE DEFENSE GEOSPATIAL MARKET, BY TYPE, 2022-2032 ($MILLION)
- TABLE 39. FRANCE DEFENSE GEOSPATIAL MARKET, BY APPLICATION, 2022-2032 ($MILLION)
- TABLE 40. ITALY DEFENSE GEOSPATIAL MARKET, BY TECHNOLOGY, 2022-2032 ($MILLION)
- TABLE 41. ITALY DEFENSE GEOSPATIAL MARKET, BY TYPE, 2022-2032 ($MILLION)
- TABLE 42. ITALY DEFENSE GEOSPATIAL MARKET, BY APPLICATION, 2022-2032 ($MILLION)
- TABLE 43. REST OF EUROPE DEFENSE GEOSPATIAL MARKET, BY TECHNOLOGY, 2022-2032 ($MILLION)
- TABLE 44. REST OF EUROPE DEFENSE GEOSPATIAL MARKET, BY TYPE, 2022-2032 ($MILLION)
- TABLE 45. REST OF EUROPE DEFENSE GEOSPATIAL MARKET, BY APPLICATION, 2022-2032 ($MILLION)
- TABLE 46. ASIA-PACIFIC DEFENSE GEOSPATIAL MARKET, BY TECHNOLOGY, 2022-2032 ($MILLION)
- TABLE 47. ASIA-PACIFIC DEFENSE GEOSPATIAL MARKET, BY TYPE, 2022-2032 ($MILLION)
- TABLE 48. ASIA-PACIFIC DEFENSE GEOSPATIAL MARKET, BY APPLICATION, 2022-2032 ($MILLION)
- TABLE 49. ASIA-PACIFIC DEFENSE GEOSPATIAL MARKET, BY COUNTRY, 2022-2032 ($MILLION)
- TABLE 50. CHINA DEFENSE GEOSPATIAL MARKET, BY TECHNOLOGY, 2022-2032 ($MILLION)
- TABLE 51. CHINA DEFENSE GEOSPATIAL MARKET, BY TYPE, 2022-2032 ($MILLION)
- TABLE 52. CHINA DEFENSE GEOSPATIAL MARKET, BY APPLICATION, 2022-2032 ($MILLION)
- TABLE 53. JAPAN DEFENSE GEOSPATIAL MARKET, BY TECHNOLOGY, 2022-2032 ($MILLION)
- TABLE 54. JAPAN DEFENSE GEOSPATIAL MARKET, BY TYPE, 2022-2032 ($MILLION)
- TABLE 55. JAPAN DEFENSE GEOSPATIAL MARKET, BY APPLICATION, 2022-2032 ($MILLION)
- TABLE 56. INDIA DEFENSE GEOSPATIAL MARKET, BY TECHNOLOGY, 2022-2032 ($MILLION)
- TABLE 57. INDIA DEFENSE GEOSPATIAL MARKET, BY TYPE, 2022-2032 ($MILLION)
- TABLE 58. INDIA DEFENSE GEOSPATIAL MARKET, BY APPLICATION, 2022-2032 ($MILLION)
- TABLE 59. SOUTH KOREA DEFENSE GEOSPATIAL MARKET, BY TECHNOLOGY, 2022-2032 ($MILLION)
- TABLE 60. SOUTH KOREA DEFENSE GEOSPATIAL MARKET, BY TYPE, 2022-2032 ($MILLION)
- TABLE 61. SOUTH KOREA DEFENSE GEOSPATIAL MARKET, BY APPLICATION, 2022-2032 ($MILLION)
- TABLE 62. REST OF ASIA-PACIFIC DEFENSE GEOSPATIAL MARKET, BY TECHNOLOGY, 2022-2032 ($MILLION)
- TABLE 63. REST OF ASIA-PACIFIC DEFENSE GEOSPATIAL MARKET, BY TYPE, 2022-2032 ($MILLION)
- TABLE 64. REST OF ASIA-PACIFIC DEFENSE GEOSPATIAL MARKET, BY APPLICATION, 2022-2032 ($MILLION)
- TABLE 65. LAMEA DEFENSE GEOSPATIAL MARKET, BY TECHNOLOGY, 2022-2032 ($MILLION)
- TABLE 66. LAMEA DEFENSE GEOSPATIAL MARKET, BY TYPE, 2022-2032 ($MILLION)
- TABLE 67. LAMEA DEFENSE GEOSPATIAL MARKET, BY APPLICATION, 2022-2032 ($MILLION)
- TABLE 68. LAMEA DEFENSE GEOSPATIAL MARKET, BY COUNTRY, 2022-2032 ($MILLION)
- TABLE 69. LATIN AMERICA DEFENSE GEOSPATIAL MARKET, BY TECHNOLOGY, 2022-2032 ($MILLION)
- TABLE 70. LATIN AMERICA DEFENSE GEOSPATIAL MARKET, BY TYPE, 2022-2032 ($MILLION)
- TABLE 71. LATIN AMERICA DEFENSE GEOSPATIAL MARKET, BY APPLICATION, 2022-2032 ($MILLION)
- TABLE 72. MIDDLE EAST DEFENSE GEOSPATIAL MARKET, BY TECHNOLOGY, 2022-2032 ($MILLION)
- TABLE 73. MIDDLE EAST DEFENSE GEOSPATIAL MARKET, BY TYPE, 2022-2032 ($MILLION)
- TABLE 74. MIDDLE EAST DEFENSE GEOSPATIAL MARKET, BY APPLICATION, 2022-2032 ($MILLION)
- TABLE 75. AFRICA DEFENSE GEOSPATIAL MARKET, BY TECHNOLOGY, 2022-2032 ($MILLION)
- TABLE 76. AFRICA DEFENSE GEOSPATIAL MARKET, BY TYPE, 2022-2032 ($MILLION)
- TABLE 77. AFRICA DEFENSE GEOSPATIAL MARKET, BY APPLICATION, 2022-2032 ($MILLION)
- TABLE 78. TERRAGO: KEY EXECUTIVES
- TABLE 79. TERRAGO: COMPANY SNAPSHOT
- TABLE 80. TERRAGO: PRODUCT SEGMENTS
- TABLE 81. TERRAGO: PRODUCT PORTFOLIO
- TABLE 82. BLACKSKY: KEY EXECUTIVES
- TABLE 83. BLACKSKY: COMPANY SNAPSHOT
- TABLE 84. BLACKSKY: PRODUCT SEGMENTS
- TABLE 85. BLACKSKY: PRODUCT PORTFOLIO
- TABLE 86. BLACKSKY: KEY STRATERGIES
- TABLE 87. ORBITAL INSIGHTS: KEY EXECUTIVES
- TABLE 88. ORBITAL INSIGHTS: COMPANY SNAPSHOT
- TABLE 89. ORBITAL INSIGHTS: PRODUCT SEGMENTS
- TABLE 90. ORBITAL INSIGHTS: PRODUCT PORTFOLIO
- TABLE 91. MAPLARGE: KEY EXECUTIVES
- TABLE 92. MAPLARGE: COMPANY SNAPSHOT
- TABLE 93. MAPLARGE: PRODUCT SEGMENTS
- TABLE 94. MAPLARGE: PRODUCT PORTFOLIO
- TABLE 95. MAXAR TECHNOLOGIES: KEY EXECUTIVES
- TABLE 96. MAXAR TECHNOLOGIES: COMPANY SNAPSHOT
- TABLE 97. MAXAR TECHNOLOGIES: PRODUCT SEGMENTS
- TABLE 98. MAXAR TECHNOLOGIES: PRODUCT PORTFOLIO
- TABLE 99. MAXAR TECHNOLOGIES: KEY STRATERGIES
- TABLE 100. TRIMBLE INC.: KEY EXECUTIVES
- TABLE 101. TRIMBLE INC.: COMPANY SNAPSHOT
- TABLE 102. TRIMBLE INC.: PRODUCT SEGMENTS
- TABLE 103. TRIMBLE INC.: PRODUCT PORTFOLIO
- TABLE 104. TRIMBLE INC.: KEY STRATERGIES
- TABLE 105. ESRI: KEY EXECUTIVES
- TABLE 106. ESRI: COMPANY SNAPSHOT
- TABLE 107. ESRI: PRODUCT SEGMENTS
- TABLE 108. ESRI: PRODUCT PORTFOLIO
- TABLE 109. ESRI: KEY STRATERGIES
- TABLE 110. HEXAGON AB: KEY EXECUTIVES
- TABLE 111. HEXAGON AB: COMPANY SNAPSHOT
- TABLE 112. HEXAGON AB: PRODUCT SEGMENTS
- TABLE 113. HEXAGON AB: PRODUCT PORTFOLIO
- TABLE 114. HEXAGON AB: KEY STRATERGIES
- TABLE 115. NV5 GLOBAL, INC.: KEY EXECUTIVES
- TABLE 116. NV5 GLOBAL, INC.: COMPANY SNAPSHOT
- TABLE 117. NV5 GLOBAL, INC.: PRODUCT SEGMENTS
- TABLE 118. NV5 GLOBAL, INC.: PRODUCT PORTFOLIO
- TABLE 119. NV5 GLOBAL, INC.: KEY STRATERGIES
- TABLE 120. AIRBUS: KEY EXECUTIVES
- TABLE 121. AIRBUS: COMPANY SNAPSHOT
- TABLE 122. AIRBUS: PRODUCT SEGMENTS
- TABLE 123. AIRBUS: PRODUCT PORTFOLIO
- TABLE 124. AIRBUS: KEY STRATERGIES
LIST OF FIGURES
- FIGURE 01. DEFENSE GEOSPATIAL MARKET, 2022-2032
- FIGURE 02. SEGMENTATION OF DEFENSE GEOSPATIAL MARKET,2022-2032
- FIGURE 03. TOP INVESTMENT POCKETS IN DEFENSE GEOSPATIAL MARKET (2023-2032)
- FIGURE 04. LOW BARGAINING POWER OF SUPPLIERS
- FIGURE 05. LOW THREAT OF NEW ENTRANTS
- FIGURE 06. LOW THREAT OF SUBSTITUTES
- FIGURE 07. LOW INTENSITY OF RIVALRY
- FIGURE 08. LOW BARGAINING POWER OF BUYERS
- FIGURE 09. GLOBAL DEFENSE GEOSPATIAL MARKET:DRIVERS, RESTRAINTS AND OPPORTUNITIES
- FIGURE 10. DEFENSE GEOSPATIAL MARKET, BY TECHNOLOGY, 2022(%)
- FIGURE 11. COMPARATIVE SHARE ANALYSIS OF DEFENSE GEOSPATIAL MARKET FOR GEOGRAPHIC INFORMATION SYSTEM (GIS), BY COUNTRY 2022 AND 2032(%)
- FIGURE 12. COMPARATIVE SHARE ANALYSIS OF DEFENSE GEOSPATIAL MARKET FOR GLOBAL POSITIONING SYSTEM (GPS), BY COUNTRY 2022 AND 2032(%)
- FIGURE 13. COMPARATIVE SHARE ANALYSIS OF DEFENSE GEOSPATIAL MARKET FOR REMOTE SENSING, BY COUNTRY 2022 AND 2032(%)
- FIGURE 14. DEFENSE GEOSPATIAL MARKET, BY TYPE, 2022(%)
- FIGURE 15. COMPARATIVE SHARE ANALYSIS OF DEFENSE GEOSPATIAL MARKET FOR SURFACE ANALYSIS, BY COUNTRY 2022 AND 2032(%)
- FIGURE 16. COMPARATIVE SHARE ANALYSIS OF DEFENSE GEOSPATIAL MARKET FOR NETWORK ANALYSIS, BY COUNTRY 2022 AND 2032(%)
- FIGURE 17. COMPARATIVE SHARE ANALYSIS OF DEFENSE GEOSPATIAL MARKET FOR GEO VISUALIZATION, BY COUNTRY 2022 AND 2032(%)
- FIGURE 18. DEFENSE GEOSPATIAL MARKET, BY APPLICATION, 2022(%)
- FIGURE 19. COMPARATIVE SHARE ANALYSIS OF DEFENSE GEOSPATIAL MARKET FOR MILITARY LOGISTICS, BY COUNTRY 2022 AND 2032(%)
- FIGURE 20. COMPARATIVE SHARE ANALYSIS OF DEFENSE GEOSPATIAL MARKET FOR INTELLIGENCE GATHERING, BY COUNTRY 2022 AND 2032(%)
- FIGURE 21. COMPARATIVE SHARE ANALYSIS OF DEFENSE GEOSPATIAL MARKET FOR BATTLEFIELD MANAGEMENT, BY COUNTRY 2022 AND 2032(%)
- FIGURE 22. DEFENSE GEOSPATIAL MARKET BY REGION, 2022(%)
- FIGURE 23. U.S. DEFENSE GEOSPATIAL MARKET, 2022-2032 ($MILLION)
- FIGURE 24. CANADA DEFENSE GEOSPATIAL MARKET, 2022-2032 ($MILLION)
- FIGURE 25. MEXICO DEFENSE GEOSPATIAL MARKET, 2022-2032 ($MILLION)
- FIGURE 26. UK DEFENSE GEOSPATIAL MARKET, 2022-2032 ($MILLION)
- FIGURE 27. GERMANY DEFENSE GEOSPATIAL MARKET, 2022-2032 ($MILLION)
- FIGURE 28. FRANCE DEFENSE GEOSPATIAL MARKET, 2022-2032 ($MILLION)
- FIGURE 29. ITALY DEFENSE GEOSPATIAL MARKET, 2022-2032 ($MILLION)
- FIGURE 30. REST OF EUROPE DEFENSE GEOSPATIAL MARKET, 2022-2032 ($MILLION)
- FIGURE 31. CHINA DEFENSE GEOSPATIAL MARKET, 2022-2032 ($MILLION)
- FIGURE 32. JAPAN DEFENSE GEOSPATIAL MARKET, 2022-2032 ($MILLION)
- FIGURE 33. INDIA DEFENSE GEOSPATIAL MARKET, 2022-2032 ($MILLION)
- FIGURE 34. SOUTH KOREA DEFENSE GEOSPATIAL MARKET, 2022-2032 ($MILLION)
- FIGURE 35. REST OF ASIA-PACIFIC DEFENSE GEOSPATIAL MARKET, 2022-2032 ($MILLION)
- FIGURE 36. LATIN AMERICA DEFENSE GEOSPATIAL MARKET, 2022-2032 ($MILLION)
- FIGURE 37. MIDDLE EAST DEFENSE GEOSPATIAL MARKET, 2022-2032 ($MILLION)
- FIGURE 38. AFRICA DEFENSE GEOSPATIAL MARKET, 2022-2032 ($MILLION)
- FIGURE 39. TOP WINNING STRATEGIES, BY YEAR
- FIGURE 40. TOP WINNING STRATEGIES, BY DEVELOPMENT
- FIGURE 41. TOP WINNING STRATEGIES, BY COMPANY
- FIGURE 42. PRODUCT MAPPING OF TOP 10 PLAYERS
- FIGURE 43. COMPETITIVE DASHBOARD
- FIGURE 44. COMPETITIVE HEATMAP: DEFENSE GEOSPATIAL MARKET
- FIGURE 45. TOP PLAYER POSITIONING, 2022
- FIGURE 46. BLACKSKY: RESEARCH & DEVELOPMENT EXPENDITURE, 2020-2022 ($MILLION)
- FIGURE 47. BLACKSKY: NET SALES, 2020-2022 ($MILLION)
- FIGURE 48. BLACKSKY: REVENUE SHARE BY SEGMENT, 2022 (%)
- FIGURE 49. BLACKSKY: REVENUE SHARE BY REGION, 2022 (%)
- FIGURE 50. MAXAR TECHNOLOGIES: NET REVENUE, 2020-2022 ($MILLION)
- FIGURE 51. MAXAR TECHNOLOGIES: RESEARCH & DEVELOPMENT EXPENDITURE, 2020-2022 ($MILLION)
- FIGURE 52. MAXAR TECHNOLOGIES: REVENUE SHARE BY REGION, 2022 (%)
- FIGURE 53. MAXAR TECHNOLOGIES: REVENUE SHARE BY SEGMENT, 2022 (%)
- FIGURE 54. TRIMBLE INC.: NET REVENUE, 2020-2022 ($MILLION)
- FIGURE 55. TRIMBLE INC.: RESEARCH & DEVELOPMENT EXPENDITURE, 2020-2022 ($MILLION)
- FIGURE 56. TRIMBLE INC.: REVENUE SHARE BY SEGMENT, 2022 (%)
- FIGURE 57. TRIMBLE INC.: REVENUE SHARE BY REGION, 2022 (%)
- FIGURE 58. HEXAGON AB: NET SALES, 2020-2022 ($MILLION)
- FIGURE 59. HEXAGON AB: RESEARCH & DEVELOPMENT EXPENDITURE, 2020-2022 ($MILLION)
- FIGURE 60. HEXAGON AB: REVENUE SHARE BY REGION, 2022 (%)
- FIGURE 61. HEXAGON AB: REVENUE SHARE BY SEGMENT, 2022 (%)
- FIGURE 62. NV5 GLOBAL, INC.: NET REVENUE, 2020-2022 ($MILLION)
- FIGURE 63. NV5 GLOBAL, INC.: REVENUE SHARE BY SEGMENT, 2022 (%)
- FIGURE 64. NV5 GLOBAL, INC.: REVENUE SHARE BY REGION, 2022 (%)
- FIGURE 65. AIRBUS: NET REVENUE, 2020-2022 ($MILLION)
- FIGURE 66. AIRBUS: RESEARCH & DEVELOPMENT EXPENDITURE, 2020-2022 ($MILLION)
- FIGURE 67. AIRBUS: REVENUE SHARE BY SEGMENT, 2022 (%)
The Defense Geospatial System Market is expected to experience a significant growth rate of 11.4% from 2023-2032 owing to increasing demand of reconnaissance, and surveillance across the globe - Allied Market Research
The global defense geospatial market is segmented into technology, type, and application. By technology, the market is divided into geographic information system (GIS), global positioning system (GPS), and remote sensing. By type, the market is categorized into surface analysis, network analysis, and geo visualization. On the basis of application, the market is classified into military logistics, intelligence gathering and battlefield management. By region, the market is analyzed across North America, Europe, Asia-Pacific and LAMEA.
The growth drivers, restraints, and opportunities are explained in the report to better understand the market dynamics. This report further highlights the key areas of investment. In addition, it includes Porter's five forces analysis to understand the competitive scenario of the industry and role of each stakeholder.
Value chain analysis for this industry, which includes R&D, components manufacturers, assembly, programming & testing, marketing & sales, customers, and post-sales services, is explained in the report. In addition, the report features the strategies adopted by key market players to maintain their foothold in the market. Furthermore, it highlights the competitive landscape of the key players to increase their market share and sustain intense competition in the industry.
Key players analyzed in the report include Airbus, BlackSky, NV5 Global, Inc., Hexagon AB, Environmental Systems Research Institute, Inc. (ESRI), Trimble Inc., Maxar Technologies, MapLarge, Orbital Insight, and TerraGo.
Key Benefits For Stakeholders
- This report provides a quantitative analysis of the market segments, current trends, estimations, and dynamics of the defense geospatial market analysis from 2022 to 2032 to identify the prevailing defense geospatial market opportunities.
- The market research is offered along with information related to key drivers, restraints, and opportunities.
- Porter's five forces analysis highlights the potency of buyers and suppliers to enable stakeholders make profit-oriented business decisions and strengthen their supplier-buyer network.
- In-depth analysis of the defense geospatial market segmentation assists to determine the prevailing market opportunities.
- Major countries in each region are mapped according to their revenue contribution to the global market.
- Market player positioning facilitates benchmarking and provides a clear understanding of the present position of the market players.
- The report includes the analysis of the regional as well as global defense geospatial market trends, key players, market segments, application areas, and market growth strategies.
Additional benefits you will get with this purchase are:
- Quarterly Update and* (only available with a corporate license, on listed price)
- 5 additional Company Profile of client Choice pre- or Post-purchase, as a free update.
- Free Upcoming Version on the Purchase of Five and Enterprise User License.
- 16 analyst hours of support* (post-purchase, if you find additional data requirements upon review of the report, you may receive support amounting to 16 analyst hours to solve questions, and post-sale queries)
- 15% Free Customization* (in case the scope or segment of the report does not match your requirements, 20% is equivalent to 3 working days of free work, applicable once)
- Free data Pack on the Five and Enterprise User License. (Excel version of the report)
- Free Updated report if the report is 6-12 months old or older.
- 24-hour priority response*
- Free Industry updates and white papers.
Possible Customization with this report (with additional cost and timeline talk to the sales executive to know more)
- Additional company profiles with specific to client's interest
Key Market Segments
By Technology
- Geographic Information System (GIS)
- Global Positioning System (GPS)
- Remote Sensing
By Type
- Surface Analysis
- Network Analysis
- Geo Visualization
By Application
- Military logistics
- Intelligence gathering
- Battlefield management
By Region
- North America
- U.S.
- Canada
- Mexico
- Europe
- UK
- Germany
- France
- Italy
- Rest of Europe
- Asia-Pacific
- China
- Japan
- India
- South Korea
- Rest of Asia-Pacific
- LAMEA
- Latin America
- Middle East
- Africa
Key Market Players:
- Orbital Insights
- MapLarge
- Trimble Inc.
- Esri
- BlackSky
- TerraGo
- Maxar Technologies
- Hexagon AB
- Airbus
- NV5 Global, Inc.
TABLE OF CONTENTS
CHAPTER 1: INTRODUCTION
- 1.1. Report description
- 1.2. Key market segments
- 1.3. Key benefits to the stakeholders
- 1.4. Research Methodology
- 1.4.1. Primary research
- 1.4.2. Secondary research
- 1.4.3. Analyst tools and models
CHAPTER 2: EXECUTIVE SUMMARY
- 2.1. CXO Perspective
CHAPTER 3: MARKET OVERVIEW
- 3.1. Market definition and scope
- 3.2. Key findings
- 3.2.1. Top impacting factors
- 3.2.2. Top investment pockets
- 3.3. Porter's five forces analysis
- 3.3.1. Low bargaining power of suppliers
- 3.3.2. Low threat of new entrants
- 3.3.3. Low threat of substitutes
- 3.3.4. Low intensity of rivalry
- 3.3.5. Low bargaining power of buyers
- 3.4. Market dynamics
- 3.4.1. Drivers
- 3.4.1.1. Demand for Reconnaissance, and surveillance
- 3.4.1.2. Integration with other systems
- 3.4.1. Drivers
- 3.4.2. Restraints
- 3.4.2.1. Concern of Data Privacy and Protection
- 3.4.2.2. High Cost and lack of accessibility
- 3.4.3. Opportunities
- 3.4.3.1. AI combined with geospatial system
- 3.4.3.2. Use of AR and VR in defense Geospatial system
- 3.5. COVID-19 Impact Analysis on the market
CHAPTER 4: DEFENSE GEOSPATIAL MARKET, BY TECHNOLOGY
- 4.1. Overview
- 4.1.1. Market size and forecast
- 4.2. Geographic Information System (GIS)
- 4.2.1. Key market trends, growth factors and opportunities
- 4.2.2. Market size and forecast, by region
- 4.2.3. Market share analysis by country
- 4.3. Global Positioning System (GPS)
- 4.3.1. Key market trends, growth factors and opportunities
- 4.3.2. Market size and forecast, by region
- 4.3.3. Market share analysis by country
- 4.4. Remote Sensing
- 4.4.1. Key market trends, growth factors and opportunities
- 4.4.2. Market size and forecast, by region
- 4.4.3. Market share analysis by country
CHAPTER 5: DEFENSE GEOSPATIAL MARKET, BY TYPE
- 5.1. Overview
- 5.1.1. Market size and forecast
- 5.2. Surface Analysis
- 5.2.1. Key market trends, growth factors and opportunities
- 5.2.2. Market size and forecast, by region
- 5.2.3. Market share analysis by country
- 5.3. Network Analysis
- 5.3.1. Key market trends, growth factors and opportunities
- 5.3.2. Market size and forecast, by region
- 5.3.3. Market share analysis by country
- 5.4. Geo Visualization
- 5.4.1. Key market trends, growth factors and opportunities
- 5.4.2. Market size and forecast, by region
- 5.4.3. Market share analysis by country
CHAPTER 6: DEFENSE GEOSPATIAL MARKET, BY APPLICATION
- 6.1. Overview
- 6.1.1. Market size and forecast
- 6.2. Military logistics
- 6.2.1. Key market trends, growth factors and opportunities
- 6.2.2. Market size and forecast, by region
- 6.2.3. Market share analysis by country
- 6.3. Intelligence gathering
- 6.3.1. Key market trends, growth factors and opportunities
- 6.3.2. Market size and forecast, by region
- 6.3.3. Market share analysis by country
- 6.4. Battlefield management
- 6.4.1. Key market trends, growth factors and opportunities
- 6.4.2. Market size and forecast, by region
- 6.4.3. Market share analysis by country
CHAPTER 7: DEFENSE GEOSPATIAL MARKET, BY REGION
- 7.1. Overview
- 7.1.1. Market size and forecast By Region
- 7.2. North America
- 7.2.1. Key trends and opportunities
- 7.2.2. Market size and forecast, by Technology
- 7.2.3. Market size and forecast, by Type
- 7.2.4. Market size and forecast, by Application
- 7.2.5. Market size and forecast, by country
- 7.2.5.1. U.S.
- 7.2.5.1.1. Key market trends, growth factors and opportunities
- 7.2.5.1.2. Market size and forecast, by Technology
- 7.2.5.1.3. Market size and forecast, by Type
- 7.2.5.1.4. Market size and forecast, by Application
- 7.2.5.2. Canada
- 7.2.5.2.1. Key market trends, growth factors and opportunities
- 7.2.5.2.2. Market size and forecast, by Technology
- 7.2.5.2.3. Market size and forecast, by Type
- 7.2.5.2.4. Market size and forecast, by Application
- 7.2.5.3. Mexico
- 7.2.5.3.1. Key market trends, growth factors and opportunities
- 7.2.5.3.2. Market size and forecast, by Technology
- 7.2.5.3.3. Market size and forecast, by Type
- 7.2.5.3.4. Market size and forecast, by Application
- 7.3. Europe
- 7.3.1. Key trends and opportunities
- 7.3.2. Market size and forecast, by Technology
- 7.3.3. Market size and forecast, by Type
- 7.3.4. Market size and forecast, by Application
- 7.3.5. Market size and forecast, by country
- 7.3.5.1. UK
- 7.3.5.1.1. Key market trends, growth factors and opportunities
- 7.3.5.1.2. Market size and forecast, by Technology
- 7.3.5.1.3. Market size and forecast, by Type
- 7.3.5.1.4. Market size and forecast, by Application
- 7.3.5.2. Germany
- 7.3.5.2.1. Key market trends, growth factors and opportunities
- 7.3.5.2.2. Market size and forecast, by Technology
- 7.3.5.2.3. Market size and forecast, by Type
- 7.3.5.2.4. Market size and forecast, by Application
- 7.3.5.3. France
- 7.3.5.3.1. Key market trends, growth factors and opportunities
- 7.3.5.3.2. Market size and forecast, by Technology
- 7.3.5.3.3. Market size and forecast, by Type
- 7.3.5.3.4. Market size and forecast, by Application
- 7.3.5.4. Italy
- 7.3.5.4.1. Key market trends, growth factors and opportunities
- 7.3.5.4.2. Market size and forecast, by Technology
- 7.3.5.4.3. Market size and forecast, by Type
- 7.3.5.4.4. Market size and forecast, by Application
- 7.3.5.5. Rest of Europe
- 7.3.5.5.1. Key market trends, growth factors and opportunities
- 7.3.5.5.2. Market size and forecast, by Technology
- 7.3.5.5.3. Market size and forecast, by Type
- 7.3.5.5.4. Market size and forecast, by Application
- 7.4. Asia-Pacific
- 7.4.1. Key trends and opportunities
- 7.4.2. Market size and forecast, by Technology
- 7.4.3. Market size and forecast, by Type
- 7.4.4. Market size and forecast, by Application
- 7.4.5. Market size and forecast, by country
- 7.4.5.1. China
- 7.4.5.1.1. Key market trends, growth factors and opportunities
- 7.4.5.1.2. Market size and forecast, by Technology
- 7.4.5.1.3. Market size and forecast, by Type
- 7.4.5.1.4. Market size and forecast, by Application
- 7.4.5.2. Japan
- 7.4.5.2.1. Key market trends, growth factors and opportunities
- 7.4.5.2.2. Market size and forecast, by Technology
- 7.4.5.2.3. Market size and forecast, by Type
- 7.4.5.2.4. Market size and forecast, by Application
- 7.4.5.3. India
- 7.4.5.3.1. Key market trends, growth factors and opportunities
- 7.4.5.3.2. Market size and forecast, by Technology
- 7.4.5.3.3. Market size and forecast, by Type
- 7.4.5.3.4. Market size and forecast, by Application
- 7.4.5.4. South Korea
- 7.4.5.4.1. Key market trends, growth factors and opportunities
- 7.4.5.4.2. Market size and forecast, by Technology
- 7.4.5.4.3. Market size and forecast, by Type
- 7.4.5.4.4. Market size and forecast, by Application
- 7.4.5.5. Rest of Asia-Pacific
- 7.4.5.5.1. Key market trends, growth factors and opportunities
- 7.4.5.5.2. Market size and forecast, by Technology
- 7.4.5.5.3. Market size and forecast, by Type
- 7.4.5.5.4. Market size and forecast, by Application
- 7.5. LAMEA
- 7.5.1. Key trends and opportunities
- 7.5.2. Market size and forecast, by Technology
- 7.5.3. Market size and forecast, by Type
- 7.5.4. Market size and forecast, by Application
- 7.5.5. Market size and forecast, by country
- 7.5.5.1. Latin America
- 7.5.5.1.1. Key market trends, growth factors and opportunities
- 7.5.5.1.2. Market size and forecast, by Technology
- 7.5.5.1.3. Market size and forecast, by Type
- 7.5.5.1.4. Market size and forecast, by Application
- 7.5.5.2. Middle East
- 7.5.5.2.1. Key market trends, growth factors and opportunities
- 7.5.5.2.2. Market size and forecast, by Technology
- 7.5.5.2.3. Market size and forecast, by Type
- 7.5.5.2.4. Market size and forecast, by Application
- 7.5.5.3. Africa
- 7.5.5.3.1. Key market trends, growth factors and opportunities
- 7.5.5.3.2. Market size and forecast, by Technology
- 7.5.5.3.3. Market size and forecast, by Type
- 7.5.5.3.4. Market size and forecast, by Application
CHAPTER 8: COMPETITIVE LANDSCAPE
- 8.1. Introduction
- 8.2. Top winning strategies
- 8.3. Product Mapping of Top 10 Player
- 8.4. Competitive Dashboard
- 8.5. Competitive Heatmap
- 8.6. Top player positioning, 2022
CHAPTER 9: COMPANY PROFILES
- 9.1. TerraGo
- 9.1.1. Company overview
- 9.1.2. Key Executives
- 9.1.3. Company snapshot
- 9.1.4. Operating business segments
- 9.1.5. Product portfolio
- 9.2. BlackSky
- 9.2.1. Company overview
- 9.2.2. Key Executives
- 9.2.3. Company snapshot
- 9.2.4. Operating business segments
- 9.2.5. Product portfolio
- 9.2.6. Business performance
- 9.2.7. Key strategic moves and developments
- 9.3. Orbital Insights
- 9.3.1. Company overview
- 9.3.2. Key Executives
- 9.3.3. Company snapshot
- 9.3.4. Operating business segments
- 9.3.5. Product portfolio
- 9.4. MapLarge
- 9.4.1. Company overview
- 9.4.2. Key Executives
- 9.4.3. Company snapshot
- 9.4.4. Operating business segments
- 9.4.5. Product portfolio
- 9.5. Maxar Technologies
- 9.5.1. Company overview
- 9.5.2. Key Executives
- 9.5.3. Company snapshot
- 9.5.4. Operating business segments
- 9.5.5. Product portfolio
- 9.5.6. Business performance
- 9.5.7. Key strategic moves and developments
- 9.6. Trimble Inc.
- 9.6.1. Company overview
- 9.6.2. Key Executives
- 9.6.3. Company snapshot
- 9.6.4. Operating business segments
- 9.6.5. Product portfolio
- 9.6.6. Business performance
- 9.6.7. Key strategic moves and developments
- 9.7. Esri
- 9.7.1. Company overview
- 9.7.2. Key Executives
- 9.7.3. Company snapshot
- 9.7.4. Operating business segments
- 9.7.5. Product portfolio
- 9.7.6. Key strategic moves and developments
- 9.8. Hexagon AB
- 9.8.1. Company overview
- 9.8.2. Key Executives
- 9.8.3. Company snapshot
- 9.8.4. Operating business segments
- 9.8.5. Product portfolio
- 9.8.6. Business performance
- 9.8.7. Key strategic moves and developments
- 9.9. NV5 Global, Inc.
- 9.9.1. Company overview
- 9.9.2. Key Executives
- 9.9.3. Company snapshot
- 9.9.4. Operating business segments
- 9.9.5. Product portfolio
- 9.9.6. Business performance
- 9.9.7. Key strategic moves and developments
- 9.10. Airbus
- 9.10.1. Company overview
- 9.10.2. Key Executives
- 9.10.3. Company snapshot
- 9.10.4. Operating business segments
- 9.10.5. Product portfolio
- 9.10.6. Business performance
- 9.10.7. Key strategic moves and developments