
|
市場調査レポート
商品コード
1365616
抗血小板薬市場:薬剤クラス別、投与経路別、流通チャネル別:世界の機会分析と産業予測、2023-2032年Antiplatelet Market By Drug Class (Adenosine diphosphate receptor inhibitors, Irreversible inhibitors cyclooxygenase, Others), By Route of Administration, By Distribution Channel : Global Opportunity Analysis and Industry Forecast, 2023-2032 |
||||||
|
|||||||

| 抗血小板薬市場:薬剤クラス別、投与経路別、流通チャネル別:世界の機会分析と産業予測、2023-2032年 |
|
出版日: 2023年07月01日
発行: Allied Market Research
ページ情報: 英文 259 Pages
納期: 2~3営業日
|

- 全表示
- 概要
- 図表
- 目次
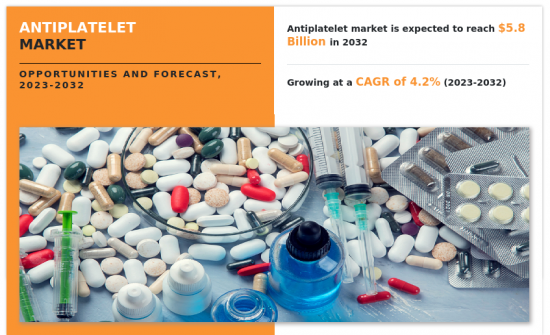
Allied Market Research発行の調査レポート「抗血小板市場」によると、抗血小板市場は2022年に38億米ドルと評価され、2023年から2032年にかけてCAGR 4.2%で成長し、2032年には58億米ドルに達すると推定されています。
血小板は、傷害後の出血を止めるプロセスである止血において重要な役割を果たしています。血管が損傷すると、血小板はその部位に付着して凝集し、血栓を形成して傷を塞ぐ。しかし、アテローム性動脈硬化症や不整脈などの特定の病状では、血栓が血管内で不適切に形成され、心臓発作や脳卒中を引き起こす閉塞につながることがあります。抗血小板薬は、血小板の活性化と凝集過程のさまざまな段階を阻害することによって作用します。一般的に使用されている抗血小板薬には、アスピリン、クロピドグレル、チカグレロル、プラスグレルなどがあります。これらの薬剤は、凝固経路に関与する特定の受容体や酵素を阻害することにより、血小板の活性化を阻害します。
抗血小板薬市場は、心臓発作や脳卒中などの心血管系疾患の有病率の増加などの要因により、予防・治療手段としての抗血小板薬の需要が高まり、市場の成長を促進しています。例えば、米国協会によると、2020年の脳卒中の有病率は全世界で8,910万人でした。また、虚血性脳卒中は6,820万人、脳内出血は1,890万人、くも膜下出血は810万人です。このように、心血管疾患の増加は抗血小板薬の需要を高め、市場の成長を促進します。
目次
第1章 イントロダクション
第2章 エグゼクティブサマリー
第3章 市場概要
- 市場の定義と範囲
- 主な調査結果
- 影響要因
- 主な投資機会
- ポーターのファイブフォース分析
- 市場力学
- 促進要因
- 心血管疾患の有病率の上昇
- 研究開発活動の増加
- 老人人口の増加
- 抑制要因
- 抗血小板薬の副作用
- 機会
- 新興市場における成長機会
- 促進要因
- COVID-19市場への影響分析
第4章 抗血小板薬市場:薬剤クラス別
- 概要
- アデノシン二リン酸(ADP)受容体阻害薬
- 非可逆的シクロオキシゲナーゼ阻害薬
- その他
第5章 抗IPLATELET市場:投与経路別
- 概要
- 経口剤
- 注射剤
第6章 アンチプラテレット市場:流通経路別
- 概要
- 病院薬局
- ドラッグストアおよび小売薬局
- オンラインプロバイダー
第7章 アンティプラ市場アンチプラテレ-ト市場:地域別
- 概要
- 北米
- 米国
- カナダ
- メキシコ
- 欧州
- ドイツ
- フランス
- 英国
- イタリア
- スペイン
- その他
- アジア太平洋
- 日本
- 中国
- インド
- オーストラリア
- 韓国
- その他
- ラテンアメリカ・中東・アフリカ
- ブラジル
- サウジアラビア
- 南アフリカ
- その他
第8章 競争情勢
- イントロダクション
- 主要成功戦略
- 主要10企業の製品マッピング
- 競合ダッシュボード
- 競合ヒートマップ
- 主要企業のポジショニング、2022年
第9章 企業プロファイル
- AstraZeneca plc
- Bayer AG
- Eli Lilly and Company.
- Otsuka Pharmaceutical Co., Ltd.
- Sanofi S.A.
- Glenmark Pharmaceuticals Limited
- Cipla Ltd.
- Lupin
- Daiichi Sankyo Company Limited
- Chiesi Farmaceutici S.p.A.
LIST OF TABLES
- TABLE 01. GLOBAL ANTIPLATELET MARKET, BY DRUG CLASS, 2022-2032 ($MILLION)
- TABLE 02. ANTIPLATELET MARKET FOR ADENOSINE DIPHOSPHATE (ADP) RECEPTOR INHIBITORS, BY REGION, 2022-2032 ($MILLION)
- TABLE 03. ANTIPLATELET MARKET FOR IRREVERSIBLE INHIBITORS CYCLOOXYGENASE, BY REGION, 2022-2032 ($MILLION)
- TABLE 04. ANTIPLATELET MARKET FOR OTHERS, BY REGION, 2022-2032 ($MILLION)
- TABLE 05. GLOBAL ANTIPLATELET MARKET, BY ROUTE OF ADMINISTRATION, 2022-2032 ($MILLION)
- TABLE 06. ANTIPLATELET MARKET FOR ORAL, BY REGION, 2022-2032 ($MILLION)
- TABLE 07. ANTIPLATELET MARKET FOR INJECTABLE, BY REGION, 2022-2032 ($MILLION)
- TABLE 08. GLOBAL ANTIPLATELET MARKET, BY DISTRIBUTION CHANNEL, 2022-2032 ($MILLION)
- TABLE 09. ANTIPLATELET MARKET FOR HOSPITAL PHARMACIES, BY REGION, 2022-2032 ($MILLION)
- TABLE 10. ANTIPLATELET MARKET FOR DRUG STORE AND RETAIL PHARMACIES, BY REGION, 2022-2032 ($MILLION)
- TABLE 11. ANTIPLATELET MARKET FOR ONLINE PROVIDERS, BY REGION, 2022-2032 ($MILLION)
- TABLE 12. ANTIPLATELET MARKET, BY REGION, 2022-2032 ($MILLION)
- TABLE 13. NORTH AMERICA ANTIPLATELET MARKET, BY DRUG CLASS, 2022-2032 ($MILLION)
- TABLE 14. NORTH AMERICA ANTIPLATELET MARKET, BY ROUTE OF ADMINISTRATION, 2022-2032 ($MILLION)
- TABLE 15. NORTH AMERICA ANTIPLATELET MARKET, BY DISTRIBUTION CHANNEL, 2022-2032 ($MILLION)
- TABLE 16. NORTH AMERICA ANTIPLATELET MARKET, BY COUNTRY, 2022-2032 ($MILLION)
- TABLE 17. U.S. ANTIPLATELET MARKET, BY DRUG CLASS, 2022-2032 ($MILLION)
- TABLE 18. U.S. ANTIPLATELET MARKET, BY ROUTE OF ADMINISTRATION, 2022-2032 ($MILLION)
- TABLE 19. U.S. ANTIPLATELET MARKET, BY DISTRIBUTION CHANNEL, 2022-2032 ($MILLION)
- TABLE 20. CANADA ANTIPLATELET MARKET, BY DRUG CLASS, 2022-2032 ($MILLION)
- TABLE 21. CANADA ANTIPLATELET MARKET, BY ROUTE OF ADMINISTRATION, 2022-2032 ($MILLION)
- TABLE 22. CANADA ANTIPLATELET MARKET, BY DISTRIBUTION CHANNEL, 2022-2032 ($MILLION)
- TABLE 23. MEXICO ANTIPLATELET MARKET, BY DRUG CLASS, 2022-2032 ($MILLION)
- TABLE 24. MEXICO ANTIPLATELET MARKET, BY ROUTE OF ADMINISTRATION, 2022-2032 ($MILLION)
- TABLE 25. MEXICO ANTIPLATELET MARKET, BY DISTRIBUTION CHANNEL, 2022-2032 ($MILLION)
- TABLE 26. EUROPE ANTIPLATELET MARKET, BY DRUG CLASS, 2022-2032 ($MILLION)
- TABLE 27. EUROPE ANTIPLATELET MARKET, BY ROUTE OF ADMINISTRATION, 2022-2032 ($MILLION)
- TABLE 28. EUROPE ANTIPLATELET MARKET, BY DISTRIBUTION CHANNEL, 2022-2032 ($MILLION)
- TABLE 29. EUROPE ANTIPLATELET MARKET, BY COUNTRY, 2022-2032 ($MILLION)
- TABLE 30. GERMANY ANTIPLATELET MARKET, BY DRUG CLASS, 2022-2032 ($MILLION)
- TABLE 31. GERMANY ANTIPLATELET MARKET, BY ROUTE OF ADMINISTRATION, 2022-2032 ($MILLION)
- TABLE 32. GERMANY ANTIPLATELET MARKET, BY DISTRIBUTION CHANNEL, 2022-2032 ($MILLION)
- TABLE 33. FRANCE ANTIPLATELET MARKET, BY DRUG CLASS, 2022-2032 ($MILLION)
- TABLE 34. FRANCE ANTIPLATELET MARKET, BY ROUTE OF ADMINISTRATION, 2022-2032 ($MILLION)
- TABLE 35. FRANCE ANTIPLATELET MARKET, BY DISTRIBUTION CHANNEL, 2022-2032 ($MILLION)
- TABLE 36. UK ANTIPLATELET MARKET, BY DRUG CLASS, 2022-2032 ($MILLION)
- TABLE 37. UK ANTIPLATELET MARKET, BY ROUTE OF ADMINISTRATION, 2022-2032 ($MILLION)
- TABLE 38. UK ANTIPLATELET MARKET, BY DISTRIBUTION CHANNEL, 2022-2032 ($MILLION)
- TABLE 39. ITALY ANTIPLATELET MARKET, BY DRUG CLASS, 2022-2032 ($MILLION)
- TABLE 40. ITALY ANTIPLATELET MARKET, BY ROUTE OF ADMINISTRATION, 2022-2032 ($MILLION)
- TABLE 41. ITALY ANTIPLATELET MARKET, BY DISTRIBUTION CHANNEL, 2022-2032 ($MILLION)
- TABLE 42. SPAIN ANTIPLATELET MARKET, BY DRUG CLASS, 2022-2032 ($MILLION)
- TABLE 43. SPAIN ANTIPLATELET MARKET, BY ROUTE OF ADMINISTRATION, 2022-2032 ($MILLION)
- TABLE 44. SPAIN ANTIPLATELET MARKET, BY DISTRIBUTION CHANNEL, 2022-2032 ($MILLION)
- TABLE 45. REST OF EUROPE ANTIPLATELET MARKET, BY DRUG CLASS, 2022-2032 ($MILLION)
- TABLE 46. REST OF EUROPE ANTIPLATELET MARKET, BY ROUTE OF ADMINISTRATION, 2022-2032 ($MILLION)
- TABLE 47. REST OF EUROPE ANTIPLATELET MARKET, BY DISTRIBUTION CHANNEL, 2022-2032 ($MILLION)
- TABLE 48. ASIA-PACIFIC ANTIPLATELET MARKET, BY DRUG CLASS, 2022-2032 ($MILLION)
- TABLE 49. ASIA-PACIFIC ANTIPLATELET MARKET, BY ROUTE OF ADMINISTRATION, 2022-2032 ($MILLION)
- TABLE 50. ASIA-PACIFIC ANTIPLATELET MARKET, BY DISTRIBUTION CHANNEL, 2022-2032 ($MILLION)
- TABLE 51. ASIA-PACIFIC ANTIPLATELET MARKET, BY COUNTRY, 2022-2032 ($MILLION)
- TABLE 52. JAPAN ANTIPLATELET MARKET, BY DRUG CLASS, 2022-2032 ($MILLION)
- TABLE 53. JAPAN ANTIPLATELET MARKET, BY ROUTE OF ADMINISTRATION, 2022-2032 ($MILLION)
- TABLE 54. JAPAN ANTIPLATELET MARKET, BY DISTRIBUTION CHANNEL, 2022-2032 ($MILLION)
- TABLE 55. CHINA ANTIPLATELET MARKET, BY DRUG CLASS, 2022-2032 ($MILLION)
- TABLE 56. CHINA ANTIPLATELET MARKET, BY ROUTE OF ADMINISTRATION, 2022-2032 ($MILLION)
- TABLE 57. CHINA ANTIPLATELET MARKET, BY DISTRIBUTION CHANNEL, 2022-2032 ($MILLION)
- TABLE 58. INDIA ANTIPLATELET MARKET, BY DRUG CLASS, 2022-2032 ($MILLION)
- TABLE 59. INDIA ANTIPLATELET MARKET, BY ROUTE OF ADMINISTRATION, 2022-2032 ($MILLION)
- TABLE 60. INDIA ANTIPLATELET MARKET, BY DISTRIBUTION CHANNEL, 2022-2032 ($MILLION)
- TABLE 61. AUSTRALIA ANTIPLATELET MARKET, BY DRUG CLASS, 2022-2032 ($MILLION)
- TABLE 62. AUSTRALIA ANTIPLATELET MARKET, BY ROUTE OF ADMINISTRATION, 2022-2032 ($MILLION)
- TABLE 63. AUSTRALIA ANTIPLATELET MARKET, BY DISTRIBUTION CHANNEL, 2022-2032 ($MILLION)
- TABLE 64. SOUTH KOREA ANTIPLATELET MARKET, BY DRUG CLASS, 2022-2032 ($MILLION)
- TABLE 65. SOUTH KOREA ANTIPLATELET MARKET, BY ROUTE OF ADMINISTRATION, 2022-2032 ($MILLION)
- TABLE 66. SOUTH KOREA ANTIPLATELET MARKET, BY DISTRIBUTION CHANNEL, 2022-2032 ($MILLION)
- TABLE 67. REST OF ASIA-PACIFIC ANTIPLATELET MARKET, BY DRUG CLASS, 2022-2032 ($MILLION)
- TABLE 68. REST OF ASIA-PACIFIC ANTIPLATELET MARKET, BY ROUTE OF ADMINISTRATION, 2022-2032 ($MILLION)
- TABLE 69. REST OF ASIA-PACIFIC ANTIPLATELET MARKET, BY DISTRIBUTION CHANNEL, 2022-2032 ($MILLION)
- TABLE 70. LAMEA ANTIPLATELET MARKET, BY DRUG CLASS, 2022-2032 ($MILLION)
- TABLE 71. LAMEA ANTIPLATELET MARKET, BY ROUTE OF ADMINISTRATION, 2022-2032 ($MILLION)
- TABLE 72. LAMEA ANTIPLATELET MARKET, BY DISTRIBUTION CHANNEL, 2022-2032 ($MILLION)
- TABLE 73. LAMEA ANTIPLATELET MARKET, BY COUNTRY, 2022-2032 ($MILLION)
- TABLE 74. BRAZIL ANTIPLATELET MARKET, BY DRUG CLASS, 2022-2032 ($MILLION)
- TABLE 75. BRAZIL ANTIPLATELET MARKET, BY ROUTE OF ADMINISTRATION, 2022-2032 ($MILLION)
- TABLE 76. BRAZIL ANTIPLATELET MARKET, BY DISTRIBUTION CHANNEL, 2022-2032 ($MILLION)
- TABLE 77. SAUDI ARABIA ANTIPLATELET MARKET, BY DRUG CLASS, 2022-2032 ($MILLION)
- TABLE 78. SAUDI ARABIA ANTIPLATELET MARKET, BY ROUTE OF ADMINISTRATION, 2022-2032 ($MILLION)
- TABLE 79. SAUDI ARABIA ANTIPLATELET MARKET, BY DISTRIBUTION CHANNEL, 2022-2032 ($MILLION)
- TABLE 80. SOUTH AFRICA ANTIPLATELET MARKET, BY DRUG CLASS, 2022-2032 ($MILLION)
- TABLE 81. SOUTH AFRICA ANTIPLATELET MARKET, BY ROUTE OF ADMINISTRATION, 2022-2032 ($MILLION)
- TABLE 82. SOUTH AFRICA ANTIPLATELET MARKET, BY DISTRIBUTION CHANNEL, 2022-2032 ($MILLION)
- TABLE 83. REST OF LAMEA ANTIPLATELET MARKET, BY DRUG CLASS, 2022-2032 ($MILLION)
- TABLE 84. REST OF LAMEA ANTIPLATELET MARKET, BY ROUTE OF ADMINISTRATION, 2022-2032 ($MILLION)
- TABLE 85. REST OF LAMEA ANTIPLATELET MARKET, BY DISTRIBUTION CHANNEL, 2022-2032 ($MILLION)
- TABLE 86. ASTRAZENECA PLC: KEY EXECUTIVES
- TABLE 87. ASTRAZENECA PLC: COMPANY SNAPSHOT
- TABLE 88. ASTRAZENECA PLC: PRODUCT SEGMENTS
- TABLE 89. ASTRAZENECA PLC: PRODUCT PORTFOLIO
- TABLE 90. ASTRAZENECA PLC: KEY STRATERGIES
- TABLE 91. BAYER AG: KEY EXECUTIVES
- TABLE 92. BAYER AG: COMPANY SNAPSHOT
- TABLE 93. BAYER AG: PRODUCT SEGMENTS
- TABLE 94. BAYER AG: PRODUCT PORTFOLIO
- TABLE 95. ELI LILLY AND COMPANY.: KEY EXECUTIVES
- TABLE 96. ELI LILLY AND COMPANY.: COMPANY SNAPSHOT
- TABLE 97. ELI LILLY AND COMPANY.: PRODUCT SEGMENTS
- TABLE 98. ELI LILLY AND COMPANY.: PRODUCT PORTFOLIO
- TABLE 99. OTSUKA PHARMACEUTICAL CO., LTD.: KEY EXECUTIVES
- TABLE 100. OTSUKA PHARMACEUTICAL CO., LTD.: COMPANY SNAPSHOT
- TABLE 101. OTSUKA PHARMACEUTICAL CO., LTD.: PRODUCT SEGMENTS
- TABLE 102. OTSUKA PHARMACEUTICAL CO., LTD.: PRODUCT PORTFOLIO
- TABLE 103. SANOFI S.A.: KEY EXECUTIVES
- TABLE 104. SANOFI S.A.: COMPANY SNAPSHOT
- TABLE 105. SANOFI S.A.: PRODUCT SEGMENTS
- TABLE 106. SANOFI S.A.: PRODUCT PORTFOLIO
- TABLE 107. GLENMARK PHARMACEUTICALS LIMITED: KEY EXECUTIVES
- TABLE 108. GLENMARK PHARMACEUTICALS LIMITED: COMPANY SNAPSHOT
- TABLE 109. GLENMARK PHARMACEUTICALS LIMITED: PRODUCT SEGMENTS
- TABLE 110. GLENMARK PHARMACEUTICALS LIMITED: PRODUCT PORTFOLIO
- TABLE 111. CIPLA LTD.: KEY EXECUTIVES
- TABLE 112. CIPLA LTD.: COMPANY SNAPSHOT
- TABLE 113. CIPLA LTD.: PRODUCT SEGMENTS
- TABLE 114. CIPLA LTD.: PRODUCT PORTFOLIO
- TABLE 115. LUPIN: KEY EXECUTIVES
- TABLE 116. LUPIN: COMPANY SNAPSHOT
- TABLE 117. LUPIN: PRODUCT SEGMENTS
- TABLE 118. LUPIN: PRODUCT PORTFOLIO
- TABLE 119. DAIICHI SANKYO COMPANY LIMITED: KEY EXECUTIVES
- TABLE 120. DAIICHI SANKYO COMPANY LIMITED: COMPANY SNAPSHOT
- TABLE 121. DAIICHI SANKYO COMPANY LIMITED: PRODUCT SEGMENTS
- TABLE 122. DAIICHI SANKYO COMPANY LIMITED: PRODUCT PORTFOLIO
- TABLE 123. CHIESI FARMACEUTICI S.P.A.: KEY EXECUTIVES
- TABLE 124. CHIESI FARMACEUTICI S.P.A.: COMPANY SNAPSHOT
- TABLE 125. CHIESI FARMACEUTICI S.P.A.: PRODUCT SEGMENTS
- TABLE 126. CHIESI FARMACEUTICI S.P.A.: PRODUCT PORTFOLIO
LIST OF FIGURES
- FIGURE 01. ANTIPLATELET MARKET, 2022-2032
- FIGURE 02. SEGMENTATION OF ANTIPLATELET MARKET,2022-2032
- FIGURE 03. TOP INVESTMENT POCKETS IN ANTIPLATELET MARKET (2023-2032)
- FIGURE 04. HIGH BARGAINING POWER OF SUPPLIERS
- FIGURE 05. MODERATE THREAT OF NEW ENTRANTS
- FIGURE 06. MODERATE THREAT OF SUBSTITUTES
- FIGURE 07. MODERATE INTENSITY OF RIVALRY
- FIGURE 08. MODERATE BARGAINING POWER OF BUYERS
- FIGURE 09. GLOBAL ANTIPLATELET MARKET:DRIVERS, RESTRAINTS AND OPPORTUNITIES
- FIGURE 10. ANTIPLATELET MARKET, BY DRUG CLASS, 2022(%)
- FIGURE 11. COMPARATIVE SHARE ANALYSIS OF ANTIPLATELET MARKET FOR ADENOSINE DIPHOSPHATE (ADP) RECEPTOR INHIBITORS, BY COUNTRY 2022 AND 2032(%)
- FIGURE 12. COMPARATIVE SHARE ANALYSIS OF ANTIPLATELET MARKET FOR IRREVERSIBLE INHIBITORS CYCLOOXYGENASE, BY COUNTRY 2022 AND 2032(%)
- FIGURE 13. COMPARATIVE SHARE ANALYSIS OF ANTIPLATELET MARKET FOR OTHERS, BY COUNTRY 2022 AND 2032(%)
- FIGURE 14. ANTIPLATELET MARKET, BY ROUTE OF ADMINISTRATION, 2022(%)
- FIGURE 15. COMPARATIVE SHARE ANALYSIS OF ANTIPLATELET MARKET FOR ORAL, BY COUNTRY 2022 AND 2032(%)
- FIGURE 16. COMPARATIVE SHARE ANALYSIS OF ANTIPLATELET MARKET FOR INJECTABLE, BY COUNTRY 2022 AND 2032(%)
- FIGURE 17. ANTIPLATELET MARKET, BY DISTRIBUTION CHANNEL, 2022(%)
- FIGURE 18. COMPARATIVE SHARE ANALYSIS OF ANTIPLATELET MARKET FOR HOSPITAL PHARMACIES, BY COUNTRY 2022 AND 2032(%)
- FIGURE 19. COMPARATIVE SHARE ANALYSIS OF ANTIPLATELET MARKET FOR DRUG STORE AND RETAIL PHARMACIES, BY COUNTRY 2022 AND 2032(%)
- FIGURE 20. COMPARATIVE SHARE ANALYSIS OF ANTIPLATELET MARKET FOR ONLINE PROVIDERS, BY COUNTRY 2022 AND 2032(%)
- FIGURE 21. ANTIPLATELET MARKET BY REGION, 2022(%)
- FIGURE 22. U.S. ANTIPLATELET MARKET, 2022-2032 ($MILLION)
- FIGURE 23. CANADA ANTIPLATELET MARKET, 2022-2032 ($MILLION)
- FIGURE 24. MEXICO ANTIPLATELET MARKET, 2022-2032 ($MILLION)
- FIGURE 25. GERMANY ANTIPLATELET MARKET, 2022-2032 ($MILLION)
- FIGURE 26. FRANCE ANTIPLATELET MARKET, 2022-2032 ($MILLION)
- FIGURE 27. UK ANTIPLATELET MARKET, 2022-2032 ($MILLION)
- FIGURE 28. ITALY ANTIPLATELET MARKET, 2022-2032 ($MILLION)
- FIGURE 29. SPAIN ANTIPLATELET MARKET, 2022-2032 ($MILLION)
- FIGURE 30. REST OF EUROPE ANTIPLATELET MARKET, 2022-2032 ($MILLION)
- FIGURE 31. JAPAN ANTIPLATELET MARKET, 2022-2032 ($MILLION)
- FIGURE 32. CHINA ANTIPLATELET MARKET, 2022-2032 ($MILLION)
- FIGURE 33. INDIA ANTIPLATELET MARKET, 2022-2032 ($MILLION)
- FIGURE 34. AUSTRALIA ANTIPLATELET MARKET, 2022-2032 ($MILLION)
- FIGURE 35. SOUTH KOREA ANTIPLATELET MARKET, 2022-2032 ($MILLION)
- FIGURE 36. REST OF ASIA-PACIFIC ANTIPLATELET MARKET, 2022-2032 ($MILLION)
- FIGURE 37. BRAZIL ANTIPLATELET MARKET, 2022-2032 ($MILLION)
- FIGURE 38. SAUDI ARABIA ANTIPLATELET MARKET, 2022-2032 ($MILLION)
- FIGURE 39. SOUTH AFRICA ANTIPLATELET MARKET, 2022-2032 ($MILLION)
- FIGURE 40. REST OF LAMEA ANTIPLATELET MARKET, 2022-2032 ($MILLION)
- FIGURE 41. TOP WINNING STRATEGIES, BY YEAR
- FIGURE 42. TOP WINNING STRATEGIES, BY DEVELOPMENT
- FIGURE 43. TOP WINNING STRATEGIES, BY COMPANY
- FIGURE 44. PRODUCT MAPPING OF TOP 10 PLAYERS
- FIGURE 45. COMPETITIVE DASHBOARD
- FIGURE 46. COMPETITIVE HEATMAP: ANTIPLATELET MARKET
- FIGURE 47. TOP PLAYER POSITIONING, 2022
- FIGURE 48. ASTRAZENECA PLC: NET REVENUE, 2020-2022 ($MILLION)
- FIGURE 49. ASTRAZENECA PLC: REVENUE SHARE BY REGION, 2022 (%)
- FIGURE 50. BAYER AG: NET SALES, 2020-2022 ($MILLION)
- FIGURE 51. BAYER AG: REVENUE SHARE BY SEGMENT, 2022 (%)
- FIGURE 52. BAYER AG: REVENUE SHARE BY REGION, 2022 (%)
- FIGURE 53. ELI LILLY AND COMPANY: NET REVENUE, 2020-2022 ($MILLION)
- FIGURE 54. ELI LILLY AND COMPANY: REVENUE SHARE BY REGION, 2022 (%)
- FIGURE 55. SANOFI S.A.: NET SALES, 2020-2022 ($MILLION)
- FIGURE 56. SANOFI S.A.: REVENUE SHARE BY SEGMENT, 2022 (%)
- FIGURE 57. SANOFI S.A.: REVENUE SHARE BY REGION, 2022 (%)
- FIGURE 58. GLENMARK PHARMACEUTICALS LIMITED: NET REVENUE, 2020-2022 ($MILLION)
- FIGURE 59. GLENMARK PHARMACEUTICALS LIMITED: REVENUE SHARE BY REGION, 2022 (%)
- FIGURE 60. CIPLA LTD.: SALES REVENUE, 2020-2022 ($MILLION)
- FIGURE 61. CIPLA LTD.: REVENUE SHARE BY SEGMENT, 2022 (%)
- FIGURE 62. CIPLA LTD.: REVENUE SHARE BY REGION, 2022 (%)
- FIGURE 63. LUPIN: NET SALES, 2020-2022 ($MILLION)
- FIGURE 64. LUPIN: REVENUE SHARE BY REGION, 2022 (%)
- FIGURE 65. DAIICHI SANKYO COMPANY LIMITED: NET REVENUE, 2020-2022 ($MILLION)
- FIGURE 66. CHIESI FARMACEUTICI S.P.A.: NET REVENUE, 2019-2021 ($MILLION)
- FIGURE 67. CHIESI FARMACEUTICI S.P.A.: REVENUE SHARE BY SEGMENT, 2021 (%)
According to a new report published by Allied Market Research, titled, "Antiplatelet Market," The antiplatelet market was valued at $3.8 billion in 2022, and is estimated to reach $5.8 billion by 2032, growing at a CAGR of 4.2% from 2023 to 2032.
Platelets play a crucial role in hemostasis, the process that stops bleeding after an injury. When a blood vessel is damaged, platelets adhere to the site and aggregate together, forming a clot that helps seal the injury. However, in certain medical conditions, such as atherosclerosis or irregular heart rhythms, blood clots can form within blood vessels inappropriately, leading to blockages that may result in heart attacks or strokes. Antiplatelet drugs work by interfering with different steps in the platelet activation and aggregation process. Some commonly used antiplatelet medications include aspirin, clopidogrel, ticagrelor, and prasugrel. These drugs inhibit platelet activation by blocking specific receptors or enzymes involved in the clotting pathway.
The antiplatelets market is driven by factors such as the increase in prevalence of cardiovascular diseases, such as heart attacks and stroke that drives the demand for antiplatelet drugs as a preventive and treatment measure thereby propelling the market growth. For instance, according to the American Association, the prevalence of stroke in 2020 was 89.1 million people across the globe. In addition, the ischemic stroke was 68.2 million, that of intracerebral hemorrhage was 18.9 million, and that of subarachnoid hemorrhage was 8.1 million across the globe. Thus, rise in the cases of cardiovascular diseases drives the demand for antiplatelet drugs and propels the market growth.
In addition, ongoing R&D efforts in the field of antiplatelet drugs lead to the discovery of novel agents with enhanced efficacy and safety profiles. The introduction of new and improved drugs stimulates market growth and attracts investment in the sector. For instance, Lee's Pharmaceutical Limited is conducting a phase 1 clinical trial to investigate the tolerability, safety, and pharmacokinetics of Anfibatate.
Furthermore, percutaneous coronary intervention (PCI), commonly known as angioplasty, is a surgical procedure used to treat coronary artery disease. Antiplatelet medications play a crucial role in PCI procedures, both during and after the intervention. Thus, the surge in usage of antiplatelet drugs in percutaneous coronary intervention contributes to the expansion of the antiplatelet market.
The antiplatelet market is segmented into drug class, route of administration, distribution channel, and region. As per drug class, the market is segregated into adenosine diphosphate (ADP) receptor inhibitors, irreversible inhibitors cyclooxygenase, and others. By route of administration, it is categorized into oral and injectable. Depending on distribution channel, the market is categorized into hospital pharmacies, drug stores & retail pharmacies, and online providers. Region wise, the market is analyzed across North America (the U.S., Canada, and Mexico), Europe (Germany, France, the UK, Italy, Spain, and rest of Europe), Asia-Pacific (Japan, China, Australia, India, South Korea, and rest of Asia-Pacific), and LAMEA (Brazil, South Africa, Saudi Arabia, and rest of LAMEA).
Major key players that operate in the antiplatelet market are AstraZeneca plc, Bayer AG, Eli Lilly and Company, Glenmark Pharmaceuticals Limited, Cipla Ltd., Otsuka Pharmaceutical Co., Ltd., Lupin, Sanofi S.A., Daiichi Sankyo Company Limited, and Chiesi Farmaceutici S.p.A. Key players operating in the market have adopted product approval as their key strategies to expand their product portfolio.
Key Benefits For Stakeholders
- This report provides a quantitative analysis of the market segments, current trends, estimations, and dynamics of the antiplatelet market analysis from 2022 to 2032 to identify the prevailing antiplatelet market opportunities.
- The market research is offered along with information related to key drivers, restraints, and opportunities.
- Porter's five forces analysis highlights the potency of buyers and suppliers to enable stakeholders make profit-oriented business decisions and strengthen their supplier-buyer network.
- In-depth analysis of the antiplatelet market segmentation assists to determine the prevailing market opportunities.
- Major countries in each region are mapped according to their revenue contribution to the global market.
- Market player positioning facilitates benchmarking and provides a clear understanding of the present position of the market players.
- The report includes the analysis of the regional as well as global antiplatelet market trends, key players, market segments, application areas, and market growth strategies.
Additional benefits you will get with this purchase are:
- Quarterly Update and* (only available with a corporate license, on listed price)
- 5 additional Company Profile of client Choice pre- or Post-purchase, as a free update.
- Free Upcoming Version on the Purchase of Five and Enterprise User License.
- 16 analyst hours of support* (post-purchase, if you find additional data requirements upon review of the report, you may receive support amounting to 16 analyst hours to solve questions, and post-sale queries)
- 15% Free Customization* (in case the scope or segment of the report does not match your requirements, 20% is equivalent to 3 working days of free work, applicable once)
- Free data Pack on the Five and Enterprise User License. (Excel version of the report)
- Free Updated report if the report is 6-12 months old or older.
- 24-hour priority response*
- Free Industry updates and white papers.
Possible Customization with this report (with additional cost and timeline talk to the sales executive to know more)
- New Product Development/ Product Matrix of Key Players
- Patient/epidemiology data at country, region, global level
- Regulatory Guidelines
- Additional company profiles with specific to client's interest
- Additional country or region analysis- market size and forecast
- Expanded list for Company Profiles
- Historic market data
- SWOT Analysis
Key Market Segments
By Drug Class
- Adenosine diphosphate (ADP) receptor inhibitors
- Irreversible inhibitors cyclooxygenase
- Others
By Route of Administration
- Oral
- Injectable
By Distribution Channel
- Hospital pharmacies
- Drug store and retail pharmacies
- Online providers
By Region
- North America
- U.S.
- Canada
- Mexico
- Europe
- Germany
- France
- UK
- Italy
- Spain
- Rest of Europe
- Asia-Pacific
- Japan
- China
- India
- Australia
- South Korea
- Rest of Asia-Pacific
- LAMEA
- Brazil
- Saudi Arabia
- South Africa
- Rest of LAMEA
Key Market Players:
- Sanofi S.A.
- Glenmark Pharmaceuticals Limited
- Cipla Ltd.
- Lupin
- Bayer AG
- Otsuka Pharmaceutical Co., Ltd.
- Daiichi Sankyo Company Limited
- Chiesi Farmaceutici S.p.A.
- AstraZeneca plc
- Eli Lilly and Company.
TABLE OF CONTENTS
CHAPTER 1: INTRODUCTION
- 1.1. Report description
- 1.2. Key market segments
- 1.3. Key benefits to the stakeholders
- 1.4. Research Methodology
- 1.4.1. Primary research
- 1.4.2. Secondary research
- 1.4.3. Analyst tools and models
CHAPTER 2: EXECUTIVE SUMMARY
- 2.1. CXO Perspective
CHAPTER 3: MARKET OVERVIEW
- 3.1. Market definition and scope
- 3.2. Key findings
- 3.2.1. Top impacting factors
- 3.2.2. Top investment pockets
- 3.3. Porter's five forces analysis
- 3.3.1. High bargaining power of suppliers
- 3.3.2. Moderate threat of new entrants
- 3.3.3. Moderate threat of substitutes
- 3.3.4. Moderate intensity of rivalry
- 3.3.5. Moderate bargaining power of buyers
- 3.4. Market dynamics
- 3.4.1. Drivers
- 3.4.1.1. Rise in prevalence of cardiovascular diseases
- 3.4.1.2. Rise in R&D activities
- 3.4.1.3. Rise in geriatric population
- 3.4.1. Drivers
- 3.4.2. Restraints
- 3.4.2.1. Side effects of antiplatelets
- 3.4.3. Opportunities
- 3.4.3.1. Growth opportunities in emerging markets
- 3.5. COVID-19 Impact Analysis on the market
CHAPTER 4: ANTIPLATELET MARKET, BY DRUG CLASS
- 4.1. Overview
- 4.1.1. Market size and forecast
- 4.2. Adenosine diphosphate (ADP) receptor inhibitors
- 4.2.1. Key market trends, growth factors and opportunities
- 4.2.2. Market size and forecast, by region
- 4.2.3. Market share analysis by country
- 4.3. Irreversible inhibitors cyclooxygenase
- 4.3.1. Key market trends, growth factors and opportunities
- 4.3.2. Market size and forecast, by region
- 4.3.3. Market share analysis by country
- 4.4. Others
- 4.4.1. Key market trends, growth factors and opportunities
- 4.4.2. Market size and forecast, by region
- 4.4.3. Market share analysis by country
CHAPTER 5: ANTIPLATELET MARKET, BY ROUTE OF ADMINISTRATION
- 5.1. Overview
- 5.1.1. Market size and forecast
- 5.2. Oral
- 5.2.1. Key market trends, growth factors and opportunities
- 5.2.2. Market size and forecast, by region
- 5.2.3. Market share analysis by country
- 5.3. Injectable
- 5.3.1. Key market trends, growth factors and opportunities
- 5.3.2. Market size and forecast, by region
- 5.3.3. Market share analysis by country
CHAPTER 6: ANTIPLATELET MARKET, BY DISTRIBUTION CHANNEL
- 6.1. Overview
- 6.1.1. Market size and forecast
- 6.2. Hospital pharmacies
- 6.2.1. Key market trends, growth factors and opportunities
- 6.2.2. Market size and forecast, by region
- 6.2.3. Market share analysis by country
- 6.3. Drug store and retail pharmacies
- 6.3.1. Key market trends, growth factors and opportunities
- 6.3.2. Market size and forecast, by region
- 6.3.3. Market share analysis by country
- 6.4. Online providers
- 6.4.1. Key market trends, growth factors and opportunities
- 6.4.2. Market size and forecast, by region
- 6.4.3. Market share analysis by country
CHAPTER 7: ANTIPLATELET MARKET, BY REGION
- 7.1. Overview
- 7.1.1. Market size and forecast By Region
- 7.2. North America
- 7.2.1. Key trends and opportunities
- 7.2.2. Market size and forecast, by Drug Class
- 7.2.3. Market size and forecast, by Route of Administration
- 7.2.4. Market size and forecast, by Distribution Channel
- 7.2.5. Market size and forecast, by country
- 7.2.5.1. U.S.
- 7.2.5.1.1. Key market trends, growth factors and opportunities
- 7.2.5.1.2. Market size and forecast, by Drug Class
- 7.2.5.1.3. Market size and forecast, by Route of Administration
- 7.2.5.1.4. Market size and forecast, by Distribution Channel
- 7.2.5.2. Canada
- 7.2.5.2.1. Key market trends, growth factors and opportunities
- 7.2.5.2.2. Market size and forecast, by Drug Class
- 7.2.5.2.3. Market size and forecast, by Route of Administration
- 7.2.5.2.4. Market size and forecast, by Distribution Channel
- 7.2.5.3. Mexico
- 7.2.5.3.1. Key market trends, growth factors and opportunities
- 7.2.5.3.2. Market size and forecast, by Drug Class
- 7.2.5.3.3. Market size and forecast, by Route of Administration
- 7.2.5.3.4. Market size and forecast, by Distribution Channel
- 7.3. Europe
- 7.3.1. Key trends and opportunities
- 7.3.2. Market size and forecast, by Drug Class
- 7.3.3. Market size and forecast, by Route of Administration
- 7.3.4. Market size and forecast, by Distribution Channel
- 7.3.5. Market size and forecast, by country
- 7.3.5.1. Germany
- 7.3.5.1.1. Key market trends, growth factors and opportunities
- 7.3.5.1.2. Market size and forecast, by Drug Class
- 7.3.5.1.3. Market size and forecast, by Route of Administration
- 7.3.5.1.4. Market size and forecast, by Distribution Channel
- 7.3.5.2. France
- 7.3.5.2.1. Key market trends, growth factors and opportunities
- 7.3.5.2.2. Market size and forecast, by Drug Class
- 7.3.5.2.3. Market size and forecast, by Route of Administration
- 7.3.5.2.4. Market size and forecast, by Distribution Channel
- 7.3.5.3. UK
- 7.3.5.3.1. Key market trends, growth factors and opportunities
- 7.3.5.3.2. Market size and forecast, by Drug Class
- 7.3.5.3.3. Market size and forecast, by Route of Administration
- 7.3.5.3.4. Market size and forecast, by Distribution Channel
- 7.3.5.4. Italy
- 7.3.5.4.1. Key market trends, growth factors and opportunities
- 7.3.5.4.2. Market size and forecast, by Drug Class
- 7.3.5.4.3. Market size and forecast, by Route of Administration
- 7.3.5.4.4. Market size and forecast, by Distribution Channel
- 7.3.5.5. Spain
- 7.3.5.5.1. Key market trends, growth factors and opportunities
- 7.3.5.5.2. Market size and forecast, by Drug Class
- 7.3.5.5.3. Market size and forecast, by Route of Administration
- 7.3.5.5.4. Market size and forecast, by Distribution Channel
- 7.3.5.6. Rest of Europe
- 7.3.5.6.1. Key market trends, growth factors and opportunities
- 7.3.5.6.2. Market size and forecast, by Drug Class
- 7.3.5.6.3. Market size and forecast, by Route of Administration
- 7.3.5.6.4. Market size and forecast, by Distribution Channel
- 7.4. Asia-Pacific
- 7.4.1. Key trends and opportunities
- 7.4.2. Market size and forecast, by Drug Class
- 7.4.3. Market size and forecast, by Route of Administration
- 7.4.4. Market size and forecast, by Distribution Channel
- 7.4.5. Market size and forecast, by country
- 7.4.5.1. Japan
- 7.4.5.1.1. Key market trends, growth factors and opportunities
- 7.4.5.1.2. Market size and forecast, by Drug Class
- 7.4.5.1.3. Market size and forecast, by Route of Administration
- 7.4.5.1.4. Market size and forecast, by Distribution Channel
- 7.4.5.2. China
- 7.4.5.2.1. Key market trends, growth factors and opportunities
- 7.4.5.2.2. Market size and forecast, by Drug Class
- 7.4.5.2.3. Market size and forecast, by Route of Administration
- 7.4.5.2.4. Market size and forecast, by Distribution Channel
- 7.4.5.3. India
- 7.4.5.3.1. Key market trends, growth factors and opportunities
- 7.4.5.3.2. Market size and forecast, by Drug Class
- 7.4.5.3.3. Market size and forecast, by Route of Administration
- 7.4.5.3.4. Market size and forecast, by Distribution Channel
- 7.4.5.4. Australia
- 7.4.5.4.1. Key market trends, growth factors and opportunities
- 7.4.5.4.2. Market size and forecast, by Drug Class
- 7.4.5.4.3. Market size and forecast, by Route of Administration
- 7.4.5.4.4. Market size and forecast, by Distribution Channel
- 7.4.5.5. South Korea
- 7.4.5.5.1. Key market trends, growth factors and opportunities
- 7.4.5.5.2. Market size and forecast, by Drug Class
- 7.4.5.5.3. Market size and forecast, by Route of Administration
- 7.4.5.5.4. Market size and forecast, by Distribution Channel
- 7.4.5.6. Rest of Asia-Pacific
- 7.4.5.6.1. Key market trends, growth factors and opportunities
- 7.4.5.6.2. Market size and forecast, by Drug Class
- 7.4.5.6.3. Market size and forecast, by Route of Administration
- 7.4.5.6.4. Market size and forecast, by Distribution Channel
- 7.5. LAMEA
- 7.5.1. Key trends and opportunities
- 7.5.2. Market size and forecast, by Drug Class
- 7.5.3. Market size and forecast, by Route of Administration
- 7.5.4. Market size and forecast, by Distribution Channel
- 7.5.5. Market size and forecast, by country
- 7.5.5.1. Brazil
- 7.5.5.1.1. Key market trends, growth factors and opportunities
- 7.5.5.1.2. Market size and forecast, by Drug Class
- 7.5.5.1.3. Market size and forecast, by Route of Administration
- 7.5.5.1.4. Market size and forecast, by Distribution Channel
- 7.5.5.2. Saudi Arabia
- 7.5.5.2.1. Key market trends, growth factors and opportunities
- 7.5.5.2.2. Market size and forecast, by Drug Class
- 7.5.5.2.3. Market size and forecast, by Route of Administration
- 7.5.5.2.4. Market size and forecast, by Distribution Channel
- 7.5.5.3. South Africa
- 7.5.5.3.1. Key market trends, growth factors and opportunities
- 7.5.5.3.2. Market size and forecast, by Drug Class
- 7.5.5.3.3. Market size and forecast, by Route of Administration
- 7.5.5.3.4. Market size and forecast, by Distribution Channel
- 7.5.5.4. Rest of LAMEA
- 7.5.5.4.1. Key market trends, growth factors and opportunities
- 7.5.5.4.2. Market size and forecast, by Drug Class
- 7.5.5.4.3. Market size and forecast, by Route of Administration
- 7.5.5.4.4. Market size and forecast, by Distribution Channel
CHAPTER 8: COMPETITIVE LANDSCAPE
- 8.1. Introduction
- 8.2. Top winning strategies
- 8.3. Product Mapping of Top 10 Player
- 8.4. Competitive Dashboard
- 8.5. Competitive Heatmap
- 8.6. Top player positioning, 2022
CHAPTER 9: COMPANY PROFILES
- 9.1. AstraZeneca plc
- 9.1.1. Company overview
- 9.1.2. Key Executives
- 9.1.3. Company snapshot
- 9.1.4. Operating business segments
- 9.1.5. Product portfolio
- 9.1.6. Business performance
- 9.1.7. Key strategic moves and developments
- 9.2. Bayer AG
- 9.2.1. Company overview
- 9.2.2. Key Executives
- 9.2.3. Company snapshot
- 9.2.4. Operating business segments
- 9.2.5. Product portfolio
- 9.2.6. Business performance
- 9.3. Eli Lilly and Company.
- 9.3.1. Company overview
- 9.3.2. Key Executives
- 9.3.3. Company snapshot
- 9.3.4. Operating business segments
- 9.3.5. Product portfolio
- 9.3.6. Business performance
- 9.4. Otsuka Pharmaceutical Co., Ltd.
- 9.4.1. Company overview
- 9.4.2. Key Executives
- 9.4.3. Company snapshot
- 9.4.4. Operating business segments
- 9.4.5. Product portfolio
- 9.5. Sanofi S.A.
- 9.5.1. Company overview
- 9.5.2. Key Executives
- 9.5.3. Company snapshot
- 9.5.4. Operating business segments
- 9.5.5. Product portfolio
- 9.5.6. Business performance
- 9.6. Glenmark Pharmaceuticals Limited
- 9.6.1. Company overview
- 9.6.2. Key Executives
- 9.6.3. Company snapshot
- 9.6.4. Operating business segments
- 9.6.5. Product portfolio
- 9.6.6. Business performance
- 9.7. Cipla Ltd.
- 9.7.1. Company overview
- 9.7.2. Key Executives
- 9.7.3. Company snapshot
- 9.7.4. Operating business segments
- 9.7.5. Product portfolio
- 9.7.6. Business performance
- 9.8. Lupin
- 9.8.1. Company overview
- 9.8.2. Key Executives
- 9.8.3. Company snapshot
- 9.8.4. Operating business segments
- 9.8.5. Product portfolio
- 9.8.6. Business performance
- 9.9. Daiichi Sankyo Company Limited
- 9.9.1. Company overview
- 9.9.2. Key Executives
- 9.9.3. Company snapshot
- 9.9.4. Operating business segments
- 9.9.5. Product portfolio
- 9.9.6. Business performance
- 9.10. Chiesi Farmaceutici S.p.A.
- 9.10.1. Company overview
- 9.10.2. Key Executives
- 9.10.3. Company snapshot
- 9.10.4. Operating business segments
- 9.10.5. Product portfolio
- 9.10.6. Business performance
