
|
市場調査レポート
商品コード
1365587
光ファイバーパッチコード市場:タイプ別、用途別:世界の機会分析と産業予測、2023~2032年Optical Fiber Patch Cord Market By Type (Single-mode, Multimode), By Application (Optical Data Network, Telecommunication, Military and Aerospace, Other): Global Opportunity Analysis and Industry Forecast, 2023-2032 |
||||||
|
|||||||

| 光ファイバーパッチコード市場:タイプ別、用途別:世界の機会分析と産業予測、2023~2032年 |
|
出版日: 2023年07月01日
発行: Allied Market Research
ページ情報: 英文 206 Pages
納期: 2~3営業日
|

- 全表示
- 概要
- 図表
- 目次
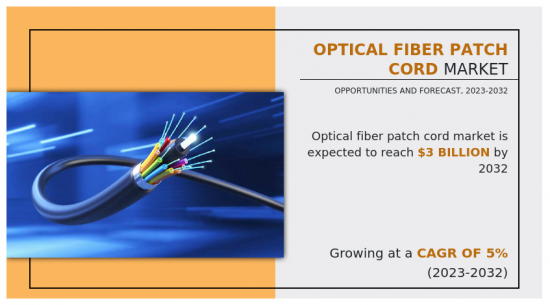
Allied Market Researchが発行した最新レポート「光ファイバーパッチコード市場」によると、光ファイバーパッチコード市場は2022年に19億米ドルと評価され、2023年から2032年にかけてCAGR 5%で成長し、2032年には30億米ドルに達すると予測されています。
光ファイバーパッチコード市場の成長を支えているのは、高解像度ビデオやマルチメディア用途に対する需要の高まりです。ビデオストリーミング、ビデオ会議、オンラインゲーム、その他帯域幅を必要とするマルチメディア用途の人気が急上昇しているため、信頼性が高く高品質なデータ伝送が必要とされています。光ファイバーパッチコードは、高解像度のオーディオ信号やビデオ信号を、劣化や遅延の問題なしに長距離伝送する上で重要な役割を果たしています。その高い帯域幅容量と低い信号損失により、エンドユーザーはシームレスで没入感のあるマルチメディア体験を得ることができます。光ファイバーパッチコードは、高解像度信号を伝送する信頼性の高い効率的な手段を提供することで、今日のデジタル時代におけるさまざまなマルチメディア用途の普及と成功に大きく貢献しています。
しかし、世界の光ファイバーパッチコード市場の成長を抑制する課題の1つは、損傷を受けやすいことです。光ファイバーパッチコードはデリケートで、誤った扱いや過度の曲げ、引っ張りに弱いです。ケーブル内部の小さくて壊れやすい光ファイバーは、過度のストレスを受けると簡単に切れたり、信号が途切れたりします。このような損傷を受けやすい性質は、パッチコードの設置、メンテナンス、日常的な使用においてリスクとなります。破損のリスクを最小化するために、ユーザは注意を払い、適切な取り扱い方法を実施する必要があります。さらに、ケーブル管理システムの使用、急激な屈曲の回避、適切なストレインリリーフの提供などの保護対策により、光ファイバーパッチコードの損傷に対する脆弱性を軽減することができます。
光ファイバー技術の絶え間ない進歩は、光ファイバーパッチコード市場の成長に大きな機会をもたらしています。より効率的なコネクタの開発により、シグナルインテグリティの向上、挿入損失の低減、耐久性の強化が実現し、シームレスで信頼性の高いデータ伝送が可能になっています。さらに、ファイバー製造プロセスの進歩により、減衰が減少し帯域幅が改善されたファイバーが生まれ、より高いデータレートと長い伝送距離が可能になりました。変調形式の増加や誤り訂正技術などの伝送プロトコルの強化により、光ファイバーパッチコードの性能はさらに最適化されています。これらの進歩は、簡素化されたコネクタ設計やコネクタの互換性向上などの機能を導入することで、設置や保守を容易にしています。より高いデータレート、より高い信頼性、より容易な設置やメンテナンスなど、光ファイバー技術の絶え間ない進歩は、様々な産業で光ファイバーパッチコードの広範な採用を促進しています。
光ファイバーパッチコード市場は、タイプ、用途、地域によって区分されます。タイプ別では、市場はシングルモードとマルチモードに二分されます。用途別では、光データネットワーク、通信、軍事・航空宇宙、その他に分けられます。地域別では、北米(米国、カナダ、メキシコ)、欧州(英国、ドイツ、フランス、その他の欧州地域)、アジア太平洋(中国、日本、インド、韓国、その他のアジア太平洋)、ラテンアメリカ(中南米、中東・アフリカ)に分けて分析しています。
目次
第1章 イントロダクション
第2章 エグゼクティブサマリー
第3章 市場概要
- 市場の定義と範囲
- 主な調査結果
- 影響要因
- 主な投資機会
- ポーターのファイブフォース分析
- 市場力学
- 促進要因
- インターネットの普及と接続性の拡大
- データセンターの拡大
- 抑制要因
- 高い設置コスト
- 機会
- 技術の進歩と製品の革新
- 促進要因
- COVID-19市場への影響分析
第4章 光ファイバーパッチコード市場:タイプ別
- 概要
- シングルモード
- マルチモード
第5章 光ファイバーパッチコード市場:用途別
- 概要
- 光データネットワーク
- 通信
- 軍事・航空宇宙
- その他
第6章 光ファイバーパッチコード市場:地域別
- 概要
- 北米
- 米国
- カナダ
- メキシコ
- 欧州
- 英国
- ドイツ
- フランス
- その他
- アジア太平洋
- 中国
- 日本
- インド
- 韓国
- その他
- ラテンアメリカ
- ラテンアメリカ
- 中東
- アフリカ
第7章 競合情勢
- イントロダクション
- 主要成功戦略
- 主要10社の製品マッピング
- 競合ダッシュボード
- 競合ヒートマップ
- 主要企業のポジショニング、2022年
第8章 企業プロファイル
- Sumitomo Electric Industries, Ltd.
- Amphenol Corporation.
- Shenzhen Opticking Technology Co.,Ltd.
- T&S Communication Co, Ltd.
- Megladon Manufacturing
- Phoenix Contact
- LongXing Telecom
- Wirenet Technology Co., Ltd.
- Black Box
- KINSOM Technology Limited
LIST OF TABLES
- TABLE 01. GLOBAL OPTICAL FIBER PATCH CORD MARKET, BY TYPE, 2022-2032 ($MILLION)
- TABLE 02. OPTICAL FIBER PATCH CORD MARKET FOR SINGLE-MODE, BY REGION, 2022-2032 ($MILLION)
- TABLE 03. OPTICAL FIBER PATCH CORD MARKET FOR MULTIMODE, BY REGION, 2022-2032 ($MILLION)
- TABLE 04. GLOBAL OPTICAL FIBER PATCH CORD MARKET, BY APPLICATION, 2022-2032 ($MILLION)
- TABLE 05. OPTICAL FIBER PATCH CORD MARKET FOR OPTICAL DATA NETWORK, BY REGION, 2022-2032 ($MILLION)
- TABLE 06. OPTICAL FIBER PATCH CORD MARKET FOR TELECOMMUNICATION, BY REGION, 2022-2032 ($MILLION)
- TABLE 07. OPTICAL FIBER PATCH CORD MARKET FOR MILITARY AND AEROSPACE, BY REGION, 2022-2032 ($MILLION)
- TABLE 08. OPTICAL FIBER PATCH CORD MARKET FOR OTHER, BY REGION, 2022-2032 ($MILLION)
- TABLE 09. OPTICAL FIBER PATCH CORD MARKET, BY REGION, 2022-2032 ($MILLION)
- TABLE 10. NORTH AMERICA OPTICAL FIBER PATCH CORD MARKET, BY TYPE, 2022-2032 ($MILLION)
- TABLE 11. NORTH AMERICA OPTICAL FIBER PATCH CORD MARKET, BY APPLICATION, 2022-2032 ($MILLION)
- TABLE 12. NORTH AMERICA OPTICAL FIBER PATCH CORD MARKET, BY COUNTRY, 2022-2032 ($MILLION)
- TABLE 13. U.S. OPTICAL FIBER PATCH CORD MARKET, BY TYPE, 2022-2032 ($MILLION)
- TABLE 14. U.S. OPTICAL FIBER PATCH CORD MARKET, BY APPLICATION, 2022-2032 ($MILLION)
- TABLE 15. CANADA OPTICAL FIBER PATCH CORD MARKET, BY TYPE, 2022-2032 ($MILLION)
- TABLE 16. CANADA OPTICAL FIBER PATCH CORD MARKET, BY APPLICATION, 2022-2032 ($MILLION)
- TABLE 17. MEXICO OPTICAL FIBER PATCH CORD MARKET, BY TYPE, 2022-2032 ($MILLION)
- TABLE 18. MEXICO OPTICAL FIBER PATCH CORD MARKET, BY APPLICATION, 2022-2032 ($MILLION)
- TABLE 19. EUROPE OPTICAL FIBER PATCH CORD MARKET, BY TYPE, 2022-2032 ($MILLION)
- TABLE 20. EUROPE OPTICAL FIBER PATCH CORD MARKET, BY APPLICATION, 2022-2032 ($MILLION)
- TABLE 21. EUROPE OPTICAL FIBER PATCH CORD MARKET, BY COUNTRY, 2022-2032 ($MILLION)
- TABLE 22. UK OPTICAL FIBER PATCH CORD MARKET, BY TYPE, 2022-2032 ($MILLION)
- TABLE 23. UK OPTICAL FIBER PATCH CORD MARKET, BY APPLICATION, 2022-2032 ($MILLION)
- TABLE 24. GERMANY OPTICAL FIBER PATCH CORD MARKET, BY TYPE, 2022-2032 ($MILLION)
- TABLE 25. GERMANY OPTICAL FIBER PATCH CORD MARKET, BY APPLICATION, 2022-2032 ($MILLION)
- TABLE 26. FRANCE OPTICAL FIBER PATCH CORD MARKET, BY TYPE, 2022-2032 ($MILLION)
- TABLE 27. FRANCE OPTICAL FIBER PATCH CORD MARKET, BY APPLICATION, 2022-2032 ($MILLION)
- TABLE 28. REST OF EUROPE OPTICAL FIBER PATCH CORD MARKET, BY TYPE, 2022-2032 ($MILLION)
- TABLE 29. REST OF EUROPE OPTICAL FIBER PATCH CORD MARKET, BY APPLICATION, 2022-2032 ($MILLION)
- TABLE 30. ASIA-PACIFIC OPTICAL FIBER PATCH CORD MARKET, BY TYPE, 2022-2032 ($MILLION)
- TABLE 31. ASIA-PACIFIC OPTICAL FIBER PATCH CORD MARKET, BY APPLICATION, 2022-2032 ($MILLION)
- TABLE 32. ASIA-PACIFIC OPTICAL FIBER PATCH CORD MARKET, BY COUNTRY, 2022-2032 ($MILLION)
- TABLE 33. CHINA OPTICAL FIBER PATCH CORD MARKET, BY TYPE, 2022-2032 ($MILLION)
- TABLE 34. CHINA OPTICAL FIBER PATCH CORD MARKET, BY APPLICATION, 2022-2032 ($MILLION)
- TABLE 35. JAPAN OPTICAL FIBER PATCH CORD MARKET, BY TYPE, 2022-2032 ($MILLION)
- TABLE 36. JAPAN OPTICAL FIBER PATCH CORD MARKET, BY APPLICATION, 2022-2032 ($MILLION)
- TABLE 37. INDIA OPTICAL FIBER PATCH CORD MARKET, BY TYPE, 2022-2032 ($MILLION)
- TABLE 38. INDIA OPTICAL FIBER PATCH CORD MARKET, BY APPLICATION, 2022-2032 ($MILLION)
- TABLE 39. SOUTH KOREA OPTICAL FIBER PATCH CORD MARKET, BY TYPE, 2022-2032 ($MILLION)
- TABLE 40. SOUTH KOREA OPTICAL FIBER PATCH CORD MARKET, BY APPLICATION, 2022-2032 ($MILLION)
- TABLE 41. REST OF ASIA-PACIFIC OPTICAL FIBER PATCH CORD MARKET, BY TYPE, 2022-2032 ($MILLION)
- TABLE 42. REST OF ASIA-PACIFIC OPTICAL FIBER PATCH CORD MARKET, BY APPLICATION, 2022-2032 ($MILLION)
- TABLE 43. LAMEA OPTICAL FIBER PATCH CORD MARKET, BY TYPE, 2022-2032 ($MILLION)
- TABLE 44. LAMEA OPTICAL FIBER PATCH CORD MARKET, BY APPLICATION, 2022-2032 ($MILLION)
- TABLE 45. LAMEA OPTICAL FIBER PATCH CORD MARKET, BY COUNTRY, 2022-2032 ($MILLION)
- TABLE 46. LATIN AMERICA OPTICAL FIBER PATCH CORD MARKET, BY TYPE, 2022-2032 ($MILLION)
- TABLE 47. LATIN AMERICA OPTICAL FIBER PATCH CORD MARKET, BY APPLICATION, 2022-2032 ($MILLION)
- TABLE 48. MIDDLE EAST OPTICAL FIBER PATCH CORD MARKET, BY TYPE, 2022-2032 ($MILLION)
- TABLE 49. MIDDLE EAST OPTICAL FIBER PATCH CORD MARKET, BY APPLICATION, 2022-2032 ($MILLION)
- TABLE 50. AFRICA OPTICAL FIBER PATCH CORD MARKET, BY TYPE, 2022-2032 ($MILLION)
- TABLE 51. AFRICA OPTICAL FIBER PATCH CORD MARKET, BY APPLICATION, 2022-2032 ($MILLION)
- TABLE 52. SUMITOMO ELECTRIC INDUSTRIES, LTD.: KEY EXECUTIVES
- TABLE 53. SUMITOMO ELECTRIC INDUSTRIES, LTD.: COMPANY SNAPSHOT
- TABLE 54. SUMITOMO ELECTRIC INDUSTRIES, LTD.: PRODUCT SEGMENTS
- TABLE 55. SUMITOMO ELECTRIC INDUSTRIES, LTD.: PRODUCT PORTFOLIO
- TABLE 56. SUMITOMO ELECTRIC INDUSTRIES, LTD.: KEY STRATERGIES
- TABLE 57. AMPHENOL CORPORATION.: KEY EXECUTIVES
- TABLE 58. AMPHENOL CORPORATION.: COMPANY SNAPSHOT
- TABLE 59. AMPHENOL CORPORATION.: PRODUCT SEGMENTS
- TABLE 60. AMPHENOL CORPORATION.: PRODUCT PORTFOLIO
- TABLE 61. AMPHENOL CORPORATION.: KEY STRATERGIES
- TABLE 62. SHENZHEN OPTICKING TECHNOLOGY CO.,LTD.: KEY EXECUTIVES
- TABLE 63. SHENZHEN OPTICKING TECHNOLOGY CO.,LTD.: COMPANY SNAPSHOT
- TABLE 64. SHENZHEN OPTICKING TECHNOLOGY CO.,LTD.: PRODUCT SEGMENTS
- TABLE 65. SHENZHEN OPTICKING TECHNOLOGY CO.,LTD.: PRODUCT PORTFOLIO
- TABLE 66. T&S COMMUNICATION CO, LTD.: KEY EXECUTIVES
- TABLE 67. T&S COMMUNICATION CO, LTD.: COMPANY SNAPSHOT
- TABLE 68. T&S COMMUNICATION CO, LTD.: PRODUCT SEGMENTS
- TABLE 69. T&S COMMUNICATION CO, LTD.: PRODUCT PORTFOLIO
- TABLE 70. MEGLADON MANUFACTURING: KEY EXECUTIVES
- TABLE 71. MEGLADON MANUFACTURING: COMPANY SNAPSHOT
- TABLE 72. MEGLADON MANUFACTURING: PRODUCT SEGMENTS
- TABLE 73. MEGLADON MANUFACTURING: PRODUCT PORTFOLIO
- TABLE 74. MEGLADON MANUFACTURING: KEY STRATERGIES
- TABLE 75. PHOENIX CONTACT: KEY EXECUTIVES
- TABLE 76. PHOENIX CONTACT: COMPANY SNAPSHOT
- TABLE 77. PHOENIX CONTACT: PRODUCT SEGMENTS
- TABLE 78. PHOENIX CONTACT: PRODUCT PORTFOLIO
- TABLE 79. PHOENIX CONTACT: KEY STRATERGIES
- TABLE 80. LONGXING TELECOM: KEY EXECUTIVES
- TABLE 81. LONGXING TELECOM: COMPANY SNAPSHOT
- TABLE 82. LONGXING TELECOM: SERVICE SEGMENTS
- TABLE 83. LONGXING TELECOM: PRODUCT PORTFOLIO
- TABLE 84. WIRENET TECHNOLOGY CO., LTD.: KEY EXECUTIVES
- TABLE 85. WIRENET TECHNOLOGY CO., LTD.: COMPANY SNAPSHOT
- TABLE 86. WIRENET TECHNOLOGY CO., LTD.: PRODUCT SEGMENTS
- TABLE 87. WIRENET TECHNOLOGY CO., LTD.: PRODUCT PORTFOLIO
- TABLE 88. BLACK BOX: KEY EXECUTIVES
- TABLE 89. BLACK BOX: COMPANY SNAPSHOT
- TABLE 90. BLACK BOX: SERVICE SEGMENTS
- TABLE 91. BLACK BOX: PRODUCT PORTFOLIO
- TABLE 92. KINSOM TECHNOLOGY LIMITED: KEY EXECUTIVES
- TABLE 93. KINSOM TECHNOLOGY LIMITED: COMPANY SNAPSHOT
- TABLE 94. KINSOM TECHNOLOGY LIMITED: PRODUCT SEGMENTS
- TABLE 95. KINSOM TECHNOLOGY LIMITED: PRODUCT PORTFOLIO
LIST OF FIGURES
- FIGURE 01. OPTICAL FIBER PATCH CORD MARKET, 2022-2032
- FIGURE 02. SEGMENTATION OF OPTICAL FIBER PATCH CORD MARKET, 2022-2032
- FIGURE 03. TOP INVESTMENT POCKETS IN OPTICAL FIBER PATCH CORD MARKET (2023-2032)
- FIGURE 04. HIGH BARGAINING POWER OF SUPPLIERS
- FIGURE 05. MODERATE-TO-HIGH THREAT OF NEW ENTRANTS
- FIGURE 06. MODERATE THREAT OF SUBSTITUTES
- FIGURE 07. HIGH INTENSITY OF RIVALRY
- FIGURE 08. MODERATE-TO-HIGH BARGAINING POWER OF BUYERS
- FIGURE 09. DRIVERS, RESTRAINTS AND OPPORTUNITIES: GLOBALOPTICAL FIBER PATCH CORD MARKET
- FIGURE 09. OPTICAL FIBER PATCH CORD MARKET, BY TYPE, 2022(%)
- FIGURE 10. COMPARATIVE SHARE ANALYSIS OF OPTICAL FIBER PATCH CORD MARKET FOR SINGLE-MODE, BY COUNTRY 2022 AND 2032(%)
- FIGURE 11. COMPARATIVE SHARE ANALYSIS OF OPTICAL FIBER PATCH CORD MARKET FOR MULTIMODE, BY COUNTRY 2022 AND 2032(%)
- FIGURE 12. OPTICAL FIBER PATCH CORD MARKET, BY APPLICATION, 2022(%)
- FIGURE 13. COMPARATIVE SHARE ANALYSIS OF OPTICAL FIBER PATCH CORD MARKET FOR OPTICAL DATA NETWORK, BY COUNTRY 2022 AND 2032(%)
- FIGURE 14. COMPARATIVE SHARE ANALYSIS OF OPTICAL FIBER PATCH CORD MARKET FOR TELECOMMUNICATION, BY COUNTRY 2022 AND 2032(%)
- FIGURE 15. COMPARATIVE SHARE ANALYSIS OF OPTICAL FIBER PATCH CORD MARKET FOR MILITARY AND AEROSPACE, BY COUNTRY 2022 AND 2032(%)
- FIGURE 16. COMPARATIVE SHARE ANALYSIS OF OPTICAL FIBER PATCH CORD MARKET FOR OTHER, BY COUNTRY 2022 AND 2032(%)
- FIGURE 17. OPTICAL FIBER PATCH CORD MARKET BY REGION, 2022
- FIGURE 18. U.S. OPTICAL FIBER PATCH CORD MARKET, 2022-2032 ($MILLION)
- FIGURE 19. CANADA OPTICAL FIBER PATCH CORD MARKET, 2022-2032 ($MILLION)
- FIGURE 20. MEXICO OPTICAL FIBER PATCH CORD MARKET, 2022-2032 ($MILLION)
- FIGURE 21. UK OPTICAL FIBER PATCH CORD MARKET, 2022-2032 ($MILLION)
- FIGURE 22. GERMANY OPTICAL FIBER PATCH CORD MARKET, 2022-2032 ($MILLION)
- FIGURE 23. FRANCE OPTICAL FIBER PATCH CORD MARKET, 2022-2032 ($MILLION)
- FIGURE 24. REST OF EUROPE OPTICAL FIBER PATCH CORD MARKET, 2022-2032 ($MILLION)
- FIGURE 25. CHINA OPTICAL FIBER PATCH CORD MARKET, 2022-2032 ($MILLION)
- FIGURE 26. JAPAN OPTICAL FIBER PATCH CORD MARKET, 2022-2032 ($MILLION)
- FIGURE 27. INDIA OPTICAL FIBER PATCH CORD MARKET, 2022-2032 ($MILLION)
- FIGURE 28. SOUTH KOREA OPTICAL FIBER PATCH CORD MARKET, 2022-2032 ($MILLION)
- FIGURE 29. REST OF ASIA-PACIFIC OPTICAL FIBER PATCH CORD MARKET, 2022-2032 ($MILLION)
- FIGURE 30. LATIN AMERICA OPTICAL FIBER PATCH CORD MARKET, 2022-2032 ($MILLION)
- FIGURE 31. MIDDLE EAST OPTICAL FIBER PATCH CORD MARKET, 2022-2032 ($MILLION)
- FIGURE 32. AFRICA OPTICAL FIBER PATCH CORD MARKET, 2022-2032 ($MILLION)
- FIGURE 33. TOP WINNING STRATEGIES, BY YEAR
- FIGURE 34. TOP WINNING STRATEGIES, BY DEVELOPMENT
- FIGURE 35. TOP WINNING STRATEGIES, BY COMPANY
- FIGURE 36. PRODUCT MAPPING OF TOP 10 PLAYERS
- FIGURE 37. COMPETITIVE DASHBOARD
- FIGURE 38. COMPETITIVE HEATMAP: OPTICAL FIBER PATCH CORD MARKET
- FIGURE 39. TOP PLAYER POSITIONING, 2022
- FIGURE 40. SUMITOMO ELECTRIC INDUSTRIES, LTD.: NET SALES, 2020-2022 ($MILLION)
- FIGURE 41. SUMITOMO ELECTRIC INDUSTRIES, LTD.: REVENUE SHARE BY SEGMENT, 2022 (%)
- FIGURE 42. SUMITOMO ELECTRIC INDUSTRIES, LTD.: REVENUE SHARE BY REGION, 2022 (%)
- FIGURE 43. AMPHENOL CORPORATION.: NET REVENUE, 2020-2022 ($MILLION)
- FIGURE 44. AMPHENOL CORPORATION.: RESEARCH & DEVELOPMENT EXPENDITURE, 2020-2022 ($MILLION)
- FIGURE 45. AMPHENOL CORPORATION.: REVENUE SHARE BY SEGMENT, 2022 (%)
- FIGURE 46. AMPHENOL CORPORATION.: REVENUE SHARE BY REGION, 2022 (%)
- FIGURE 47. BLACK BOX: NET REVENUE, 2019-2021 ($MILLION)
- FIGURE 48. BLACK BOX: REVENUE SHARE BY SEGMENT, 2021 (%)
- FIGURE 49. BLACK BOX: REVENUE SHARE BY REGION, 2021 (%)
According to a new report published by Allied Market Research, titled, "Optical Fiber Patch Cord Market," The optical fiber patch cord market was valued at $1.9 billion in 2022, and is estimated to reach $3 billion by 2032, growing at a CAGR of 5% from 2023 to 2032.
The increasing demand for high-definition video and multimedia applications is a key driver behind the growth of the optical fiber patch cord market. With the surge in popularity of video streaming, video conferencing, online gaming, and other bandwidth-intensive multimedia applications, there is a need for reliable and high-quality data transmission. Optical fiber patch cord plays a crucial role in facilitating the transmission of high-definition audio and video signals over long distances without degradation or latency issues. Their high bandwidth capacity and low signal loss ensure that the end-users receive a seamless and immersive multimedia experience. By providing a reliable and efficient means of transmitting high-definition signals, optical fiber patch cords contribute significantly to the widespread adoption and success of various multimedia applications in today's digital era.
However, one of the challenges that restrain the growth of the global optical fiber patch cord market is the susceptibility to damage. Optical fiber patch cords are delicate and sensitive to mishandling, excessive bending, or pulling. The small and fragile optical fibers inside the cables can easily break or experience signal loss if subjected to undue stress. This susceptibility to damage poses a risk during installation, maintenance, and everyday use of the patch cords. It requires users to exercise caution and implement proper handling techniques to minimize the risk of damage. In addition, protective measures such as using cable management systems, avoiding sharp bends, and providing adequate strain relief can help mitigate the vulnerability of optical fiber patch cords to damage.
Continuous advancements in optical fiber technology have created significant opportunities for the growth of the optical fiber patch cord market. The development of more efficient connectors has led to improved signal integrity, lower insertion losses, and enhanced durability, enabling seamless and reliable data transmission. Furthermore, advancements in fiber manufacturing processes have resulted in fibers with reduced attenuation and improved bandwidth, enabling higher data rates and longer transmission distances. Enhanced transmission protocols, such as increased modulation formats and error correction techniques, have further optimized the performance of optical fiber patch cords. These advancements have made installation and maintenance easier by introducing features like simplified connector designs and improved connector compatibility. With higher data rates, greater reliability, and easier installation and maintenance, the continuous advancements in fiber optic technology are driving the widespread adoption of optical fiber patch cords across various industries.
The optical fiber patch cord market is segmented on the basis of type, application, and region. By type, the market is bifurcated into single-mode, and multimode. By application, the market is segregated into optical data network, telecommunication, military & aerospace, and others. By region, the market is analyzed across North America (U.S., Canada, and Mexico), Europe (UK, Germany, France, and rest of Europe), Asia-Pacific (China, Japan, India, South Korea, and rest of Asia-Pacific) and LAMEA (Latin America, Middle East, and Africa).
The key players profiled in the optical fiber patch cord industry include Wirenet Technology Co., Ltd., LongXing Telecom, Black Box, KINSOM Technology Limited, Amphenol Corporation, Sumitomo Electric Industries, Ltd., Shenzhen Opticking Technology Co., Ltd., T&S Communication Co, Ltd., Networx, and Phoenix Contact.
Key Benefits For Stakeholders
- This report provides a quantitative analysis of the market segments, current trends, estimations, and dynamics of the optical fiber patch cord market analysis from 2022 to 2032 to identify the prevailing optical fiber patch cord market opportunities.
- The market research is offered along with information related to key drivers, restraints, and opportunities.
- Porter's five forces analysis highlights the potency of buyers and suppliers to enable stakeholders make profit-oriented business decisions and strengthen their supplier-buyer network.
- In-depth analysis of the optical fiber patch cord market segmentation assists to determine the prevailing market opportunities.
- Major countries in each region are mapped according to their revenue contribution to the global market.
- Market player positioning facilitates benchmarking and provides a clear understanding of the present position of the market players.
- The report includes the analysis of the regional as well as global optical fiber patch cord market trends, key players, market segments, application areas, and market growth strategies.
Additional benefits you will get with this purchase are:
- Quarterly Update and* (only available with a corporate license, on listed price)
- 5 additional Company Profile of client Choice pre- or Post-purchase, as a free update.
- Free Upcoming Version on the Purchase of Five and Enterprise User License.
- 16 analyst hours of support* (post-purchase, if you find additional data requirements upon review of the report, you may receive support amounting to 16 analyst hours to solve questions, and post-sale queries)
- 15% Free Customization* (in case the scope or segment of the report does not match your requirements, 20% is equivalent to 3 working days of free work, applicable once)
- Free data Pack on the Five and Enterprise User License. (Excel version of the report)
- Free Updated report if the report is 6-12 months old or older.
- 24-hour priority response*
- Free Industry updates and white papers.
Possible Customization with this report (with additional cost and timeline talk to the sales executive to know more)
- Product Benchmarking / Product specification and applications
- Product Life Cycles
- Market share analysis of players by products/segments
- New Product Development/ Product Matrix of Key Players
- Additional company profiles with specific to client's interest
- Additional country or region analysis- market size and forecast
- Expanded list for Company Profiles
- Historic market data
- Key player details (including location, contact details, supplier/vendor network etc. in excel format)
- Market share analysis of players at global/region/country level
Key Market Segments
By Type
- Multimode
- Single-mode
By Application
- Optical Data Network
- Telecommunication
- Military and Aerospace
- Other
By Region
- North America
- U.S.
- Canada
- Mexico
- Europe
- UK
- Germany
- France
- Rest of Europe
- Asia-Pacific
- China
- Japan
- India
- South Korea
- Rest of Asia-Pacific
- LAMEA
- Latin America
- Middle East
- Africa
Key Market Players:
- Amphenol Corporation.
- Black Box
- KINSOM Technology Limited
- LongXing Telecom
- Megladon Manufacturing
- Phoenix Contact
- Shenzhen Opticking Technology Co.,Ltd.
- Sumitomo Electric Industries, Ltd.
- T&S Communication Co, Ltd.
- Wirenet Technology Co., Ltd.
TABLE OF CONTENTS
CHAPTER 1: INTRODUCTION
- 1.1. Report description
- 1.2. Key market segments
- 1.3. Key benefits to the stakeholders
- 1.4. Research Methodology
- 1.4.1. Primary research
- 1.4.2. Secondary research
- 1.4.3. Analyst tools and models
CHAPTER 2: EXECUTIVE SUMMARY
- 2.1. CXO Perspective
CHAPTER 3: MARKET OVERVIEW
- 3.1. Market definition and scope
- 3.2. Key findings
- 3.2.1. Top impacting factors
- 3.2.2. Top investment pockets
- 3.3. Porter's five forces analysis
- 3.3.1. High bargaining power of suppliers
- 3.3.2. Moderate-to-high threat of new entrants
- 3.3.3. Moderate threat of substitutes
- 3.3.4. High intensity of rivalry
- 3.3.5. Moderate-to-high bargaining power of buyers
- 3.4. Market dynamics
- 3.4.1. Drivers
- 3.4.1.1. Growing internet penetration and connectivity
- 3.4.1.2. Expansion of data centers
- 3.4.1. Drivers
- 3.4.2. Restraints
- 3.4.2.1. High installation costs
- 3.4.3. Opportunities
- 3.4.3.1. Technological advancements and product innovations
- 3.5. COVID-19 Impact Analysis on the market
CHAPTER 4: OPTICAL FIBER PATCH CORD MARKET, BY TYPE
- 4.1. Overview
- 4.1.1. Market size and forecast
- 4.2. Single-mode
- 4.2.1. Key market trends, growth factors and opportunities
- 4.2.2. Market size and forecast, by region
- 4.2.3. Market share analysis by country
- 4.3. Multimode
- 4.3.1. Key market trends, growth factors and opportunities
- 4.3.2. Market size and forecast, by region
- 4.3.3. Market share analysis by country
CHAPTER 5: OPTICAL FIBER PATCH CORD MARKET, BY APPLICATION
- 5.1. Overview
- 5.1.1. Market size and forecast
- 5.2. Optical Data Network
- 5.2.1. Key market trends, growth factors and opportunities
- 5.2.2. Market size and forecast, by region
- 5.2.3. Market share analysis by country
- 5.3. Telecommunication
- 5.3.1. Key market trends, growth factors and opportunities
- 5.3.2. Market size and forecast, by region
- 5.3.3. Market share analysis by country
- 5.4. Military and Aerospace
- 5.4.1. Key market trends, growth factors and opportunities
- 5.4.2. Market size and forecast, by region
- 5.4.3. Market share analysis by country
- 5.5. Other
- 5.5.1. Key market trends, growth factors and opportunities
- 5.5.2. Market size and forecast, by region
- 5.5.3. Market share analysis by country
CHAPTER 6: OPTICAL FIBER PATCH CORD MARKET, BY REGION
- 6.1. Overview
- 6.1.1. Market size and forecast By Region
- 6.2. North America
- 6.2.1. Key trends and opportunities
- 6.2.2. Market size and forecast, by Type
- 6.2.3. Market size and forecast, by Application
- 6.2.4. Market size and forecast, by country
- 6.2.4.1. U.S.
- 6.2.4.1.1. Key market trends, growth factors and opportunities
- 6.2.4.1.2. Market size and forecast, by Type
- 6.2.4.1.3. Market size and forecast, by Application
- 6.2.4.2. Canada
- 6.2.4.2.1. Key market trends, growth factors and opportunities
- 6.2.4.2.2. Market size and forecast, by Type
- 6.2.4.2.3. Market size and forecast, by Application
- 6.2.4.3. Mexico
- 6.2.4.3.1. Key market trends, growth factors and opportunities
- 6.2.4.3.2. Market size and forecast, by Type
- 6.2.4.3.3. Market size and forecast, by Application
- 6.3. Europe
- 6.3.1. Key trends and opportunities
- 6.3.2. Market size and forecast, by Type
- 6.3.3. Market size and forecast, by Application
- 6.3.4. Market size and forecast, by country
- 6.3.4.1. UK
- 6.3.4.1.1. Key market trends, growth factors and opportunities
- 6.3.4.1.2. Market size and forecast, by Type
- 6.3.4.1.3. Market size and forecast, by Application
- 6.3.4.2. Germany
- 6.3.4.2.1. Key market trends, growth factors and opportunities
- 6.3.4.2.2. Market size and forecast, by Type
- 6.3.4.2.3. Market size and forecast, by Application
- 6.3.4.3. France
- 6.3.4.3.1. Key market trends, growth factors and opportunities
- 6.3.4.3.2. Market size and forecast, by Type
- 6.3.4.3.3. Market size and forecast, by Application
- 6.3.4.4. Rest of Europe
- 6.3.4.4.1. Key market trends, growth factors and opportunities
- 6.3.4.4.2. Market size and forecast, by Type
- 6.3.4.4.3. Market size and forecast, by Application
- 6.4. Asia-Pacific
- 6.4.1. Key trends and opportunities
- 6.4.2. Market size and forecast, by Type
- 6.4.3. Market size and forecast, by Application
- 6.4.4. Market size and forecast, by country
- 6.4.4.1. China
- 6.4.4.1.1. Key market trends, growth factors and opportunities
- 6.4.4.1.2. Market size and forecast, by Type
- 6.4.4.1.3. Market size and forecast, by Application
- 6.4.4.2. Japan
- 6.4.4.2.1. Key market trends, growth factors and opportunities
- 6.4.4.2.2. Market size and forecast, by Type
- 6.4.4.2.3. Market size and forecast, by Application
- 6.4.4.3. India
- 6.4.4.3.1. Key market trends, growth factors and opportunities
- 6.4.4.3.2. Market size and forecast, by Type
- 6.4.4.3.3. Market size and forecast, by Application
- 6.4.4.4. South Korea
- 6.4.4.4.1. Key market trends, growth factors and opportunities
- 6.4.4.4.2. Market size and forecast, by Type
- 6.4.4.4.3. Market size and forecast, by Application
- 6.4.4.5. Rest of Asia-Pacific
- 6.4.4.5.1. Key market trends, growth factors and opportunities
- 6.4.4.5.2. Market size and forecast, by Type
- 6.4.4.5.3. Market size and forecast, by Application
- 6.5. LAMEA
- 6.5.1. Key trends and opportunities
- 6.5.2. Market size and forecast, by Type
- 6.5.3. Market size and forecast, by Application
- 6.5.4. Market size and forecast, by country
- 6.5.4.1. Latin America
- 6.5.4.1.1. Key market trends, growth factors and opportunities
- 6.5.4.1.2. Market size and forecast, by Type
- 6.5.4.1.3. Market size and forecast, by Application
- 6.5.4.2. Middle East
- 6.5.4.2.1. Key market trends, growth factors and opportunities
- 6.5.4.2.2. Market size and forecast, by Type
- 6.5.4.2.3. Market size and forecast, by Application
- 6.5.4.3. Africa
- 6.5.4.3.1. Key market trends, growth factors and opportunities
- 6.5.4.3.2. Market size and forecast, by Type
- 6.5.4.3.3. Market size and forecast, by Application
CHAPTER 7: COMPETITIVE LANDSCAPE
- 7.1. Introduction
- 7.2. Top winning strategies
- 7.3. Product Mapping of Top 10 Player
- 7.4. Competitive Dashboard
- 7.5. Competitive Heatmap
- 7.6. Top player positioning, 2022
CHAPTER 8: COMPANY PROFILES
- 8.1. Sumitomo Electric Industries, Ltd.
- 8.1.1. Company overview
- 8.1.2. Key Executives
- 8.1.3. Company snapshot
- 8.1.4. Operating business segments
- 8.1.5. Product portfolio
- 8.1.6. Business performance
- 8.1.7. Key strategic moves and developments
- 8.2. Amphenol Corporation.
- 8.2.1. Company overview
- 8.2.2. Key Executives
- 8.2.3. Company snapshot
- 8.2.4. Operating business segments
- 8.2.5. Product portfolio
- 8.2.6. Business performance
- 8.2.7. Key strategic moves and developments
- 8.3. Shenzhen Opticking Technology Co.,Ltd.
- 8.3.1. Company overview
- 8.3.2. Key Executives
- 8.3.3. Company snapshot
- 8.3.4. Operating business segments
- 8.3.5. Product portfolio
- 8.4. T&S Communication Co, Ltd.
- 8.4.1. Company overview
- 8.4.2. Key Executives
- 8.4.3. Company snapshot
- 8.4.4. Operating business segments
- 8.4.5. Product portfolio
- 8.5. Megladon Manufacturing
- 8.5.1. Company overview
- 8.5.2. Key Executives
- 8.5.3. Company snapshot
- 8.5.4. Operating business segments
- 8.5.5. Product portfolio
- 8.5.6. Key strategic moves and developments
- 8.6. Phoenix Contact
- 8.6.1. Company overview
- 8.6.2. Key Executives
- 8.6.3. Company snapshot
- 8.6.4. Operating business segments
- 8.6.5. Product portfolio
- 8.6.6. Key strategic moves and developments
- 8.7. LongXing Telecom
- 8.7.1. Company overview
- 8.7.2. Key Executives
- 8.7.3. Company snapshot
- 8.7.4. Operating business segments
- 8.7.5. Product portfolio
- 8.8. Wirenet Technology Co., Ltd.
- 8.8.1. Company overview
- 8.8.2. Key Executives
- 8.8.3. Company snapshot
- 8.8.4. Operating business segments
- 8.8.5. Product portfolio
- 8.9. Black Box
- 8.9.1. Company overview
- 8.9.2. Key Executives
- 8.9.3. Company snapshot
- 8.9.4. Operating business segments
- 8.9.5. Product portfolio
- 8.9.6. Business performance
- 8.10. KINSOM Technology Limited
- 8.10.1. Company overview
- 8.10.2. Key Executives
- 8.10.3. Company snapshot
- 8.10.4. Operating business segments
- 8.10.5. Product portfolio