|
|
市場調査レポート
商品コード
1344522
電気自動車バッテリースワップ市場:ステーションタイプ別、車両タイプ別、サービスタイプ別:世界の機会分析と産業予測、2023年~2032年Electric Vehicle Battery Swapping Market By Station Type, By Vehicle Type, By Service Type : Global Opportunity Analysis and Industry Forecast, 2023-2032 |
||||||
|
|
|||||||


| 電気自動車バッテリースワップ市場:ステーションタイプ別、車両タイプ別、サービスタイプ別:世界の機会分析と産業予測、2023年~2032年 |
|
出版日: 2023年05月30日
発行: Allied Market Research
ページ情報: 英文 362 Pages
納期: 2~3営業日
|
- 全表示
- 概要
- 図表
- 目次
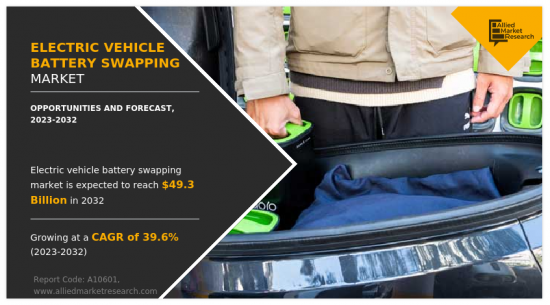
世界の電気自動車バッテリースワップ市場は、電気自動車需要の高まりにより、2023年から2032年にかけて39.6%の大幅な成長率が見込まれています。
バッテリースワップのコンセプトは、限られた充電インフラ、長い充電時間、電気自動車所有者の航続距離への不安という課題に対処することを目的としています。自宅や職場に充電設備がない 促進要因や、フリートオペレーターやタクシーサービスなど、車両の迅速なスワップが必要な 促進要因にとっては、潜在的なソリューションとなります。バッテリースワップには充電時間を短縮できるという利点がある一方で、異なる車種間でのバッテリーパックの標準化、バッテリーの劣化管理、バッテリーの安全性と信頼性の確保、スワップステーションの広範なネットワークの確立といった課題があります。
電気自動車に対する需要の増加は、適切な公共充電施設の不足、電気自動車の充電時間の短縮、航続距離不安への対応と相まって、市場の成長を促進すると予想されます。しかし、バッテリー技術・設計の差別化、バッテリースワップステーションの初期設定・運用コストの高さが市場成長の妨げとなっています。さらに、共有型eモビリティの急速な台頭や、市場参入企業による革新的かつ先進的なバッテリースワップモデルやサービスの導入は、予測期間中に市場成長に有利な機会を提供すると期待される要因のひとつです。
目次
第1章 イントロダクション
第2章 エグゼクティブサマリー
第3章 市場概要
- 市場の定義と範囲
- 主な調査結果
- 影響要因
- 主な投資機会
- ポーターのファイブフォース分析
- 供給企業の交渉力
- 買い手の交渉力
- 代替品の脅威
- 新規参入業者の脅威
- 競合の激しさ
- 市場力学
- 促進要因
- 電気自動車需要の増加と適切な公共充電設備の不足
- 電気自動車の充電時間の短縮
- 航続距離不安への対応
- 抑制要因
- バッテリー技術と設計の差別化
- バッテリースワップステーションの初期設定と運用コストが高い
- 機会
- 共有型eモビリティの急速な台頭
- 革新的で先進的なバッテリースワップモデルとサービスのイントロダクション
- 促進要因
- COVID-19市場への影響分析
第4章 電気自動車バッテリースワップ市場:ステーションタイプ別
- 概要
- 自動
- 手動
第5章 電気自動車バッテリースワップ市場:車両タイプ別
- 概要
- 二輪車
- 三輪車
- 四輪車
- 商用車
第6章 電気自動車バッテリースワップ市場:サービスタイプ別
- 概要
- サブスクリプションモデル
- 有料モデル
第7章 電気自動車バッテリースワップ市場:地域別
- 概要
- 北米
- 米国
- カナダ
- メキシコ
- 欧州
- 英国
- ドイツ
- オランダ
- ノルウェー
- その他欧州
- アジア太平洋
- 中国
- 日本
- インド
- 韓国
- その他アジア太平洋地域
- ラテンアメリカ
- ラテンアメリカ
- 中東
- アフリカ
第8章 競合情勢
- イントロダクション
- 主要成功戦略
- 主要10社の製品マッピング
- 競合ダッシュボード
- 競合ヒートマップ
- 主要企業のポジショニング、2022年
第9章 企業プロファイル
- Amara Raja Batteries Ltd.
- ECHARGEUP
- Esmito Solutions Pvt Ltd
- Gogoro
- Lithion Power Private Limited
- NIO
- Numocity
- Oyika
- Aulton New Energy Automotive Technology Co., Ltd.
- KYMCO
LIST OF TABLES
- TABLE 01. GLOBAL ELECTRIC VEHICLE BATTERY SWAPPING MARKET, BY STATION TYPE, 2022-2032 ($MILLION)
- TABLE 02. ELECTRIC VEHICLE BATTERY SWAPPING MARKET FOR AUTOMATED, BY REGION, 2022-2032 ($MILLION)
- TABLE 03. ELECTRIC VEHICLE BATTERY SWAPPING MARKET FOR MANUAL, BY REGION, 2022-2032 ($MILLION)
- TABLE 04. GLOBAL ELECTRIC VEHICLE BATTERY SWAPPING MARKET, BY VEHICLE TYPE, 2022-2032 ($MILLION)
- TABLE 05. ELECTRIC VEHICLE BATTERY SWAPPING MARKET FOR TWO-WHEELER, BY REGION, 2022-2032 ($MILLION)
- TABLE 06. ELECTRIC VEHICLE BATTERY SWAPPING MARKET FOR THREE-WHEELER, BY REGION, 2022-2032 ($MILLION)
- TABLE 07. ELECTRIC VEHICLE BATTERY SWAPPING MARKET FOR FOUR-WHEELER, BY REGION, 2022-2032 ($MILLION)
- TABLE 08. ELECTRIC VEHICLE BATTERY SWAPPING MARKET FOR COMMERCIAL VEHICLES, BY REGION, 2022-2032 ($MILLION)
- TABLE 09. GLOBAL ELECTRIC VEHICLE BATTERY SWAPPING MARKET, BY SERVICE TYPE, 2022-2032 ($MILLION)
- TABLE 10. ELECTRIC VEHICLE BATTERY SWAPPING MARKET FOR SUBSCRIPTION MODEL, BY REGION, 2022-2032 ($MILLION)
- TABLE 11. ELECTRIC VEHICLE BATTERY SWAPPING MARKET FOR PAY-PER-USE MODEL, BY REGION, 2022-2032 ($MILLION)
- TABLE 12. ELECTRIC VEHICLE BATTERY SWAPPING MARKET, BY REGION, 2022-2032 ($MILLION)
- TABLE 13. NORTH AMERICA ELECTRIC VEHICLE BATTERY SWAPPING MARKET, BY STATION TYPE, 2022-2032 ($MILLION)
- TABLE 14. NORTH AMERICA ELECTRIC VEHICLE BATTERY SWAPPING MARKET, BY VEHICLE TYPE, 2022-2032 ($MILLION)
- TABLE 15. NORTH AMERICA ELECTRIC VEHICLE BATTERY SWAPPING MARKET, BY SERVICE TYPE, 2022-2032 ($MILLION)
- TABLE 16. NORTH AMERICA ELECTRIC VEHICLE BATTERY SWAPPING MARKET, BY COUNTRY, 2022-2032 ($MILLION)
- TABLE 17. U.S. ELECTRIC VEHICLE BATTERY SWAPPING MARKET, BY STATION TYPE, 2022-2032 ($MILLION)
- TABLE 18. U.S. ELECTRIC VEHICLE BATTERY SWAPPING MARKET, BY VEHICLE TYPE, 2022-2032 ($MILLION)
- TABLE 19. U.S. ELECTRIC VEHICLE BATTERY SWAPPING MARKET, BY SERVICE TYPE, 2022-2032 ($MILLION)
- TABLE 20. CANADA ELECTRIC VEHICLE BATTERY SWAPPING MARKET, BY STATION TYPE, 2022-2032 ($MILLION)
- TABLE 21. CANADA ELECTRIC VEHICLE BATTERY SWAPPING MARKET, BY VEHICLE TYPE, 2022-2032 ($MILLION)
- TABLE 22. CANADA ELECTRIC VEHICLE BATTERY SWAPPING MARKET, BY SERVICE TYPE, 2022-2032 ($MILLION)
- TABLE 23. MEXICO ELECTRIC VEHICLE BATTERY SWAPPING MARKET, BY STATION TYPE, 2022-2032 ($MILLION)
- TABLE 24. MEXICO ELECTRIC VEHICLE BATTERY SWAPPING MARKET, BY VEHICLE TYPE, 2022-2032 ($MILLION)
- TABLE 25. MEXICO ELECTRIC VEHICLE BATTERY SWAPPING MARKET, BY SERVICE TYPE, 2022-2032 ($MILLION)
- TABLE 26. EUROPE ELECTRIC VEHICLE BATTERY SWAPPING MARKET, BY STATION TYPE, 2022-2032 ($MILLION)
- TABLE 27. EUROPE ELECTRIC VEHICLE BATTERY SWAPPING MARKET, BY VEHICLE TYPE, 2022-2032 ($MILLION)
- TABLE 28. EUROPE ELECTRIC VEHICLE BATTERY SWAPPING MARKET, BY SERVICE TYPE, 2022-2032 ($MILLION)
- TABLE 29. EUROPE ELECTRIC VEHICLE BATTERY SWAPPING MARKET, BY COUNTRY, 2022-2032 ($MILLION)
- TABLE 30. UK ELECTRIC VEHICLE BATTERY SWAPPING MARKET, BY STATION TYPE, 2022-2032 ($MILLION)
- TABLE 31. UK ELECTRIC VEHICLE BATTERY SWAPPING MARKET, BY VEHICLE TYPE, 2022-2032 ($MILLION)
- TABLE 32. UK ELECTRIC VEHICLE BATTERY SWAPPING MARKET, BY SERVICE TYPE, 2022-2032 ($MILLION)
- TABLE 33. GERMANY ELECTRIC VEHICLE BATTERY SWAPPING MARKET, BY STATION TYPE, 2022-2032 ($MILLION)
- TABLE 34. GERMANY ELECTRIC VEHICLE BATTERY SWAPPING MARKET, BY VEHICLE TYPE, 2022-2032 ($MILLION)
- TABLE 35. GERMANY ELECTRIC VEHICLE BATTERY SWAPPING MARKET, BY SERVICE TYPE, 2022-2032 ($MILLION)
- TABLE 36. NETHERLANDS ELECTRIC VEHICLE BATTERY SWAPPING MARKET, BY STATION TYPE, 2022-2032 ($MILLION)
- TABLE 37. NETHERLANDS ELECTRIC VEHICLE BATTERY SWAPPING MARKET, BY VEHICLE TYPE, 2022-2032 ($MILLION)
- TABLE 38. NETHERLANDS ELECTRIC VEHICLE BATTERY SWAPPING MARKET, BY SERVICE TYPE, 2022-2032 ($MILLION)
- TABLE 39. NORWAY ELECTRIC VEHICLE BATTERY SWAPPING MARKET, BY STATION TYPE, 2022-2032 ($MILLION)
- TABLE 40. NORWAY ELECTRIC VEHICLE BATTERY SWAPPING MARKET, BY VEHICLE TYPE, 2022-2032 ($MILLION)
- TABLE 41. NORWAY ELECTRIC VEHICLE BATTERY SWAPPING MARKET, BY SERVICE TYPE, 2022-2032 ($MILLION)
- TABLE 42. REST OF EUROPE ELECTRIC VEHICLE BATTERY SWAPPING MARKET, BY STATION TYPE, 2022-2032 ($MILLION)
- TABLE 43. REST OF EUROPE ELECTRIC VEHICLE BATTERY SWAPPING MARKET, BY VEHICLE TYPE, 2022-2032 ($MILLION)
- TABLE 44. REST OF EUROPE ELECTRIC VEHICLE BATTERY SWAPPING MARKET, BY SERVICE TYPE, 2022-2032 ($MILLION)
- TABLE 45. ASIA-PACIFIC ELECTRIC VEHICLE BATTERY SWAPPING MARKET, BY STATION TYPE, 2022-2032 ($MILLION)
- TABLE 46. ASIA-PACIFIC ELECTRIC VEHICLE BATTERY SWAPPING MARKET, BY VEHICLE TYPE, 2022-2032 ($MILLION)
- TABLE 47. ASIA-PACIFIC ELECTRIC VEHICLE BATTERY SWAPPING MARKET, BY SERVICE TYPE, 2022-2032 ($MILLION)
- TABLE 48. ASIA-PACIFIC ELECTRIC VEHICLE BATTERY SWAPPING MARKET, BY COUNTRY, 2022-2032 ($MILLION)
- TABLE 49. CHINA ELECTRIC VEHICLE BATTERY SWAPPING MARKET, BY STATION TYPE, 2022-2032 ($MILLION)
- TABLE 50. CHINA ELECTRIC VEHICLE BATTERY SWAPPING MARKET, BY VEHICLE TYPE, 2022-2032 ($MILLION)
- TABLE 51. CHINA ELECTRIC VEHICLE BATTERY SWAPPING MARKET, BY SERVICE TYPE, 2022-2032 ($MILLION)
- TABLE 52. JAPAN ELECTRIC VEHICLE BATTERY SWAPPING MARKET, BY STATION TYPE, 2022-2032 ($MILLION)
- TABLE 53. JAPAN ELECTRIC VEHICLE BATTERY SWAPPING MARKET, BY VEHICLE TYPE, 2022-2032 ($MILLION)
- TABLE 54. JAPAN ELECTRIC VEHICLE BATTERY SWAPPING MARKET, BY SERVICE TYPE, 2022-2032 ($MILLION)
- TABLE 55. INDIA ELECTRIC VEHICLE BATTERY SWAPPING MARKET, BY STATION TYPE, 2022-2032 ($MILLION)
- TABLE 56. INDIA ELECTRIC VEHICLE BATTERY SWAPPING MARKET, BY VEHICLE TYPE, 2022-2032 ($MILLION)
- TABLE 57. INDIA ELECTRIC VEHICLE BATTERY SWAPPING MARKET, BY SERVICE TYPE, 2022-2032 ($MILLION)
- TABLE 58. SOUTH KOREA ELECTRIC VEHICLE BATTERY SWAPPING MARKET, BY STATION TYPE, 2022-2032 ($MILLION)
- TABLE 59. SOUTH KOREA ELECTRIC VEHICLE BATTERY SWAPPING MARKET, BY VEHICLE TYPE, 2022-2032 ($MILLION)
- TABLE 60. SOUTH KOREA ELECTRIC VEHICLE BATTERY SWAPPING MARKET, BY SERVICE TYPE, 2022-2032 ($MILLION)
- TABLE 61. REST OF ASIA-PACIFIC ELECTRIC VEHICLE BATTERY SWAPPING MARKET, BY STATION TYPE, 2022-2032 ($MILLION)
- TABLE 62. REST OF ASIA-PACIFIC ELECTRIC VEHICLE BATTERY SWAPPING MARKET, BY VEHICLE TYPE, 2022-2032 ($MILLION)
- TABLE 63. REST OF ASIA-PACIFIC ELECTRIC VEHICLE BATTERY SWAPPING MARKET, BY SERVICE TYPE, 2022-2032 ($MILLION)
- TABLE 64. LAMEA ELECTRIC VEHICLE BATTERY SWAPPING MARKET, BY STATION TYPE, 2022-2032 ($MILLION)
- TABLE 65. LAMEA ELECTRIC VEHICLE BATTERY SWAPPING MARKET, BY VEHICLE TYPE, 2022-2032 ($MILLION)
- TABLE 66. LAMEA ELECTRIC VEHICLE BATTERY SWAPPING MARKET, BY SERVICE TYPE, 2022-2032 ($MILLION)
- TABLE 67. LAMEA ELECTRIC VEHICLE BATTERY SWAPPING MARKET, BY COUNTRY, 2022-2032 ($MILLION)
- TABLE 68. LATIN AMERICA ELECTRIC VEHICLE BATTERY SWAPPING MARKET, BY STATION TYPE, 2022-2032 ($MILLION)
- TABLE 69. LATIN AMERICA ELECTRIC VEHICLE BATTERY SWAPPING MARKET, BY VEHICLE TYPE, 2022-2032 ($MILLION)
- TABLE 70. LATIN AMERICA ELECTRIC VEHICLE BATTERY SWAPPING MARKET, BY SERVICE TYPE, 2022-2032 ($MILLION)
- TABLE 71. MIDDLE EAST ELECTRIC VEHICLE BATTERY SWAPPING MARKET, BY STATION TYPE, 2022-2032 ($MILLION)
- TABLE 72. MIDDLE EAST ELECTRIC VEHICLE BATTERY SWAPPING MARKET, BY VEHICLE TYPE, 2022-2032 ($MILLION)
- TABLE 73. MIDDLE EAST ELECTRIC VEHICLE BATTERY SWAPPING MARKET, BY SERVICE TYPE, 2022-2032 ($MILLION)
- TABLE 74. AFRICA ELECTRIC VEHICLE BATTERY SWAPPING MARKET, BY STATION TYPE, 2022-2032 ($MILLION)
- TABLE 75. AFRICA ELECTRIC VEHICLE BATTERY SWAPPING MARKET, BY VEHICLE TYPE, 2022-2032 ($MILLION)
- TABLE 76. AFRICA ELECTRIC VEHICLE BATTERY SWAPPING MARKET, BY SERVICE TYPE, 2022-2032 ($MILLION)
- TABLE 77. AMARA RAJA BATTERIES LTD.: KEY EXECUTIVES
- TABLE 78. AMARA RAJA BATTERIES LTD.: COMPANY SNAPSHOT
- TABLE 79. AMARA RAJA BATTERIES LTD.: PRODUCT SEGMENTS
- TABLE 80. AMARA RAJA BATTERIES LTD.: SERVICE SEGMENTS
- TABLE 81. AMARA RAJA BATTERIES LTD.: PRODUCT PORTFOLIO
- TABLE 82. AMARA RAJA BATTERIES LTD.: KEY STRATERGIES
- TABLE 83. ECHARGEUP: KEY EXECUTIVES
- TABLE 84. ECHARGEUP: COMPANY SNAPSHOT
- TABLE 85. ECHARGEUP: SERVICE SEGMENTS
- TABLE 86. ECHARGEUP: PRODUCT PORTFOLIO
- TABLE 87. ECHARGEUP: KEY STRATERGIES
- TABLE 88. ESMITO SOLUTIONS PVT LTD: KEY EXECUTIVES
- TABLE 89. ESMITO SOLUTIONS PVT LTD: COMPANY SNAPSHOT
- TABLE 90. ESMITO SOLUTIONS PVT LTD: PRODUCT SEGMENTS
- TABLE 91. ESMITO SOLUTIONS PVT LTD: SERVICE SEGMENTS
- TABLE 92. ESMITO SOLUTIONS PVT LTD: PRODUCT PORTFOLIO
- TABLE 93. ESMITO SOLUTIONS PVT LTD: KEY STRATERGIES
- TABLE 94. GOGORO: KEY EXECUTIVES
- TABLE 95. GOGORO: COMPANY SNAPSHOT
- TABLE 96. GOGORO: PRODUCT SEGMENTS
- TABLE 97. GOGORO: SERVICE SEGMENTS
- TABLE 98. GOGORO: PRODUCT PORTFOLIO
- TABLE 99. GOGORO: KEY STRATERGIES
- TABLE 100. LITHION POWER PRIVATE LIMITED: KEY EXECUTIVES
- TABLE 101. LITHION POWER PRIVATE LIMITED: COMPANY SNAPSHOT
- TABLE 102. LITHION POWER PRIVATE LIMITED: PRODUCT SEGMENTS
- TABLE 103. LITHION POWER PRIVATE LIMITED: PRODUCT PORTFOLIO
- TABLE 104. NIO: KEY EXECUTIVES
- TABLE 105. NIO: COMPANY SNAPSHOT
- TABLE 106. NIO: PRODUCT SEGMENTS
- TABLE 107. NIO: PRODUCT PORTFOLIO
- TABLE 108. NIO: KEY STRATERGIES
- TABLE 109. NUMOCITY: KEY EXECUTIVES
- TABLE 110. NUMOCITY: COMPANY SNAPSHOT
- TABLE 111. NUMOCITY: PRODUCT SEGMENTS
- TABLE 112. NUMOCITY: PRODUCT PORTFOLIO
- TABLE 113. NUMOCITY: KEY STRATERGIES
- TABLE 114. OYIKA: KEY EXECUTIVES
- TABLE 115. OYIKA: COMPANY SNAPSHOT
- TABLE 116. OYIKA: PRODUCT SEGMENTS
- TABLE 117. OYIKA: PRODUCT PORTFOLIO
- TABLE 118. OYIKA: KEY STRATERGIES
- TABLE 119. AULTON NEW ENERGY AUTOMOTIVE TECHNOLOGY CO., LTD.: KEY EXECUTIVES
- TABLE 120. AULTON NEW ENERGY AUTOMOTIVE TECHNOLOGY CO., LTD.: COMPANY SNAPSHOT
- TABLE 121. AULTON NEW ENERGY AUTOMOTIVE TECHNOLOGY CO., LTD.: PRODUCT SEGMENTS
- TABLE 122. AULTON NEW ENERGY AUTOMOTIVE TECHNOLOGY CO., LTD.: PRODUCT PORTFOLIO
- TABLE 123. AULTON NEW ENERGY AUTOMOTIVE TECHNOLOGY CO., LTD.: KEY STRATERGIES
- TABLE 124. KYMCO: KEY EXECUTIVES
- TABLE 125. KYMCO: COMPANY SNAPSHOT
- TABLE 126. KYMCO: PRODUCT SEGMENTS
- TABLE 127. KYMCO: PRODUCT PORTFOLIO
- TABLE 128. KYMCO: KEY STRATERGIES
LIST OF FIGURES
- FIGURE 01. ELECTRIC VEHICLE BATTERY SWAPPING MARKET, 2022-2032
- FIGURE 02. SEGMENTATION OF ELECTRIC VEHICLE BATTERY SWAPPING MARKET, 2022-2032
- FIGURE 03. TOP INVESTMENT POCKETS IN ELECTRIC VEHICLE BATTERY SWAPPING MARKET (2023-2032)
- FIGURE 04. MODERATE BARGAINING POWER OF SUPPLIERS
- FIGURE 05. MODERATE BARGAINING POWER OF BUYERS
- FIGURE 06. MODERATE THREAT OF SUBSTITUTES
- FIGURE 07. MODERATE-TO-HIGH THREAT OF NEW ENTRANTS
- FIGURE 08. MODERATE-TO-HIGH INTENSITY OF RIVALRY
- FIGURE 09. DRIVERS, RESTRAINTS AND OPPORTUNITIES: GLOBALELECTRIC VEHICLE BATTERY SWAPPING MARKET
- FIGURE 10. ELECTRIC VEHICLE BATTERY SWAPPING MARKET, BY STATION TYPE, 2022(%)
- FIGURE 11. COMPARATIVE SHARE ANALYSIS OF ELECTRIC VEHICLE BATTERY SWAPPING MARKET FOR AUTOMATED, BY COUNTRY 2022 AND 2032(%)
- FIGURE 12. COMPARATIVE SHARE ANALYSIS OF ELECTRIC VEHICLE BATTERY SWAPPING MARKET FOR MANUAL, BY COUNTRY 2022 AND 2032(%)
- FIGURE 13. ELECTRIC VEHICLE BATTERY SWAPPING MARKET, BY VEHICLE TYPE, 2022(%)
- FIGURE 14. COMPARATIVE SHARE ANALYSIS OF ELECTRIC VEHICLE BATTERY SWAPPING MARKET FOR TWO-WHEELER, BY COUNTRY 2022 AND 2032(%)
- FIGURE 15. COMPARATIVE SHARE ANALYSIS OF ELECTRIC VEHICLE BATTERY SWAPPING MARKET FOR THREE-WHEELER, BY COUNTRY 2022 AND 2032(%)
- FIGURE 16. COMPARATIVE SHARE ANALYSIS OF ELECTRIC VEHICLE BATTERY SWAPPING MARKET FOR FOUR-WHEELER, BY COUNTRY 2022 AND 2032(%)
- FIGURE 17. COMPARATIVE SHARE ANALYSIS OF ELECTRIC VEHICLE BATTERY SWAPPING MARKET FOR COMMERCIAL VEHICLES, BY COUNTRY 2022 AND 2032(%)
- FIGURE 18. ELECTRIC VEHICLE BATTERY SWAPPING MARKET, BY SERVICE TYPE, 2022(%)
- FIGURE 19. COMPARATIVE SHARE ANALYSIS OF ELECTRIC VEHICLE BATTERY SWAPPING MARKET FOR SUBSCRIPTION MODEL, BY COUNTRY 2022 AND 2032(%)
- FIGURE 20. COMPARATIVE SHARE ANALYSIS OF ELECTRIC VEHICLE BATTERY SWAPPING MARKET FOR PAY-PER-USE MODEL, BY COUNTRY 2022 AND 2032(%)
- FIGURE 21. ELECTRIC VEHICLE BATTERY SWAPPING MARKET BY REGION, 2022
- FIGURE 22. U.S. ELECTRIC VEHICLE BATTERY SWAPPING MARKET, 2022-2032 ($MILLION)
- FIGURE 23. CANADA ELECTRIC VEHICLE BATTERY SWAPPING MARKET, 2022-2032 ($MILLION)
- FIGURE 24. MEXICO ELECTRIC VEHICLE BATTERY SWAPPING MARKET, 2022-2032 ($MILLION)
- FIGURE 25. UK ELECTRIC VEHICLE BATTERY SWAPPING MARKET, 2022-2032 ($MILLION)
- FIGURE 26. GERMANY ELECTRIC VEHICLE BATTERY SWAPPING MARKET, 2022-2032 ($MILLION)
- FIGURE 27. NETHERLANDS ELECTRIC VEHICLE BATTERY SWAPPING MARKET, 2022-2032 ($MILLION)
- FIGURE 28. NORWAY ELECTRIC VEHICLE BATTERY SWAPPING MARKET, 2022-2032 ($MILLION)
- FIGURE 29. REST OF EUROPE ELECTRIC VEHICLE BATTERY SWAPPING MARKET, 2022-2032 ($MILLION)
- FIGURE 30. CHINA ELECTRIC VEHICLE BATTERY SWAPPING MARKET, 2022-2032 ($MILLION)
- FIGURE 31. JAPAN ELECTRIC VEHICLE BATTERY SWAPPING MARKET, 2022-2032 ($MILLION)
- FIGURE 32. INDIA ELECTRIC VEHICLE BATTERY SWAPPING MARKET, 2022-2032 ($MILLION)
- FIGURE 33. SOUTH KOREA ELECTRIC VEHICLE BATTERY SWAPPING MARKET, 2022-2032 ($MILLION)
- FIGURE 34. REST OF ASIA-PACIFIC ELECTRIC VEHICLE BATTERY SWAPPING MARKET, 2022-2032 ($MILLION)
- FIGURE 35. LATIN AMERICA ELECTRIC VEHICLE BATTERY SWAPPING MARKET, 2022-2032 ($MILLION)
- FIGURE 36. MIDDLE EAST ELECTRIC VEHICLE BATTERY SWAPPING MARKET, 2022-2032 ($MILLION)
- FIGURE 37. AFRICA ELECTRIC VEHICLE BATTERY SWAPPING MARKET, 2022-2032 ($MILLION)
- FIGURE 38. TOP WINNING STRATEGIES, BY YEAR
- FIGURE 39. TOP WINNING STRATEGIES, BY DEVELOPMENT
- FIGURE 40. TOP WINNING STRATEGIES, BY COMPANY
- FIGURE 41. PRODUCT MAPPING OF TOP 10 PLAYERS
- FIGURE 42. COMPETITIVE DASHBOARD
- FIGURE 43. COMPETITIVE HEATMAP: ELECTRIC VEHICLE BATTERY SWAPPING MARKET
- FIGURE 44. TOP PLAYER POSITIONING, 2022
- FIGURE 45. AMARA RAJA BATTERIES LTD.: NET SALES, 2019-2021 ($MILLION)
- FIGURE 46. AMARA RAJA BATTERIES LTD.: RESEARCH & DEVELOPMENT EXPENDITURE, 2019-2021 ($MILLION)
- FIGURE 47. AMARA RAJA BATTERIES LTD.: REVENUE SHARE BY SEGMENT, 2021 (%)
- FIGURE 48. AMARA RAJA BATTERIES LTD.: REVENUE SHARE BY REGION, 2021 (%)
- FIGURE 49. GOGORO: NET SALES, 2020-2022 ($MILLION)
- FIGURE 50. GOGORO: RESEARCH & DEVELOPMENT EXPENDITURE, 2020-2022 ($MILLION)
- FIGURE 51. GOGORO: REVENUE SHARE BY SEGMENT, 2022 (%)
- FIGURE 52. GOGORO: REVENUE SHARE BY REGION, 2022 (%)
- FIGURE 53. NIO: NET SALES, 2020-2022 ($MILLION)
- FIGURE 54. NIO: RESEARCH & DEVELOPMENT EXPENDITURE, 2020-2022 ($MILLION)
- FIGURE 55. NIO: REVENUE SHARE BY SEGMENT, 2022 (%)
The Global Electric vehicle battery swapping Market is expected to experience a significant growth rate of 39.6% from 2023-2032 owing to rising demand for electric vehicles- Allied Market Research.
The concept of battery swapping aims to address the challenges of limited charging infrastructure, long charging times, and range anxiety for electric vehicle owners. It offers a potential solution for drivers who may not have access to home or workplace charging facilities, or for those who require quick turnaround times for their vehicles, such as fleet operators or taxi services. While battery swapping has the advantage of reducing charging time, it presents challenges such as standardization of battery packs across different vehicle models, managing battery degradation, ensuring battery safety and reliability, and establishing a widespread network of swapping stations.
Increase in demand for electric vehicles, coupled with lack of adequate public charging facilities, reduced time for electric vehicle charging, and addressing range anxiety are anticipated to drive the market growth. However, differentiation in battery technology & design and high initial set-up & operating cost of battery swapping station hamper the market growth. Further, rapid emergence of shared e-mobility and introduction of innovative & advanced battery swapping model and services by market players are some factors that are expected to offer lucrative opportunities for the market growth during the forecast period.
The market is segmented on the basis of station type, service type, vehicle type, application, and region. By station type, it is categorized into automated and manual. By service type, it is bifurcated into subscription model and pay-per-use model. By vehicle type, it is categorized into two-wheeler, three-wheeler, four-wheeler, and commercial vehicles. Region-wise, it is analysed across North America, Europe, Asia-Pacific, and LAMEA.
The major companies profiled in the electric vehicle battery swapping market include Amara Raja Batteries Ltd., Aulton New Energy Automotive Technology Co., Ltd., ECHARGEUP, Esmito Solutions Pvt Ltd, Gogoro, Inc., KYMCO, Lithion Power Pvt Ltd, NIO, Inc., Numocity, and Oyika Pte Ltd.
Key Benefits For Stakeholders
- This report provides a quantitative analysis of the market segments, current trends, estimations, and dynamics of the electric vehicle battery swapping market analysis from 2022 to 2032 to identify the prevailing electric vehicle battery swapping market opportunities.
- The market research is offered along with information related to key drivers, restraints, and opportunities.
- Porter's five forces analysis highlights the potency of buyers and suppliers to enable stakeholders make profit-oriented business decisions and strengthen their supplier-buyer network.
- In-depth analysis of the electric vehicle battery swapping market segmentation assists to determine the prevailing market opportunities.
- Major countries in each region are mapped according to their revenue contribution to the global market.
- Market player positioning facilitates benchmarking and provides a clear understanding of the present position of the market players.
- The report includes the analysis of the regional as well as global electric vehicle battery swapping market trends, key players, market segments, application areas, and market growth strategies.
Key Market Segments
By Station Type
- Automated
- Manual
By Vehicle Type
- Two-wheeler
- Three-wheeler
- Four-wheeler
- Commercial Vehicles
By Service Type
- Subscription model
- Pay-per-use model
By Region
- North America
- U.S.
- Canada
- Mexico
- Europe
- UK
- Germany
- Netherlands
- Norway
- Rest of Europe
- Asia-Pacific
- China
- Japan
- India
- South Korea
- Rest of Asia-Pacific
- LAMEA
- Latin America
- Middle East
- Africa
Key Market Players:
- ECHARGEUP
- NIO
- Lithion Power Private Limited
- Oyika
- KYMCO
- Gogoro
- Amara Raja Batteries Ltd.
- Numocity
- Aulton New Energy Automotive Technology Co., Ltd.
- Esmito Solutions Pvt Ltd
TABLE OF CONTENTS
CHAPTER 1: INTRODUCTION
- 1.1. Report description
- 1.2. Key market segments
- 1.3. Key benefits to the stakeholders
- 1.4. Research Methodology
- 1.4.1. Primary research
- 1.4.2. Secondary research
- 1.4.3. Analyst tools and models
CHAPTER 2: EXECUTIVE SUMMARY
- 2.1. CXO Perspective
CHAPTER 3: MARKET OVERVIEW
- 3.1. Market definition and scope
- 3.2. Key findings
- 3.2.1. Top impacting factors
- 3.2.2. Top investment pockets
- 3.3. Porter's five forces analysis
- 3.3.1. Bargaining power of suppliers
- 3.3.2. Bargaining power of buyers
- 3.3.3. Threat of substitutes
- 3.3.4. Threat of new entrants
- 3.3.5. Intensity of rivalry
- 3.4. Market dynamics
- 3.4.1. Drivers
- 3.4.1.1. Increase in demand for electric vehicles, coupled with lack of adequate public charging facilities
- 3.4.1.2. Reduced time for electric vehicle charging
- 3.4.1.3. Addressing range anxiety
- 3.4.1. Drivers
- 3.4.2. Restraints
- 3.4.2.1. Differentiation in battery technology and design
- 3.4.2.2. High initial set-up and operating cost of battery swapping stations
- 3.4.3. Opportunities
- 3.4.3.1. Rapid emergence of shared e-mobility
- 3.4.3.2. Introduction of innovative & advanced battery swapping models and services
- 3.5. COVID-19 Impact Analysis on the market
CHAPTER 4: ELECTRIC VEHICLE BATTERY SWAPPING MARKET, BY STATION TYPE
- 4.1. Overview
- 4.1.1. Market size and forecast
- 4.2. Automated
- 4.2.1. Key market trends, growth factors and opportunities
- 4.2.2. Market size and forecast, by region
- 4.2.3. Market share analysis by country
- 4.3. Manual
- 4.3.1. Key market trends, growth factors and opportunities
- 4.3.2. Market size and forecast, by region
- 4.3.3. Market share analysis by country
CHAPTER 5: ELECTRIC VEHICLE BATTERY SWAPPING MARKET, BY VEHICLE TYPE
- 5.1. Overview
- 5.1.1. Market size and forecast
- 5.2. Two-wheeler
- 5.2.1. Key market trends, growth factors and opportunities
- 5.2.2. Market size and forecast, by region
- 5.2.3. Market share analysis by country
- 5.3. Three-wheeler
- 5.3.1. Key market trends, growth factors and opportunities
- 5.3.2. Market size and forecast, by region
- 5.3.3. Market share analysis by country
- 5.4. Four-wheeler
- 5.4.1. Key market trends, growth factors and opportunities
- 5.4.2. Market size and forecast, by region
- 5.4.3. Market share analysis by country
- 5.5. Commercial Vehicles
- 5.5.1. Key market trends, growth factors and opportunities
- 5.5.2. Market size and forecast, by region
- 5.5.3. Market share analysis by country
CHAPTER 6: ELECTRIC VEHICLE BATTERY SWAPPING MARKET, BY SERVICE TYPE
- 6.1. Overview
- 6.1.1. Market size and forecast
- 6.2. Subscription model
- 6.2.1. Key market trends, growth factors and opportunities
- 6.2.2. Market size and forecast, by region
- 6.2.3. Market share analysis by country
- 6.3. Pay-per-use model
- 6.3.1. Key market trends, growth factors and opportunities
- 6.3.2. Market size and forecast, by region
- 6.3.3. Market share analysis by country
CHAPTER 7: ELECTRIC VEHICLE BATTERY SWAPPING MARKET, BY REGION
- 7.1. Overview
- 7.1.1. Market size and forecast By Region
- 7.2. North America
- 7.2.1. Key trends and opportunities
- 7.2.2. Market size and forecast, by Station Type
- 7.2.3. Market size and forecast, by Vehicle Type
- 7.2.4. Market size and forecast, by Service Type
- 7.2.5. Market size and forecast, by country
- 7.2.5.1. U.S.
- 7.2.5.1.1. Key market trends, growth factors and opportunities
- 7.2.5.1.2. Market size and forecast, by Station Type
- 7.2.5.1.3. Market size and forecast, by Vehicle Type
- 7.2.5.1.4. Market size and forecast, by Service Type
- 7.2.5.2. Canada
- 7.2.5.2.1. Key market trends, growth factors and opportunities
- 7.2.5.2.2. Market size and forecast, by Station Type
- 7.2.5.2.3. Market size and forecast, by Vehicle Type
- 7.2.5.2.4. Market size and forecast, by Service Type
- 7.2.5.3. Mexico
- 7.2.5.3.1. Key market trends, growth factors and opportunities
- 7.2.5.3.2. Market size and forecast, by Station Type
- 7.2.5.3.3. Market size and forecast, by Vehicle Type
- 7.2.5.3.4. Market size and forecast, by Service Type
- 7.3. Europe
- 7.3.1. Key trends and opportunities
- 7.3.2. Market size and forecast, by Station Type
- 7.3.3. Market size and forecast, by Vehicle Type
- 7.3.4. Market size and forecast, by Service Type
- 7.3.5. Market size and forecast, by country
- 7.3.5.1. UK
- 7.3.5.1.1. Key market trends, growth factors and opportunities
- 7.3.5.1.2. Market size and forecast, by Station Type
- 7.3.5.1.3. Market size and forecast, by Vehicle Type
- 7.3.5.1.4. Market size and forecast, by Service Type
- 7.3.5.2. Germany
- 7.3.5.2.1. Key market trends, growth factors and opportunities
- 7.3.5.2.2. Market size and forecast, by Station Type
- 7.3.5.2.3. Market size and forecast, by Vehicle Type
- 7.3.5.2.4. Market size and forecast, by Service Type
- 7.3.5.3. Netherlands
- 7.3.5.3.1. Key market trends, growth factors and opportunities
- 7.3.5.3.2. Market size and forecast, by Station Type
- 7.3.5.3.3. Market size and forecast, by Vehicle Type
- 7.3.5.3.4. Market size and forecast, by Service Type
- 7.3.5.4. Norway
- 7.3.5.4.1. Key market trends, growth factors and opportunities
- 7.3.5.4.2. Market size and forecast, by Station Type
- 7.3.5.4.3. Market size and forecast, by Vehicle Type
- 7.3.5.4.4. Market size and forecast, by Service Type
- 7.3.5.5. Rest of Europe
- 7.3.5.5.1. Key market trends, growth factors and opportunities
- 7.3.5.5.2. Market size and forecast, by Station Type
- 7.3.5.5.3. Market size and forecast, by Vehicle Type
- 7.3.5.5.4. Market size and forecast, by Service Type
- 7.4. Asia-Pacific
- 7.4.1. Key trends and opportunities
- 7.4.2. Market size and forecast, by Station Type
- 7.4.3. Market size and forecast, by Vehicle Type
- 7.4.4. Market size and forecast, by Service Type
- 7.4.5. Market size and forecast, by country
- 7.4.5.1. China
- 7.4.5.1.1. Key market trends, growth factors and opportunities
- 7.4.5.1.2. Market size and forecast, by Station Type
- 7.4.5.1.3. Market size and forecast, by Vehicle Type
- 7.4.5.1.4. Market size and forecast, by Service Type
- 7.4.5.2. Japan
- 7.4.5.2.1. Key market trends, growth factors and opportunities
- 7.4.5.2.2. Market size and forecast, by Station Type
- 7.4.5.2.3. Market size and forecast, by Vehicle Type
- 7.4.5.2.4. Market size and forecast, by Service Type
- 7.4.5.3. India
- 7.4.5.3.1. Key market trends, growth factors and opportunities
- 7.4.5.3.2. Market size and forecast, by Station Type
- 7.4.5.3.3. Market size and forecast, by Vehicle Type
- 7.4.5.3.4. Market size and forecast, by Service Type
- 7.4.5.4. South Korea
- 7.4.5.4.1. Key market trends, growth factors and opportunities
- 7.4.5.4.2. Market size and forecast, by Station Type
- 7.4.5.4.3. Market size and forecast, by Vehicle Type
- 7.4.5.4.4. Market size and forecast, by Service Type
- 7.4.5.5. Rest of Asia-Pacific
- 7.4.5.5.1. Key market trends, growth factors and opportunities
- 7.4.5.5.2. Market size and forecast, by Station Type
- 7.4.5.5.3. Market size and forecast, by Vehicle Type
- 7.4.5.5.4. Market size and forecast, by Service Type
- 7.5. LAMEA
- 7.5.1. Key trends and opportunities
- 7.5.2. Market size and forecast, by Station Type
- 7.5.3. Market size and forecast, by Vehicle Type
- 7.5.4. Market size and forecast, by Service Type
- 7.5.5. Market size and forecast, by country
- 7.5.5.1. Latin America
- 7.5.5.1.1. Key market trends, growth factors and opportunities
- 7.5.5.1.2. Market size and forecast, by Station Type
- 7.5.5.1.3. Market size and forecast, by Vehicle Type
- 7.5.5.1.4. Market size and forecast, by Service Type
- 7.5.5.2. Middle East
- 7.5.5.2.1. Key market trends, growth factors and opportunities
- 7.5.5.2.2. Market size and forecast, by Station Type
- 7.5.5.2.3. Market size and forecast, by Vehicle Type
- 7.5.5.2.4. Market size and forecast, by Service Type
- 7.5.5.3. Africa
- 7.5.5.3.1. Key market trends, growth factors and opportunities
- 7.5.5.3.2. Market size and forecast, by Station Type
- 7.5.5.3.3. Market size and forecast, by Vehicle Type
- 7.5.5.3.4. Market size and forecast, by Service Type
CHAPTER 8: COMPETITIVE LANDSCAPE
- 8.1. Introduction
- 8.2. Top winning strategies
- 8.3. Product Mapping of Top 10 Player
- 8.4. Competitive Dashboard
- 8.5. Competitive Heatmap
- 8.6. Top player positioning, 2022
CHAPTER 9: COMPANY PROFILES
- 9.1. Amara Raja Batteries Ltd.
- 9.1.1. Company overview
- 9.1.2. Key Executives
- 9.1.3. Company snapshot
- 9.1.4. Operating business segments
- 9.1.5. Product portfolio
- 9.1.6. Business performance
- 9.1.7. Key strategic moves and developments
- 9.2. ECHARGEUP
- 9.2.1. Company overview
- 9.2.2. Key Executives
- 9.2.3. Company snapshot
- 9.2.4. Operating business segments
- 9.2.5. Product portfolio
- 9.2.6. Key strategic moves and developments
- 9.3. Esmito Solutions Pvt Ltd
- 9.3.1. Company overview
- 9.3.2. Key Executives
- 9.3.3. Company snapshot
- 9.3.4. Operating business segments
- 9.3.5. Product portfolio
- 9.3.6. Key strategic moves and developments
- 9.4. Gogoro
- 9.4.1. Company overview
- 9.4.2. Key Executives
- 9.4.3. Company snapshot
- 9.4.4. Operating business segments
- 9.4.5. Product portfolio
- 9.4.6. Business performance
- 9.4.7. Key strategic moves and developments
- 9.5. Lithion Power Private Limited
- 9.5.1. Company overview
- 9.5.2. Key Executives
- 9.5.3. Company snapshot
- 9.5.4. Operating business segments
- 9.5.5. Product portfolio
- 9.6. NIO
- 9.6.1. Company overview
- 9.6.2. Key Executives
- 9.6.3. Company snapshot
- 9.6.4. Operating business segments
- 9.6.5. Product portfolio
- 9.6.6. Business performance
- 9.6.7. Key strategic moves and developments
- 9.7. Numocity
- 9.7.1. Company overview
- 9.7.2. Key Executives
- 9.7.3. Company snapshot
- 9.7.4. Operating business segments
- 9.7.5. Product portfolio
- 9.7.6. Key strategic moves and developments
- 9.8. Oyika
- 9.8.1. Company overview
- 9.8.2. Key Executives
- 9.8.3. Company snapshot
- 9.8.4. Operating business segments
- 9.8.5. Product portfolio
- 9.8.6. Key strategic moves and developments
- 9.9. Aulton New Energy Automotive Technology Co., Ltd.
- 9.9.1. Company overview
- 9.9.2. Key Executives
- 9.9.3. Company snapshot
- 9.9.4. Operating business segments
- 9.9.5. Product portfolio
- 9.9.6. Key strategic moves and developments
- 9.10. KYMCO
- 9.10.1. Company overview
- 9.10.2. Key Executives
- 9.10.3. Company snapshot
- 9.10.4. Operating business segments
- 9.10.5. Product portfolio
- 9.10.6. Key strategic moves and developments