|
|
市場調査レポート
商品コード
1344486
スマートホームハードウェア市場:製品タイプ別、世界の機会分析と産業予測、2023-2032年Smart Home Hardware Market By Product Type (Security and Surveillance, Smart Appliances, Smart Infotainment, Utility Management, Others): Global Opportunity Analysis and Industry Forecast, 2023-2032 |
||||||
|
|
|||||||
|
|||||||


| スマートホームハードウェア市場:製品タイプ別、世界の機会分析と産業予測、2023-2032年 |
|
出版日: 2023年06月01日
発行: Allied Market Research
ページ情報: 英文 290 Pages
納期: 2~3営業日
|

- 全表示
- 概要
- 図表
- 目次
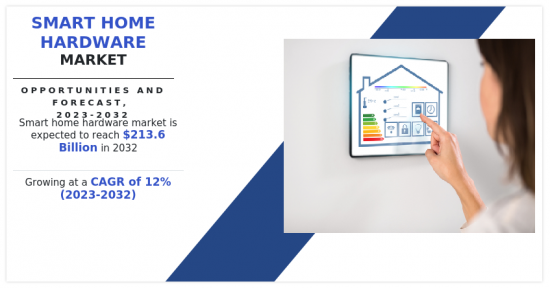
スマートホームハードウェア市場は2022年に724億米ドルと評価され、2023年から2032年にかけてCAGR 12%で成長し、2032年には2,136億米ドルに達すると推定されています。
スマートホームハードウェアは、住宅所有者が自宅の複数の機器を制御できるようにする、相互接続された多数のシステムや技術で構成されています。例えばサーモスタットはスマートホーム機器の一例で、個人の好みに基づいて温度を管理し、快適性とエネルギー経済性を保証することができます。別の例としては、スマート照明システムがあり、誰かが部屋に入ると照明をつけたり設定を変えたりすることができます。また、エネルギーの監視と管理もスマートホーム機器の重要な特徴です。スマートプラグ、スマートメーター、エネルギー監視システムにより、住宅所有者はエネルギー使用量を測定し、最適化することができます。これは、エネルギー使用の削減と持続可能性の促進に役立ちます。
スマートホーム市場は、インターネット、スマートフォン、ソーシャルネットワークの利用の増加など、多くの要因によって成長しています。市場成長の原動力となっているのは、世界の都市化の進展と新興諸国における所得の増加であり、これによって新しい生活様式がもたらされています。スマートホーム技術の主な動向のひとつに、家庭用人工知能システムの利用増加があります。人工知能は、AIホームオートメーションを次のレベルに引き上げるために使用することができます。サムスン・ファミリー・ハブが冷蔵庫の中のものを検知して買い物リストを作成できるようにするのは、コンピューター・ビジョンか、音声を分析するNLPエンジンを採用した音声制御スマート・デバイスかもしれないです。AIは、スマートホームユーザーのユーザー体験を向上させるために、このようなシステムで使用されます。こうした要因がスマートホームハードウェア市場のシェアを押し上げると予想されます。
スマートホームデバイスが最適に機能するためには、安定した信頼性の高いインターネット接続に大きく依存しています。インターネット接続に障害が発生すると、これらの機器の性能や機能に影響を及ぼす可能性があります。停電やネットワークの停止は、スマートホームデバイスを一時的にアクセス不能または機能不能にし、ユーザーエクスペリエンスに影響を与える可能性があります。技術の進歩が急速に進むと、スマートホームのハードウェア・デバイスが使えなくなる可能性があります。新しい技術が登場し主流になるにつれ、古いデバイスは互換性を欠いたり、新しい特徴や機能を利用できなくなったりする可能性があります。
スマートホームハードウェア市場は、遠隔健康モニタリング、アンビエント・アシステッド・リビング、個別化ヘルスケアなど、ヘルス&ウェルネス・アプリケーションへと拡大しています。スマートホームデバイスは、バイタルサインを追跡し、服薬リマインダーを提供し、ウェルビーイングとその場での高齢化をサポートするアンビエント環境を作り出すことができます。スマートグリッドやスマートシティ・インフラストラクチャとスマートホームハードウェアを統合することで、エネルギー管理、需要応答、グリッド最適化の機会がもたらされます。スマートホームは、ダイナミック・プライシング・プログラム、負荷管理、再生可能エネルギーの統合に参加することで、より持続可能で効率的なエネルギー・エコシステムの構築に重要な役割を果たすことができます。
COVID-19の大流行は世界のサプライチェーンに混乱をもたらし、スマートホームハードウェアの製造と流通に影響を与えました。ロックダウン、旅行制限、一時的な工場閉鎖により、部品の生産と配送が中断され、製品発売の遅れや特定の機器の品不足につながっています。こうしたサプライチェーンの課題は、市場におけるスマートホームハードウェアの入手可能性とアクセシビリティに影響を与えました。パンデミックの間、市場参入企業ではスマートホームシステムの設置が減少しました。スマートホーム製品の中には、専門家による設置や現場でのプログラミングが必要なものもあります。そのため、購入者はCOVID-19パンデミック時に外部の人との接触を避けるために、これらのデバイスの設置をためらっています。
目次
第1章 イントロダクション
第2章 エグゼクティブサマリー
第3章 市場概要
- 市場の定義と範囲
- 主な調査結果
- 影響要因
- 主な投資機会
- ポーターのファイブフォース分析
- 市場力学
- 促進要因
- 抑制要因
- 機会
- COVID-19市場への影響分析
- 平均販売価格
- 市場シェア分析
- ブランドシェア分析
- バリューチェーン分析
- 主要規制分析
- 特許情勢
- 規制ガイドライン
- 貿易データ分析
第4章 スマートホームハードウェア市場:製品タイプ別
- 概要
- セキュリティと監視
- スマート家電
- スマート・インフォテインメント
- ユーティリティ管理
- その他
第5章 スマートホームハードウェア市場:地域別
- 概要
- 北米
- 米国
- カナダ
- メキシコ
- 欧州
- ドイツ
- 英国
- フランス
- スペイン
- イタリア
- その他欧州
- アジア太平洋
- 中国
- 日本
- インド
- 韓国
- オーストラリア
- その他アジア太平洋地域
- ラテンアメリカ・中東・アフリカ
- ブラジル
- UAE
- サウジアラビア
- 南アフリカ
- その他の地域
第6章 競合情勢
- イントロダクション
- 主要成功戦略
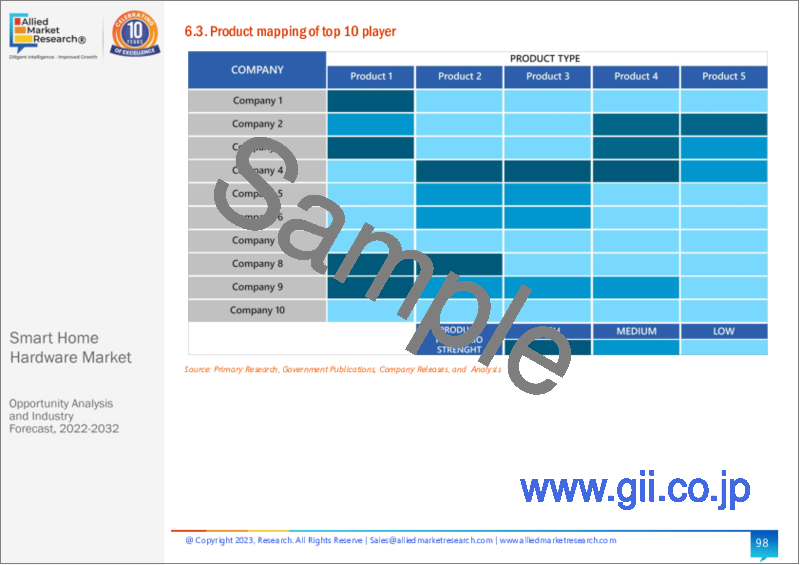
- 主要10社の製品マッピング
- 競合ダッシュボード
- 競合ヒートマップ
- 主要企業のポジショニング、2022年
第7章 企業プロファイル
- Google LLC(Alphabet)
- HONEYWELL CORPORATION, INC.
- Amazon.com Inc.
- Schneider Electric SE.
- Johnson Controls International plc
- ABB Ltd.
- Legrand SA
- Panasonic Corporation
- Samsung Electronics Co Ltd
- General Electric
LIST OF TABLES
- TABLE 01. GLOBAL SMART HOME HARDWARE MARKET, BY PRODUCT TYPE, 2022-2032 ($MILLION)
- TABLE 02. SMART HOME HARDWARE MARKET FOR SECURITY AND SURVEILLANCE, BY REGION, 2022-2032 ($MILLION)
- TABLE 03. SMART HOME HARDWARE MARKET FOR SMART APPLIANCES, BY REGION, 2022-2032 ($MILLION)
- TABLE 04. SMART HOME HARDWARE MARKET FOR SMART INFOTAINMENT, BY REGION, 2022-2032 ($MILLION)
- TABLE 05. SMART HOME HARDWARE MARKET FOR UTILITY MANAGEMENT, BY REGION, 2022-2032 ($MILLION)
- TABLE 06. SMART HOME HARDWARE MARKET FOR OTHERS, BY REGION, 2022-2032 ($MILLION)
- TABLE 07. SMART HOME HARDWARE MARKET, BY REGION, 2022-2032 ($MILLION)
- TABLE 08. NORTH AMERICA SMART HOME HARDWARE MARKET, BY PRODUCT TYPE, 2022-2032 ($MILLION)
- TABLE 09. NORTH AMERICA SMART HOME HARDWARE MARKET, BY COUNTRY, 2022-2032 ($MILLION)
- TABLE 10. U.S. SMART HOME HARDWARE MARKET, BY PRODUCT TYPE, 2022-2032 ($MILLION)
- TABLE 11. CANADA SMART HOME HARDWARE MARKET, BY PRODUCT TYPE, 2022-2032 ($MILLION)
- TABLE 12. MEXICO SMART HOME HARDWARE MARKET, BY PRODUCT TYPE, 2022-2032 ($MILLION)
- TABLE 13. EUROPE SMART HOME HARDWARE MARKET, BY PRODUCT TYPE, 2022-2032 ($MILLION)
- TABLE 14. EUROPE SMART HOME HARDWARE MARKET, BY COUNTRY, 2022-2032 ($MILLION)
- TABLE 15. GERMANY SMART HOME HARDWARE MARKET, BY PRODUCT TYPE, 2022-2032 ($MILLION)
- TABLE 16. UK SMART HOME HARDWARE MARKET, BY PRODUCT TYPE, 2022-2032 ($MILLION)
- TABLE 17. FRANCE SMART HOME HARDWARE MARKET, BY PRODUCT TYPE, 2022-2032 ($MILLION)
- TABLE 18. SPAIN SMART HOME HARDWARE MARKET, BY PRODUCT TYPE, 2022-2032 ($MILLION)
- TABLE 19. ITALY SMART HOME HARDWARE MARKET, BY PRODUCT TYPE, 2022-2032 ($MILLION)
- TABLE 20. REST OF EUROPE SMART HOME HARDWARE MARKET, BY PRODUCT TYPE, 2022-2032 ($MILLION)
- TABLE 21. ASIA-PACIFIC SMART HOME HARDWARE MARKET, BY PRODUCT TYPE, 2022-2032 ($MILLION)
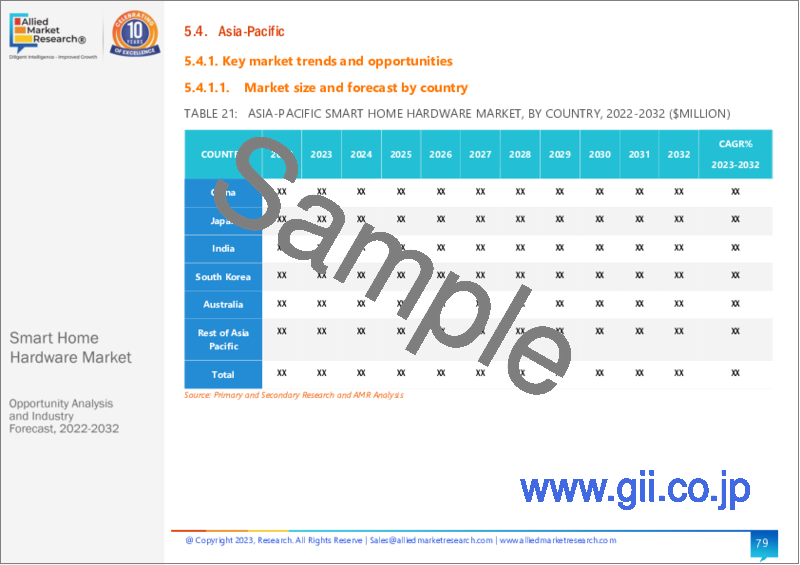
- TABLE 22. ASIA-PACIFIC SMART HOME HARDWARE MARKET, BY COUNTRY, 2022-2032 ($MILLION)
- TABLE 23. CHINA SMART HOME HARDWARE MARKET, BY PRODUCT TYPE, 2022-2032 ($MILLION)
- TABLE 24. JAPAN SMART HOME HARDWARE MARKET, BY PRODUCT TYPE, 2022-2032 ($MILLION)
- TABLE 25. INDIA SMART HOME HARDWARE MARKET, BY PRODUCT TYPE, 2022-2032 ($MILLION)
- TABLE 26. SOUTH KOREA SMART HOME HARDWARE MARKET, BY PRODUCT TYPE, 2022-2032 ($MILLION)
- TABLE 27. AUSTRALIA SMART HOME HARDWARE MARKET, BY PRODUCT TYPE, 2022-2032 ($MILLION)
- TABLE 28. REST OF ASIA-PACIFIC SMART HOME HARDWARE MARKET, BY PRODUCT TYPE, 2022-2032 ($MILLION)
- TABLE 29. LAMEA SMART HOME HARDWARE MARKET, BY PRODUCT TYPE, 2022-2032 ($MILLION)
- TABLE 30. LAMEA SMART HOME HARDWARE MARKET, BY COUNTRY, 2022-2032 ($MILLION)
- TABLE 31. BRAZIL SMART HOME HARDWARE MARKET, BY PRODUCT TYPE, 2022-2032 ($MILLION)
- TABLE 32. UAE SMART HOME HARDWARE MARKET, BY PRODUCT TYPE, 2022-2032 ($MILLION)
- TABLE 33. SAUDI ARABIA SMART HOME HARDWARE MARKET, BY PRODUCT TYPE, 2022-2032 ($MILLION)
- TABLE 34. SOUTH AFRICA SMART HOME HARDWARE MARKET, BY PRODUCT TYPE, 2022-2032 ($MILLION)
- TABLE 35. REST OF LAMEA SMART HOME HARDWARE MARKET, BY PRODUCT TYPE, 2022-2032 ($MILLION)
- TABLE 36. GOOGLE LLC (ALPHABET): KEY EXECUTIVES
- TABLE 37. GOOGLE LLC (ALPHABET): COMPANY SNAPSHOT
- TABLE 38. HONEYWELL CORPORATION, INC.: KEY EXECUTIVES
- TABLE 39. HONEYWELL CORPORATION, INC.: COMPANY SNAPSHOT
- TABLE 40. AMAZON.COM INC.: KEY EXECUTIVES
- TABLE 41. AMAZON.COM INC.: COMPANY SNAPSHOT
- TABLE 42. SCHNEIDER ELECTRIC SE.: KEY EXECUTIVES
- TABLE 43. SCHNEIDER ELECTRIC SE.: COMPANY SNAPSHOT
- TABLE 44. JOHNSON CONTROLS INTERNATIONAL PLC: KEY EXECUTIVES
- TABLE 45. JOHNSON CONTROLS INTERNATIONAL PLC: COMPANY SNAPSHOT
- TABLE 46. ABB LTD.: KEY EXECUTIVES
- TABLE 47. ABB LTD.: COMPANY SNAPSHOT
- TABLE 48. LEGRAND SA: KEY EXECUTIVES
- TABLE 49. LEGRAND SA: COMPANY SNAPSHOT
- TABLE 50. PANASONIC CORPORATION: KEY EXECUTIVES
- TABLE 51. PANASONIC CORPORATION: COMPANY SNAPSHOT
- TABLE 52. SAMSUNG ELECTRONICS CO LTD: KEY EXECUTIVES
- TABLE 53. SAMSUNG ELECTRONICS CO LTD: COMPANY SNAPSHOT
- TABLE 54. GENERAL ELECTRIC: KEY EXECUTIVES
- TABLE 55. GENERAL ELECTRIC: COMPANY SNAPSHOT
LIST OF FIGURES
- FIGURE 01. SMART HOME HARDWARE MARKET, 2022-2032
- FIGURE 02. SEGMENTATION OF SMART HOME HARDWARE MARKET, 2022-2032
- FIGURE 03. TOP INVESTMENT POCKETS IN SMART HOME HARDWARE MARKET (2023-2032)
- FIGURE 04. BARGAINING POWER OF SUPPLIERS
- FIGURE 05. BARGAINING POWER OF BUYERS
- FIGURE 06. THREAT OF SUBSTITUTION
- FIGURE 07. THREAT OF SUBSTITUTION
- FIGURE 08. COMPETITIVE RIVALRY
- FIGURE 09. DRIVERS, RESTRAINTS AND OPPORTUNITIES: GLOBALSMART HOME HARDWARE MARKET
- FIGURE 10. IMPACT OF KEY REGULATION: SMART HOME HARDWARE MARKET
- FIGURE 11. PATENT ANALYSIS BY COMPANY
- FIGURE 12. PATENT ANALYSIS BY COUNTRY
- FIGURE 13. REGULATORY GUIDELINES: SMART HOME HARDWARE MARKET
- FIGURE 13. SMART HOME HARDWARE MARKET, BY PRODUCT TYPE, 2022(%)
- FIGURE 14. COMPARATIVE SHARE ANALYSIS OF SMART HOME HARDWARE MARKET FOR SECURITY AND SURVEILLANCE, BY COUNTRY 2022 AND 2032(%)
- FIGURE 15. COMPARATIVE SHARE ANALYSIS OF SMART HOME HARDWARE MARKET FOR SMART APPLIANCES, BY COUNTRY 2022 AND 2032(%)
- FIGURE 16. COMPARATIVE SHARE ANALYSIS OF SMART HOME HARDWARE MARKET FOR SMART INFOTAINMENT, BY COUNTRY 2022 AND 2032(%)
- FIGURE 17. COMPARATIVE SHARE ANALYSIS OF SMART HOME HARDWARE MARKET FOR UTILITY MANAGEMENT, BY COUNTRY 2022 AND 2032(%)
- FIGURE 18. COMPARATIVE SHARE ANALYSIS OF SMART HOME HARDWARE MARKET FOR OTHERS, BY COUNTRY 2022 AND 2032(%)
- FIGURE 19. SMART HOME HARDWARE MARKET BY REGION, 2022
- FIGURE 20. U.S. SMART HOME HARDWARE MARKET, 2022-2032 ($MILLION)
- FIGURE 21. CANADA SMART HOME HARDWARE MARKET, 2022-2032 ($MILLION)
- FIGURE 22. MEXICO SMART HOME HARDWARE MARKET, 2022-2032 ($MILLION)
- FIGURE 23. GERMANY SMART HOME HARDWARE MARKET, 2022-2032 ($MILLION)
- FIGURE 24. UK SMART HOME HARDWARE MARKET, 2022-2032 ($MILLION)
- FIGURE 25. FRANCE SMART HOME HARDWARE MARKET, 2022-2032 ($MILLION)
- FIGURE 26. SPAIN SMART HOME HARDWARE MARKET, 2022-2032 ($MILLION)
- FIGURE 27. ITALY SMART HOME HARDWARE MARKET, 2022-2032 ($MILLION)
- FIGURE 28. REST OF EUROPE SMART HOME HARDWARE MARKET, 2022-2032 ($MILLION)
- FIGURE 29. CHINA SMART HOME HARDWARE MARKET, 2022-2032 ($MILLION)
- FIGURE 30. JAPAN SMART HOME HARDWARE MARKET, 2022-2032 ($MILLION)
- FIGURE 31. INDIA SMART HOME HARDWARE MARKET, 2022-2032 ($MILLION)
- FIGURE 32. SOUTH KOREA SMART HOME HARDWARE MARKET, 2022-2032 ($MILLION)
- FIGURE 33. AUSTRALIA SMART HOME HARDWARE MARKET, 2022-2032 ($MILLION)
- FIGURE 34. REST OF ASIA-PACIFIC SMART HOME HARDWARE MARKET, 2022-2032 ($MILLION)
- FIGURE 35. BRAZIL SMART HOME HARDWARE MARKET, 2022-2032 ($MILLION)
- FIGURE 36. UAE SMART HOME HARDWARE MARKET, 2022-2032 ($MILLION)
- FIGURE 37. SAUDI ARABIA SMART HOME HARDWARE MARKET, 2022-2032 ($MILLION)
- FIGURE 38. SOUTH AFRICA SMART HOME HARDWARE MARKET, 2022-2032 ($MILLION)
- FIGURE 39. REST OF LAMEA SMART HOME HARDWARE MARKET, 2022-2032 ($MILLION)
- FIGURE 40. TOP WINNING STRATEGIES, BY YEAR
- FIGURE 41. TOP WINNING STRATEGIES, BY DEVELOPMENT
- FIGURE 42. TOP WINNING STRATEGIES, BY COMPANY
- FIGURE 43. PRODUCT MAPPING OF TOP 10 PLAYERS
- FIGURE 44. COMPETITIVE DASHBOARD
- FIGURE 45. COMPETITIVE HEATMAP: SMART HOME HARDWARE MARKET
- FIGURE 46. TOP PLAYER POSITIONING, 2022
According to a new report published by Allied Market Research, titled, "Smart Home Hardware Market," The smart home hardware market was valued at $72.4 billion in 2022, and is estimated to reach $213.6 billion by 2032, growing at a CAGR of 12% from 2023 to 2032.
Smart home hardware consists of a number of interconnected systems and technologies that enable homeowners to control several devices at their homes. Thermostats, for example, are examples of smart home equipment that can manage temperature based on personal preferences, assuring comfort and energy economy. Another example is smart lighting systems, which may turn on or alter lighting settings when someone enters a room. Also, energy monitoring and management are important features of smart home gear. Smart plugs, smart meters, and energy monitoring systems enable homeowners to measure and optimize their energy usage. This aids in the reduction of energy use and the promotion of sustainability..
The smart home market is growing due to a number of factors include increase in use of the Internet, smartphones, and social networks. The market growth is being driven by increasing global urbanization and rising incomes in developing countries, which have resulted in new ways of living. One of the primary smart home technology trends is the increase in use of home artificial intelligence systems. Artificial intelligence can be used to take AI home automation to the next level. It might be either computer vision or voice-controlled smart devices employing NLP engines to analyze speech that allows a Samsung Family Hub to detect things in the fridge and produce a shopping list. AI is used in such systems to improve the user experience for smart home users. These factors are anticipated to boost the smart home hardware market share.
Smart home devices heavily rely on a stable and reliable Internet connection to function optimally. Any disruption in Internet connectivity can impact the performance and functionality of these devices. Power outages or network outages can temporarily render smart home devices inaccessible or non-functional, affecting the user experience. The rapid pace of technological advancements can lead to the uselessness of smart home hardware devices. As new technologies emerge and become mainstream, older devices may lack compatibility or miss out on new features and functionalities.
The smart home hardware market is expanding into health & wellness applications, such as remote health monitoring, ambient-assisted living, and personalized healthcare. Smart home devices can track vital signs, provide medication reminders, and create ambient environments to support well-being and aging-in-place. The integration of smart home hardware with smart grids and smart city infrastructure presents opportunities for energy management, demand response, and grid optimization. Smart homes can play a vital role in creating more sustainable and efficient energy ecosystems by participating in dynamic pricing programs, load management, and renewable energy integration.
The COVID-19 pandemic led to disruptions in global supply chains, affecting the manufacturing and distribution of smart home hardware. Lockdowns, travel restrictions, and temporary factory closures disrupted the production and delivery of components, leading to delays in product launches and shortages of certain devices. These supply chain challenges affected the availability and accessibility of smart home hardware in the market. During the pandemic, market participants have seen a decrease in smart home system installations. Some smart home products require professional installation and programming on-site. Therefore, buyers have been hesitant to install these devices in order to avoid contact with outside people during the COVID-19 pandemic.
The key players profiled in this report include: Google LLC (Alphabet), Honeywell Corporation, Inc., Amazon.com Inc., Schneider Electric SE., Johnson Controls International plc, ABB Ltd., Legrand SA, Panasonic Corporation, Samsung Electronics Co Ltd, and General Electric. The market players are continuously striving to achieve a dominant position in this competitive market using strategies such as collaborations and acquisitions.
Key Benefits For Stakeholders
- This report provides a quantitative analysis of the market segments, current trends, estimations, and dynamics of the smart home hardware market analysis from 2022 to 2032 to identify the prevailing smart home hardware market opportunities.
- The market research is offered along with information related to key drivers, restraints, and opportunities.
- Porter's five forces analysis highlights the potency of buyers and suppliers to enable stakeholders make profit-oriented business decisions and strengthen their supplier-buyer network.
- In-depth analysis of the smart home hardware market segmentation assists to determine the prevailing market opportunities.
- Major countries in each region are mapped according to their revenue contribution to the global market.
- Market player positioning facilitates benchmarking and provides a clear understanding of the present position of the market players.
- The report includes the analysis of the regional as well as global smart home hardware market trends, key players, market segments, application areas, and market growth strategies.
Key Market Segments
By Product Type
- Security and Surveillance
- Smart Appliances
- Smart Infotainment
- Utility Management
- Others
By Region
- North America
- U.S.
- Canada
- Mexico
- Europe
- Germany
- UK
- France
- Spain
- Italy
- Rest of Europe
- Asia-Pacific
- China
- Japan
- India
- South Korea
- Australia
- Rest of Asia-Pacific
- LAMEA
- Brazil
- UAE
- Saudi Arabia
- South Africa
- Rest of LAMEA
Key Market Players:
- ABB Ltd.
- Amazon.com Inc.
- General Electric
- Google LLC (Alphabet)
- HONEYWELL CORPORATION, INC.
- Johnson Controls International plc
- Legrand SA
- Panasonic Corporation
- Samsung Electronics Co Ltd
- Schneider Electric SE.
TABLE OF CONTENTS
CHAPTER 1: INTRODUCTION
- 1.1. Report description
- 1.2. Key market segments
- 1.3. Key benefits to the stakeholders
- 1.4. Research Methodology
- 1.4.1. Primary research
- 1.4.2. Secondary research
- 1.4.3. Analyst tools and models
CHAPTER 2: EXECUTIVE SUMMARY
- 2.1. CXO Perspective
CHAPTER 3: MARKET OVERVIEW
- 3.1. Market definition and scope
- 3.2. Key findings
- 3.2.1. Top impacting factors
- 3.2.2. Top investment pockets
- 3.3. Porter's five forces analysis
- 3.4. Market dynamics
- 3.4.1. Drivers
- 3.4.2. Restraints
- 3.4.3. Opportunities
- 3.5. COVID-19 Impact Analysis on the market
- 3.6. Average Selling Price
- 3.7. Market Share Analysis
- 3.8. Brand Share Analysis
- 3.9. Value Chain Analysis
- 3.10. Key Regulation Analysis
- 3.11. Patent Landscape
- 3.12. Regulatory Guidelines
- 3.13. Trade Data Analysis
CHAPTER 4: SMART HOME HARDWARE MARKET, BY PRODUCT TYPE
- 4.1. Overview
- 4.1.1. Market size and forecast
- 4.2. Security and Surveillance
- 4.2.1. Key market trends, growth factors and opportunities
- 4.2.2. Market size and forecast, by region
- 4.2.3. Market share analysis by country
- 4.3. Smart Appliances
- 4.3.1. Key market trends, growth factors and opportunities
- 4.3.2. Market size and forecast, by region
- 4.3.3. Market share analysis by country
- 4.4. Smart Infotainment
- 4.4.1. Key market trends, growth factors and opportunities
- 4.4.2. Market size and forecast, by region
- 4.4.3. Market share analysis by country
- 4.5. Utility Management
- 4.5.1. Key market trends, growth factors and opportunities
- 4.5.2. Market size and forecast, by region
- 4.5.3. Market share analysis by country
- 4.6. Others
- 4.6.1. Key market trends, growth factors and opportunities
- 4.6.2. Market size and forecast, by region
- 4.6.3. Market share analysis by country
CHAPTER 5: SMART HOME HARDWARE MARKET, BY REGION
- 5.1. Overview
- 5.1.1. Market size and forecast By Region
- 5.2. North America
- 5.2.1. Key trends and opportunities
- 5.2.2. Market size and forecast, by Product Type
- 5.2.3. Market size and forecast, by country
- 5.2.3.1. U.S.
- 5.2.3.1.1. Key market trends, growth factors and opportunities
- 5.2.3.1.2. Market size and forecast, by Product Type
- 5.2.3.2. Canada
- 5.2.3.2.1. Key market trends, growth factors and opportunities
- 5.2.3.2.2. Market size and forecast, by Product Type
- 5.2.3.3. Mexico
- 5.2.3.3.1. Key market trends, growth factors and opportunities
- 5.2.3.3.2. Market size and forecast, by Product Type
- 5.3. Europe
- 5.3.1. Key trends and opportunities
- 5.3.2. Market size and forecast, by Product Type
- 5.3.3. Market size and forecast, by country
- 5.3.3.1. Germany
- 5.3.3.1.1. Key market trends, growth factors and opportunities
- 5.3.3.1.2. Market size and forecast, by Product Type
- 5.3.3.2. UK
- 5.3.3.2.1. Key market trends, growth factors and opportunities
- 5.3.3.2.2. Market size and forecast, by Product Type
- 5.3.3.3. France
- 5.3.3.3.1. Key market trends, growth factors and opportunities
- 5.3.3.3.2. Market size and forecast, by Product Type
- 5.3.3.4. Spain
- 5.3.3.4.1. Key market trends, growth factors and opportunities
- 5.3.3.4.2. Market size and forecast, by Product Type
- 5.3.3.5. Italy
- 5.3.3.5.1. Key market trends, growth factors and opportunities
- 5.3.3.5.2. Market size and forecast, by Product Type
- 5.3.3.6. Rest of Europe
- 5.3.3.6.1. Key market trends, growth factors and opportunities
- 5.3.3.6.2. Market size and forecast, by Product Type
- 5.4. Asia-Pacific
- 5.4.1. Key trends and opportunities
- 5.4.2. Market size and forecast, by Product Type
- 5.4.3. Market size and forecast, by country
- 5.4.3.1. China
- 5.4.3.1.1. Key market trends, growth factors and opportunities
- 5.4.3.1.2. Market size and forecast, by Product Type
- 5.4.3.2. Japan
- 5.4.3.2.1. Key market trends, growth factors and opportunities
- 5.4.3.2.2. Market size and forecast, by Product Type
- 5.4.3.3. India
- 5.4.3.3.1. Key market trends, growth factors and opportunities
- 5.4.3.3.2. Market size and forecast, by Product Type
- 5.4.3.4. South Korea
- 5.4.3.4.1. Key market trends, growth factors and opportunities
- 5.4.3.4.2. Market size and forecast, by Product Type
- 5.4.3.5. Australia
- 5.4.3.5.1. Key market trends, growth factors and opportunities
- 5.4.3.5.2. Market size and forecast, by Product Type
- 5.4.3.6. Rest of Asia-Pacific
- 5.4.3.6.1. Key market trends, growth factors and opportunities
- 5.4.3.6.2. Market size and forecast, by Product Type
- 5.5. LAMEA
- 5.5.1. Key trends and opportunities
- 5.5.2. Market size and forecast, by Product Type
- 5.5.3. Market size and forecast, by country
- 5.5.3.1. Brazil
- 5.5.3.1.1. Key market trends, growth factors and opportunities
- 5.5.3.1.2. Market size and forecast, by Product Type
- 5.5.3.2. UAE
- 5.5.3.2.1. Key market trends, growth factors and opportunities
- 5.5.3.2.2. Market size and forecast, by Product Type
- 5.5.3.3. Saudi Arabia
- 5.5.3.3.1. Key market trends, growth factors and opportunities
- 5.5.3.3.2. Market size and forecast, by Product Type
- 5.5.3.4. South Africa
- 5.5.3.4.1. Key market trends, growth factors and opportunities
- 5.5.3.4.2. Market size and forecast, by Product Type
- 5.5.3.5. Rest of LAMEA
- 5.5.3.5.1. Key market trends, growth factors and opportunities
- 5.5.3.5.2. Market size and forecast, by Product Type
CHAPTER 6: COMPETITIVE LANDSCAPE
- 6.1. Introduction
- 6.2. Top winning strategies
- 6.3. Product Mapping of Top 10 Player
- 6.4. Competitive Dashboard
- 6.5. Competitive Heatmap
- 6.6. Top player positioning, 2022
CHAPTER 7: COMPANY PROFILES
- 7.1. Google LLC (Alphabet)
- 7.1.1. Company overview
- 7.1.2. Key Executives
- 7.1.3. Company snapshot
- 7.2. HONEYWELL CORPORATION, INC.
- 7.2.1. Company overview
- 7.2.2. Key Executives
- 7.2.3. Company snapshot
- 7.3. Amazon.com Inc.
- 7.3.1. Company overview
- 7.3.2. Key Executives
- 7.3.3. Company snapshot
- 7.4. Schneider Electric SE.
- 7.4.1. Company overview
- 7.4.2. Key Executives
- 7.4.3. Company snapshot
- 7.5. Johnson Controls International plc
- 7.5.1. Company overview
- 7.5.2. Key Executives
- 7.5.3. Company snapshot
- 7.6. ABB Ltd.
- 7.6.1. Company overview
- 7.6.2. Key Executives
- 7.6.3. Company snapshot
- 7.7. Legrand SA
- 7.7.1. Company overview
- 7.7.2. Key Executives
- 7.7.3. Company snapshot
- 7.8. Panasonic Corporation
- 7.8.1. Company overview
- 7.8.2. Key Executives
- 7.8.3. Company snapshot
- 7.9. Samsung Electronics Co Ltd
- 7.9.1. Company overview
- 7.9.2. Key Executives
- 7.9.3. Company snapshot
- 7.10. General Electric
- 7.10.1. Company overview
- 7.10.2. Key Executives
- 7.10.3. Company snapshot