
|
市場調査レポート
商品コード
1344427
フレキシブル交流送電システム市場:補償タイプ別、コントローラ別、業界別:世界機会分析と産業予測、2023-2032年Flexible AC Transmission System Market By Compensation Type, By Controller, By Industry Vertical : Global Opportunity Analysis and Industry Forecast, 2023-2032 |
||||||
|
|||||||

| フレキシブル交流送電システム市場:補償タイプ別、コントローラ別、業界別:世界機会分析と産業予測、2023-2032年 |
|
出版日: 2023年05月30日
発行: Allied Market Research
ページ情報: 英文 275 Pages
納期: 2~3営業日
|

- 全表示
- 概要
- 図表
- 目次
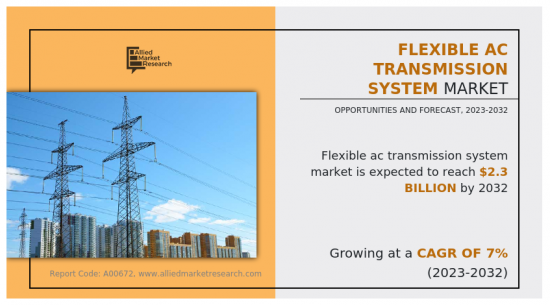
Allied Market Researchが発行した最新レポート「フレキシブル交流送電システム市場」によると、フレキシブル交流送電システム市場は2022年に12億米ドルと評価され、2023年から2032年にかけてCAGR 7%で成長し、2032年には23億米ドルに達すると推定されます。
フレキシブル交流送電システム(FACTS)市場の分析は、送電システムの高度化、電力系統の制御性に対する需要の増加、世界中の不測の事態における高信頼性の必要性により、予測期間中に大きく拡大すると予測されています。また、フレキシブル交流送電システム(FACTS)市場は、スマートグリッドの出現と再生可能エネルギー資源への依存度の増加から、予測期間中に恩恵を受けると予想されます。逆に、設置にかかる初期コストが高いため、予測期間中のフレキシブル交流送電システム(FACTS)市場の成長は制限されると予想されます。
目次
第1章 イントロダクション
第2章 エグゼクティブサマリー
第3章 市場概要
- 市場の定義と範囲
- 主な調査結果
- 影響要因
- 主な投資機会
- ポーターのファイブフォース分析
- 市場力学
- 促進要因
- 送電システムの高度化
- 電力システムの制御性に対する需要の増加
- 不測の事態における高い信頼性の必要性
- 抑制要因
- 設置にかかる初期コストの高さ
- 機会
- スマートグリッドの出現と再生可能エネルギー資源への依存度の増加
- 促進要因
- COVID-19による市場への影響分析
第4章 フレキシブル交流送電システム市場:補償タイプ別
- シリーズ補償
- シャント補償
- シリーズ・シャント複合補償
第5章 フレキシブル交流送電システム市場:コントローラ別
- 静的同期補償装置(STATCOM)
- 静的VAR補償装置(SVC)
- 統合パワーフローコントローラ(UPFC)
- サイリスタ制御直列補償器(TCSC)
- その他
第6章 フレキシブル交流送電システム市場:業界別
- 石油・ガス
- 電力
- 鉄道
- その他
第7章 フレキシブル交流送電システム市場:地域別
- 北米
- 米国
- カナダ
- メキシコ
- 欧州
- 英国
- ドイツ
- フランス
- イタリア
- その他欧州
- アジア太平洋
- 中国
- インド
- 日本
- オーストラリア
- その他アジア太平洋地域
- ラテンアメリカ
- ラテンアメリカ
- 中東
- アフリカ
第8章 競合情勢
- イントロダクション
- 主要成功戦略
- 主要10社の製品マッピング
- 競合ダッシュボード
- 競合ヒートマップ
- 主要企業のポジショニング、2022年
第9章 企業プロファイル
- ABB Ltd.
- Adani Power Ltd
- Alstom SA
- CG Power and Industrial Solutions Limited.
- Eaton Corporation
- General Electric
- Hyosung Corporation.
- Mitsubishi Electric Corporation
- NR Electric Co., Ltd.
- Siemens
LIST OF TABLES
- TABLE 01. GLOBAL FLEXIBLE AC TRANSMISSION SYSTEM MARKET, BY COMPENSATION TYPE, 2022-2032 ($MILLION)
- TABLE 02. FLEXIBLE AC TRANSMISSION SYSTEM MARKET FOR SERIES COMPENSATION, BY REGION, 2022-2032 ($MILLION)
- TABLE 03. FLEXIBLE AC TRANSMISSION SYSTEM MARKET FOR SHUNT COMPENSATION, BY REGION, 2022-2032 ($MILLION)
- TABLE 04. FLEXIBLE AC TRANSMISSION SYSTEM MARKET FOR COMBINED SERIES-SHUNT COMPENSATION , BY REGION, 2022-2032 ($MILLION)
- TABLE 05. GLOBAL FLEXIBLE AC TRANSMISSION SYSTEM MARKET, BY CONTROLLER, 2022-2032 ($MILLION)
- TABLE 06. FLEXIBLE AC TRANSMISSION SYSTEM MARKET FOR STATIC SYNCHRONOUS COMPENSATOR (STATCOM), BY REGION, 2022-2032 ($MILLION)
- TABLE 07. FLEXIBLE AC TRANSMISSION SYSTEM MARKET FOR STATIC VAR COMPENSATOR (SVC), BY REGION, 2022-2032 ($MILLION)
- TABLE 08. FLEXIBLE AC TRANSMISSION SYSTEM MARKET FOR UNIFIED POWER FLOW CONTROLLER (UPFC), BY REGION, 2022-2032 ($MILLION)
- TABLE 09. FLEXIBLE AC TRANSMISSION SYSTEM MARKET FOR THYRISTOR CONTROLLED SERIES COMPENSATOR (TCSC), BY REGION, 2022-2032 ($MILLION)
- TABLE 10. FLEXIBLE AC TRANSMISSION SYSTEM MARKET FOR OTHERS, BY REGION, 2022-2032 ($MILLION)
- TABLE 11. GLOBAL FLEXIBLE AC TRANSMISSION SYSTEM MARKET, BY INDUSTRY VERTICAL, 2022-2032 ($MILLION)
- TABLE 12. FLEXIBLE AC TRANSMISSION SYSTEM MARKET FOR OIL AND GAS, BY REGION, 2022-2032 ($MILLION)
- TABLE 13. FLEXIBLE AC TRANSMISSION SYSTEM MARKET FOR ELECTRIC UTILITY, BY REGION, 2022-2032 ($MILLION)
- TABLE 14. FLEXIBLE AC TRANSMISSION SYSTEM MARKET FOR RAILWAYS, BY REGION, 2022-2032 ($MILLION)
- TABLE 15. FLEXIBLE AC TRANSMISSION SYSTEM MARKET FOR OTHERS, BY REGION, 2022-2032 ($MILLION)
- TABLE 16. FLEXIBLE AC TRANSMISSION SYSTEM MARKET, BY REGION, 2022-2032 ($MILLION)
- TABLE 17. NORTH AMERICA FLEXIBLE AC TRANSMISSION SYSTEM MARKET, BY COMPENSATION TYPE, 2022-2032 ($MILLION)
- TABLE 18. NORTH AMERICA FLEXIBLE AC TRANSMISSION SYSTEM MARKET, BY CONTROLLER, 2022-2032 ($MILLION)
- TABLE 19. NORTH AMERICA FLEXIBLE AC TRANSMISSION SYSTEM MARKET, BY INDUSTRY VERTICAL, 2022-2032 ($MILLION)
- TABLE 20. NORTH AMERICA FLEXIBLE AC TRANSMISSION SYSTEM MARKET, BY COUNTRY, 2022-2032 ($MILLION)
- TABLE 21. U.S. FLEXIBLE AC TRANSMISSION SYSTEM MARKET, BY COMPENSATION TYPE, 2022-2032 ($MILLION)
- TABLE 22. U.S. FLEXIBLE AC TRANSMISSION SYSTEM MARKET, BY CONTROLLER, 2022-2032 ($MILLION)
- TABLE 23. U.S. FLEXIBLE AC TRANSMISSION SYSTEM MARKET, BY INDUSTRY VERTICAL, 2022-2032 ($MILLION)
- TABLE 24. CANADA FLEXIBLE AC TRANSMISSION SYSTEM MARKET, BY COMPENSATION TYPE, 2022-2032 ($MILLION)
- TABLE 25. CANADA FLEXIBLE AC TRANSMISSION SYSTEM MARKET, BY CONTROLLER, 2022-2032 ($MILLION)
- TABLE 26. CANADA FLEXIBLE AC TRANSMISSION SYSTEM MARKET, BY INDUSTRY VERTICAL, 2022-2032 ($MILLION)
- TABLE 27. MEXICO FLEXIBLE AC TRANSMISSION SYSTEM MARKET, BY COMPENSATION TYPE, 2022-2032 ($MILLION)
- TABLE 28. MEXICO FLEXIBLE AC TRANSMISSION SYSTEM MARKET, BY CONTROLLER, 2022-2032 ($MILLION)
- TABLE 29. MEXICO FLEXIBLE AC TRANSMISSION SYSTEM MARKET, BY INDUSTRY VERTICAL, 2022-2032 ($MILLION)
- TABLE 30. EUROPE FLEXIBLE AC TRANSMISSION SYSTEM MARKET, BY COMPENSATION TYPE, 2022-2032 ($MILLION)
- TABLE 31. EUROPE FLEXIBLE AC TRANSMISSION SYSTEM MARKET, BY CONTROLLER, 2022-2032 ($MILLION)
- TABLE 32. EUROPE FLEXIBLE AC TRANSMISSION SYSTEM MARKET, BY INDUSTRY VERTICAL, 2022-2032 ($MILLION)
- TABLE 33. EUROPE FLEXIBLE AC TRANSMISSION SYSTEM MARKET, BY COUNTRY, 2022-2032 ($MILLION)
- TABLE 34. UK FLEXIBLE AC TRANSMISSION SYSTEM MARKET, BY COMPENSATION TYPE, 2022-2032 ($MILLION)
- TABLE 35. UK FLEXIBLE AC TRANSMISSION SYSTEM MARKET, BY CONTROLLER, 2022-2032 ($MILLION)
- TABLE 36. UK FLEXIBLE AC TRANSMISSION SYSTEM MARKET, BY INDUSTRY VERTICAL, 2022-2032 ($MILLION)
- TABLE 37. GERMANY FLEXIBLE AC TRANSMISSION SYSTEM MARKET, BY COMPENSATION TYPE, 2022-2032 ($MILLION)
- TABLE 38. GERMANY FLEXIBLE AC TRANSMISSION SYSTEM MARKET, BY CONTROLLER, 2022-2032 ($MILLION)
- TABLE 39. GERMANY FLEXIBLE AC TRANSMISSION SYSTEM MARKET, BY INDUSTRY VERTICAL, 2022-2032 ($MILLION)
- TABLE 40. FRANCE FLEXIBLE AC TRANSMISSION SYSTEM MARKET, BY COMPENSATION TYPE, 2022-2032 ($MILLION)
- TABLE 41. FRANCE FLEXIBLE AC TRANSMISSION SYSTEM MARKET, BY CONTROLLER, 2022-2032 ($MILLION)
- TABLE 42. FRANCE FLEXIBLE AC TRANSMISSION SYSTEM MARKET, BY INDUSTRY VERTICAL, 2022-2032 ($MILLION)
- TABLE 43. ITALY FLEXIBLE AC TRANSMISSION SYSTEM MARKET, BY COMPENSATION TYPE, 2022-2032 ($MILLION)
- TABLE 44. ITALY FLEXIBLE AC TRANSMISSION SYSTEM MARKET, BY CONTROLLER, 2022-2032 ($MILLION)
- TABLE 45. ITALY FLEXIBLE AC TRANSMISSION SYSTEM MARKET, BY INDUSTRY VERTICAL, 2022-2032 ($MILLION)
- TABLE 46. REST OF EUROPE FLEXIBLE AC TRANSMISSION SYSTEM MARKET, BY COMPENSATION TYPE, 2022-2032 ($MILLION)
- TABLE 47. REST OF EUROPE FLEXIBLE AC TRANSMISSION SYSTEM MARKET, BY CONTROLLER, 2022-2032 ($MILLION)
- TABLE 48. REST OF EUROPE FLEXIBLE AC TRANSMISSION SYSTEM MARKET, BY INDUSTRY VERTICAL, 2022-2032 ($MILLION)
- TABLE 49. ASIA-PACIFIC FLEXIBLE AC TRANSMISSION SYSTEM MARKET, BY COMPENSATION TYPE, 2022-2032 ($MILLION)
- TABLE 50. ASIA-PACIFIC FLEXIBLE AC TRANSMISSION SYSTEM MARKET, BY CONTROLLER, 2022-2032 ($MILLION)
- TABLE 51. ASIA-PACIFIC FLEXIBLE AC TRANSMISSION SYSTEM MARKET, BY INDUSTRY VERTICAL, 2022-2032 ($MILLION)
- TABLE 52. ASIA-PACIFIC FLEXIBLE AC TRANSMISSION SYSTEM MARKET, BY COUNTRY, 2022-2032 ($MILLION)
- TABLE 53. CHINA FLEXIBLE AC TRANSMISSION SYSTEM MARKET, BY COMPENSATION TYPE, 2022-2032 ($MILLION)
- TABLE 54. CHINA FLEXIBLE AC TRANSMISSION SYSTEM MARKET, BY CONTROLLER, 2022-2032 ($MILLION)
- TABLE 55. CHINA FLEXIBLE AC TRANSMISSION SYSTEM MARKET, BY INDUSTRY VERTICAL, 2022-2032 ($MILLION)
- TABLE 56. INDIA FLEXIBLE AC TRANSMISSION SYSTEM MARKET, BY COMPENSATION TYPE, 2022-2032 ($MILLION)
- TABLE 57. INDIA FLEXIBLE AC TRANSMISSION SYSTEM MARKET, BY CONTROLLER, 2022-2032 ($MILLION)
- TABLE 58. INDIA FLEXIBLE AC TRANSMISSION SYSTEM MARKET, BY INDUSTRY VERTICAL, 2022-2032 ($MILLION)
- TABLE 59. JAPAN FLEXIBLE AC TRANSMISSION SYSTEM MARKET, BY COMPENSATION TYPE, 2022-2032 ($MILLION)
- TABLE 60. JAPAN FLEXIBLE AC TRANSMISSION SYSTEM MARKET, BY CONTROLLER, 2022-2032 ($MILLION)
- TABLE 61. JAPAN FLEXIBLE AC TRANSMISSION SYSTEM MARKET, BY INDUSTRY VERTICAL, 2022-2032 ($MILLION)
- TABLE 62. AUSTRALIA FLEXIBLE AC TRANSMISSION SYSTEM MARKET, BY COMPENSATION TYPE, 2022-2032 ($MILLION)
- TABLE 63. AUSTRALIA FLEXIBLE AC TRANSMISSION SYSTEM MARKET, BY CONTROLLER, 2022-2032 ($MILLION)
- TABLE 64. AUSTRALIA FLEXIBLE AC TRANSMISSION SYSTEM MARKET, BY INDUSTRY VERTICAL, 2022-2032 ($MILLION)
- TABLE 65. REST OF ASIA-PACIFIC FLEXIBLE AC TRANSMISSION SYSTEM MARKET, BY COMPENSATION TYPE, 2022-2032 ($MILLION)
- TABLE 66. REST OF ASIA-PACIFIC FLEXIBLE AC TRANSMISSION SYSTEM MARKET, BY CONTROLLER, 2022-2032 ($MILLION)
- TABLE 67. REST OF ASIA-PACIFIC FLEXIBLE AC TRANSMISSION SYSTEM MARKET, BY INDUSTRY VERTICAL, 2022-2032 ($MILLION)
- TABLE 68. LAMEA FLEXIBLE AC TRANSMISSION SYSTEM MARKET, BY COMPENSATION TYPE, 2022-2032 ($MILLION)
- TABLE 69. LAMEA FLEXIBLE AC TRANSMISSION SYSTEM MARKET, BY CONTROLLER, 2022-2032 ($MILLION)
- TABLE 70. LAMEA FLEXIBLE AC TRANSMISSION SYSTEM MARKET, BY INDUSTRY VERTICAL, 2022-2032 ($MILLION)
- TABLE 71. LAMEA FLEXIBLE AC TRANSMISSION SYSTEM MARKET, BY COUNTRY, 2022-2032 ($MILLION)
- TABLE 72. LATIN AMERICA FLEXIBLE AC TRANSMISSION SYSTEM MARKET, BY COMPENSATION TYPE, 2022-2032 ($MILLION)
- TABLE 73. LATIN AMERICA FLEXIBLE AC TRANSMISSION SYSTEM MARKET, BY CONTROLLER, 2022-2032 ($MILLION)
- TABLE 74. LATIN AMERICA FLEXIBLE AC TRANSMISSION SYSTEM MARKET, BY INDUSTRY VERTICAL, 2022-2032 ($MILLION)
- TABLE 75. MIDDLE EAST FLEXIBLE AC TRANSMISSION SYSTEM MARKET, BY COMPENSATION TYPE, 2022-2032 ($MILLION)
- TABLE 76. MIDDLE EAST FLEXIBLE AC TRANSMISSION SYSTEM MARKET, BY CONTROLLER, 2022-2032 ($MILLION)
- TABLE 77. MIDDLE EAST FLEXIBLE AC TRANSMISSION SYSTEM MARKET, BY INDUSTRY VERTICAL, 2022-2032 ($MILLION)
- TABLE 78. AFRICA FLEXIBLE AC TRANSMISSION SYSTEM MARKET, BY COMPENSATION TYPE, 2022-2032 ($MILLION)
- TABLE 79. AFRICA FLEXIBLE AC TRANSMISSION SYSTEM MARKET, BY CONTROLLER, 2022-2032 ($MILLION)
- TABLE 80. AFRICA FLEXIBLE AC TRANSMISSION SYSTEM MARKET, BY INDUSTRY VERTICAL, 2022-2032 ($MILLION)
- TABLE 81. ABB LTD.: KEY EXECUTIVES
- TABLE 82. ABB LTD.: COMPANY SNAPSHOT
- TABLE 83. ABB LTD.: SERVICE SEGMENTS
- TABLE 84. ABB LTD.: PRODUCT PORTFOLIO
- TABLE 85. ADANI POWER LTD: KEY EXECUTIVES
- TABLE 86. ADANI POWER LTD: COMPANY SNAPSHOT
- TABLE 87. ADANI POWER LTD: SERVICE SEGMENTS
- TABLE 88. ADANI POWER LTD: PRODUCT PORTFOLIO
- TABLE 89. ADANI POWER LTD: KEY STRATERGIES
- TABLE 90. ALSTOM SA: KEY EXECUTIVES
- TABLE 91. ALSTOM SA: COMPANY SNAPSHOT
- TABLE 92. ALSTOM SA: PRODUCT SEGMENTS
- TABLE 93. ALSTOM SA: PRODUCT PORTFOLIO
- TABLE 94. CG POWER AND INDUSTRIAL SOLUTIONS LIMITED.: KEY EXECUTIVES
- TABLE 95. CG POWER AND INDUSTRIAL SOLUTIONS LIMITED.: COMPANY SNAPSHOT
- TABLE 96. CG POWER AND INDUSTRIAL SOLUTIONS LIMITED.: SERVICE SEGMENTS
- TABLE 97. CG POWER AND INDUSTRIAL SOLUTIONS LIMITED.: PRODUCT PORTFOLIO
- TABLE 98. EATON CORPORATION: KEY EXECUTIVES
- TABLE 99. EATON CORPORATION: COMPANY SNAPSHOT
- TABLE 100. EATON CORPORATION: PRODUCT SEGMENTS
- TABLE 101. EATON CORPORATION: PRODUCT PORTFOLIO
- TABLE 102. GENERAL ELECTRIC: KEY EXECUTIVES
- TABLE 103. GENERAL ELECTRIC: COMPANY SNAPSHOT
- TABLE 104. GENERAL ELECTRIC: SERVICE SEGMENTS
- TABLE 105. GENERAL ELECTRIC: PRODUCT PORTFOLIO
- TABLE 106. GENERAL ELECTRIC: KEY STRATERGIES
- TABLE 107. HYOSUNG CORPORATION.: KEY EXECUTIVES
- TABLE 108. HYOSUNG CORPORATION.: COMPANY SNAPSHOT
- TABLE 109. HYOSUNG CORPORATION.: PRODUCT SEGMENTS
- TABLE 110. HYOSUNG CORPORATION.: PRODUCT PORTFOLIO
- TABLE 111. MITSUBISHI ELECTRIC CORPORATION: KEY EXECUTIVES
- TABLE 112. MITSUBISHI ELECTRIC CORPORATION: COMPANY SNAPSHOT
- TABLE 113. MITSUBISHI ELECTRIC CORPORATION: PRODUCT SEGMENTS
- TABLE 114. MITSUBISHI ELECTRIC CORPORATION: PRODUCT PORTFOLIO
- TABLE 115. MITSUBISHI ELECTRIC CORPORATION: KEY STRATERGIES
- TABLE 116. NR ELECTRIC CO., LTD.: KEY EXECUTIVES
- TABLE 117. NR ELECTRIC CO., LTD.: COMPANY SNAPSHOT
- TABLE 118. NR ELECTRIC CO., LTD.: PRODUCT SEGMENTS
- TABLE 119. NR ELECTRIC CO., LTD.: PRODUCT PORTFOLIO
- TABLE 120. SIEMENS: KEY EXECUTIVES
- TABLE 121. SIEMENS: COMPANY SNAPSHOT
- TABLE 122. SIEMENS: PRODUCT SEGMENTS
- TABLE 123. SIEMENS: PRODUCT PORTFOLIO
LIST OF FIGURES
- FIGURE 01. FLEXIBLE AC TRANSMISSION SYSTEM MARKET, 2022-2032
- FIGURE 02. SEGMENTATION OF FLEXIBLE AC TRANSMISSION SYSTEM MARKET, 2022-2032
- FIGURE 03. TOP INVESTMENT POCKETS IN FLEXIBLE AC TRANSMISSION SYSTEM MARKET (2023-2032)
- FIGURE 04. HIGH BARGAINING POWER OF SUPPLIERS
- FIGURE 05. LOW BARGAINING POWER OF BUYERS
- FIGURE 06. LOW THREAT OF SUBSTITUTES
- FIGURE 07. LOW THREAT OF NEW ENTRANTS
- FIGURE 08. LOW INTENSITY OF RIVALRY
- FIGURE 09. DRIVERS, RESTRAINTS AND OPPORTUNITIES: GLOBALFLEXIBLE AC TRANSMISSION SYSTEM MARKET
- FIGURE 10. FLEXIBLE AC TRANSMISSION SYSTEM MARKET, BY COMPENSATION TYPE, 2022(%)
- FIGURE 11. COMPARATIVE SHARE ANALYSIS OF FLEXIBLE AC TRANSMISSION SYSTEM MARKET FOR SERIES COMPENSATION, BY COUNTRY 2022 AND 2032(%)
- FIGURE 12. COMPARATIVE SHARE ANALYSIS OF FLEXIBLE AC TRANSMISSION SYSTEM MARKET FOR SHUNT COMPENSATION, BY COUNTRY 2022 AND 2032(%)
- FIGURE 13. COMPARATIVE SHARE ANALYSIS OF FLEXIBLE AC TRANSMISSION SYSTEM MARKET FOR COMBINED SERIES-SHUNT COMPENSATION , BY COUNTRY 2022 AND 2032(%)
- FIGURE 14. FLEXIBLE AC TRANSMISSION SYSTEM MARKET, BY CONTROLLER, 2022(%)
- FIGURE 15. COMPARATIVE SHARE ANALYSIS OF FLEXIBLE AC TRANSMISSION SYSTEM MARKET FOR STATIC SYNCHRONOUS COMPENSATOR (STATCOM), BY COUNTRY 2022 AND 2032(%)
- FIGURE 16. COMPARATIVE SHARE ANALYSIS OF FLEXIBLE AC TRANSMISSION SYSTEM MARKET FOR STATIC VAR COMPENSATOR (SVC), BY COUNTRY 2022 AND 2032(%)
- FIGURE 17. COMPARATIVE SHARE ANALYSIS OF FLEXIBLE AC TRANSMISSION SYSTEM MARKET FOR UNIFIED POWER FLOW CONTROLLER (UPFC), BY COUNTRY 2022 AND 2032(%)
- FIGURE 18. COMPARATIVE SHARE ANALYSIS OF FLEXIBLE AC TRANSMISSION SYSTEM MARKET FOR THYRISTOR CONTROLLED SERIES COMPENSATOR (TCSC), BY COUNTRY 2022 AND 2032(%)
- FIGURE 19. COMPARATIVE SHARE ANALYSIS OF FLEXIBLE AC TRANSMISSION SYSTEM MARKET FOR OTHERS, BY COUNTRY 2022 AND 2032(%)
- FIGURE 20. FLEXIBLE AC TRANSMISSION SYSTEM MARKET, BY INDUSTRY VERTICAL, 2022(%)
- FIGURE 21. COMPARATIVE SHARE ANALYSIS OF FLEXIBLE AC TRANSMISSION SYSTEM MARKET FOR OIL AND GAS, BY COUNTRY 2022 AND 2032(%)
- FIGURE 22. COMPARATIVE SHARE ANALYSIS OF FLEXIBLE AC TRANSMISSION SYSTEM MARKET FOR ELECTRIC UTILITY, BY COUNTRY 2022 AND 2032(%)
- FIGURE 23. COMPARATIVE SHARE ANALYSIS OF FLEXIBLE AC TRANSMISSION SYSTEM MARKET FOR RAILWAYS, BY COUNTRY 2022 AND 2032(%)
- FIGURE 24. COMPARATIVE SHARE ANALYSIS OF FLEXIBLE AC TRANSMISSION SYSTEM MARKET FOR OTHERS, BY COUNTRY 2022 AND 2032(%)
- FIGURE 25. FLEXIBLE AC TRANSMISSION SYSTEM MARKET BY REGION, 2022
- FIGURE 26. U.S. FLEXIBLE AC TRANSMISSION SYSTEM MARKET, 2022-2032 ($MILLION)
- FIGURE 27. CANADA FLEXIBLE AC TRANSMISSION SYSTEM MARKET, 2022-2032 ($MILLION)
- FIGURE 28. MEXICO FLEXIBLE AC TRANSMISSION SYSTEM MARKET, 2022-2032 ($MILLION)
- FIGURE 29. UK FLEXIBLE AC TRANSMISSION SYSTEM MARKET, 2022-2032 ($MILLION)
- FIGURE 30. GERMANY FLEXIBLE AC TRANSMISSION SYSTEM MARKET, 2022-2032 ($MILLION)
- FIGURE 31. FRANCE FLEXIBLE AC TRANSMISSION SYSTEM MARKET, 2022-2032 ($MILLION)
- FIGURE 32. ITALY FLEXIBLE AC TRANSMISSION SYSTEM MARKET, 2022-2032 ($MILLION)
- FIGURE 33. REST OF EUROPE FLEXIBLE AC TRANSMISSION SYSTEM MARKET, 2022-2032 ($MILLION)
- FIGURE 34. CHINA FLEXIBLE AC TRANSMISSION SYSTEM MARKET, 2022-2032 ($MILLION)
- FIGURE 35. INDIA FLEXIBLE AC TRANSMISSION SYSTEM MARKET, 2022-2032 ($MILLION)
- FIGURE 36. JAPAN FLEXIBLE AC TRANSMISSION SYSTEM MARKET, 2022-2032 ($MILLION)
- FIGURE 37. AUSTRALIA FLEXIBLE AC TRANSMISSION SYSTEM MARKET, 2022-2032 ($MILLION)
- FIGURE 38. REST OF ASIA-PACIFIC FLEXIBLE AC TRANSMISSION SYSTEM MARKET, 2022-2032 ($MILLION)
- FIGURE 39. LATIN AMERICA FLEXIBLE AC TRANSMISSION SYSTEM MARKET, 2022-2032 ($MILLION)
- FIGURE 40. MIDDLE EAST FLEXIBLE AC TRANSMISSION SYSTEM MARKET, 2022-2032 ($MILLION)
- FIGURE 41. AFRICA FLEXIBLE AC TRANSMISSION SYSTEM MARKET, 2022-2032 ($MILLION)
- FIGURE 42. TOP WINNING STRATEGIES, BY YEAR
- FIGURE 43. TOP WINNING STRATEGIES, BY DEVELOPMENT
- FIGURE 44. TOP WINNING STRATEGIES, BY COMPANY
- FIGURE 45. PRODUCT MAPPING OF TOP 10 PLAYERS
- FIGURE 46. COMPETITIVE DASHBOARD
- FIGURE 47. COMPETITIVE HEATMAP: FLEXIBLE AC TRANSMISSION SYSTEM MARKET
- FIGURE 48. TOP PLAYER POSITIONING, 2022
- FIGURE 49. ABB LTD.: NET SALES, 2020-2022 ($MILLION)
- FIGURE 50. ABB LTD.: REVENUE SHARE BY SEGMENT, 2021 (%)
- FIGURE 51. ABB LTD.: REVENUE SHARE BY REGION, 2022 (%)
- FIGURE 52. ADANI POWER LTD: NET REVENUE, 2019-2021 ($MILLION)
- FIGURE 53. ADANI POWER LTD: REVENUE SHARE BY SEGMENT, 2021 (%)
- FIGURE 54. ALSTOM SA: NET SALES, 2020-2022 ($MILLION)
- FIGURE 55. ALSTOM SA: REVENUE SHARE BY SEGMENT, 2022 (%)
- FIGURE 56. ALSTOM SA: REVENUE SHARE BY REGION, 2022 (%)
- FIGURE 57. CG POWER AND INDUSTRIAL SOLUTIONS LIMITED.: NET SALES, 2020-2021 ($MILLION)
- FIGURE 58. CG POWER AND INDUSTRIAL SOLUTIONS LIMITED.: REVENUE SHARE BY SEGMENT, 2022 (%)
- FIGURE 59. CG POWER AND INDUSTRIAL SOLUTIONS LIMITED.: REVENUE SHARE BY REGION, 2021 (%)
- FIGURE 60. EATON CORPORATION: NET SALES, 2020-2022 ($MILLION)
- FIGURE 61. EATON CORPORATION: RESEARCH & DEVELOPMENT EXPENDITURE, 2020-2022 ($MILLION)
- FIGURE 62. EATON CORPORATION: REVENUE SHARE BY REGION, 2021 (%)
- FIGURE 63. EATON CORPORATION: REVENUE SHARE BY SEGMENT, 2021 (%)
- FIGURE 64. GENERAL ELECTRIC: NET REVENUE, 2020-2022 ($MILLION)
- FIGURE 65. GENERAL ELECTRIC: RESEARCH & DEVELOPMENT EXPENDITURE, 2020-2022 ($MILLION)
- FIGURE 66. GENERAL ELECTRIC: REVENUE SHARE BY SEGMENT, 2022 (%)
- FIGURE 67. GENERAL ELECTRIC: REVENUE SHARE BY REGION, 2022 (%)
- FIGURE 68. HYOSUNG CORPORATION.: RESEARCH & DEVELOPMENT EXPENDITURE, 2020-2022 ($MILLION)
- FIGURE 69. HYOSUNG CORPORATION.: NET SALES, 2020-2022 ($MILLION)
- FIGURE 70. MITSUBISHI ELECTRIC CORPORATION: NET REVENUE, 2020-2022 ($MILLION)
- FIGURE 71. MITSUBISHI ELECTRIC CORPORATION: RESEARCH & DEVELOPMENT EXPENDITURE, 2020-2022 ($MILLION)
- FIGURE 72. MITSUBISHI ELECTRIC CORPORATION: REVENUE SHARE BY SEGMENT, 2022 (%)
- FIGURE 73. MITSUBISHI ELECTRIC CORPORATION: REVENUE SHARE BY REGION, 2022 (%)
- FIGURE 74. SIEMENS: NET REVENUE, 2020-2022 ($MILLION)
- FIGURE 75. SIEMENS: REVENUE SHARE BY REGION, 2022 (%)
- FIGURE 76. SIEMENS: REVENUE SHARE BY SEGMENT, 2022 (%)
According to a new report published by Allied Market Research, titled, "Flexible AC Transmission System Market," The flexible ac transmission system market was valued at $1.2 billion in 2022, and is estimated to reach $2.3 billion by 2032, growing at a CAGR of 7% from 2023 to 2032.
The flexible AC transmission systems (FACTS) market analysis is anticipated to expand significantly during the forecast period owing to the advancement of electric power transmission system, increase in demand for controllability of power systems, and need of high reliability under contingencies across the globe. In addition, the flexible AC transmission systems (FACTS) market is anticipated to benefit from the emergence of smart grids and an increase in dependency on renewable energy resources during the forecast period. On the contrary, high initial cost of installation is anticipated to limit the growth of the flexible AC transmission systems (FACTS) market during the forecast period.
The flexible AC transmission systems (FACTS) market is segmented on the basis of compensation type, controller, industry vertical and region. On the basis of compensation type, the market is divided into series compensation, shunt compensation, and combined series-shunt compensation. On the basis of controller, the market is segregated into static synchronous compensator (STATCOM), static VAR compensator (SVC) , unified power flow controller (UPFC), thyristor controlled series compensator (TCSC), and Others. On the basis of industry vertical, the market is bifurcated into Oil and Gas , Electric Utility , Railways , and others. Region-wise, the flexible AC transmission systems (FACTS) market trends are analyzed across North America (the U.S., Canada, and Mexico), Europe (UK, Germany, France, Italy, and Rest of Europe), Asia-Pacific (China, India, Japan, Australia , and Rest of Asia-Pacific), and LAMEA (Latin America, Middle East, and Africa).
The key players profiled in the report include: ABB Ltd, Adani Power Ltd, ALSTOM SA, CG Power and Industrial Solutions Limited, Eaton Corporation, General Electric, Hyosung Corporation, Mitsubishi Electric Corporation, NR Electric Co. Ltd, and Siemens AG. Market players have adopted various strategies such as product launch, product development, and acquisition to expand their foothold in the flexible AC transmission systems (FACTS) market.
Key Benefits For Stakeholders
- This report provides a quantitative analysis of the market segments, current trends, estimations, and dynamics of the flexible ac transmission system market analysis from 2022 to 2032 to identify the prevailing flexible ac transmission system market opportunities.
- The market research is offered along with information related to key drivers, restraints, and opportunities.
- Porter's five forces analysis highlights the potency of buyers and suppliers to enable stakeholders make profit-oriented business decisions and strengthen their supplier-buyer network.
- In-depth analysis of the flexible ac transmission system market segmentation assists to determine the prevailing market opportunities.
- Major countries in each region are mapped according to their revenue contribution to the global market.
- Market player positioning facilitates benchmarking and provides a clear understanding of the present position of the market players.
- The report includes the analysis of the regional as well as global flexible ac transmission system market trends, key players, market segments, application areas, and market growth strategies.
Key Market Segments
By Compensation Type
- Series compensation
- Shunt compensation
- Combined series-shunt compensation
By Controller
- Static Synchronous Compensator (STATCOM)
- Static VAR Compensator (SVC)
- Unified Power Flow Controller (UPFC)
- Thyristor Controlled Series Compensator (TCSC)
- Others
By Industry Vertical
- Oil and Gas
- Electric Utility
- Railways
- Others
By Region
- North America
- U.S.
- Canada
- Mexico
- Europe
- UK
- Germany
- France
- Italy
- Rest of Europe
- Asia-Pacific
- China
- India
- Japan
- Australia
- Rest of Asia-Pacific
- LAMEA
- Latin America
- Middle East
- Africa
Key Market Players:
- Alstom SA
- Hyosung Corporation.
- NR Electric Co., Ltd.
- Siemens
- Adani Power Ltd
- Eaton Corporation
- Mitsubishi Electric Corporation
- General Electric
- ABB Ltd.
- CG Power and Industrial Solutions Limited.
TABLE OF CONTENTS
CHAPTER 1: INTRODUCTION
- 1.1. Report description
- 1.2. Key market segments
- 1.3. Key benefits to the stakeholders
- 1.4. Research Methodology
- 1.4.1. Primary research
- 1.4.2. Secondary research
- 1.4.3. Analyst tools and models
CHAPTER 2: EXECUTIVE SUMMARY
- 2.1. CXO Perspective
CHAPTER 3: MARKET OVERVIEW
- 3.1. Market definition and scope
- 3.2. Key findings
- 3.2.1. Top impacting factors
- 3.2.2. Top investment pockets
- 3.3. Porter's five forces analysis
- 3.3.1. Bargaining power of suppliers
- 3.3.2. Bargaining power of buyers
- 3.3.3. Threat of substitutes
- 3.3.4. Threat of new entrants
- 3.3.5. Intensity of rivalry
- 3.4. Market dynamics
- 3.4.1. Drivers
- 3.4.1.1. Advancement of electric power transmission system
- 3.4.1.2. Increase in demand for controllability of power systems
- 3.4.1.3. Need of high reliability under contingencies
- 3.4.1. Drivers
- 3.4.2. Restraints
- 3.4.2.1. High initial cost of installation
- 3.4.3. Opportunities
- 3.4.3.1. Emergence of smart grids & increase in dependency on renewable energy resources
- 3.5. COVID-19 Impact Analysis on the market
CHAPTER 4: FLEXIBLE AC TRANSMISSION SYSTEM MARKET, BY COMPENSATION TYPE
- 4.1. Overview
- 4.1.1. Market size and forecast
- 4.2. Series compensation
- 4.2.1. Key market trends, growth factors and opportunities
- 4.2.2. Market size and forecast, by region
- 4.2.3. Market share analysis by country
- 4.3. Shunt compensation
- 4.3.1. Key market trends, growth factors and opportunities
- 4.3.2. Market size and forecast, by region
- 4.3.3. Market share analysis by country
- 4.4. Combined series-shunt compensation
- 4.4.1. Key market trends, growth factors and opportunities
- 4.4.2. Market size and forecast, by region
- 4.4.3. Market share analysis by country
CHAPTER 5: FLEXIBLE AC TRANSMISSION SYSTEM MARKET, BY CONTROLLER
- 5.1. Overview
- 5.1.1. Market size and forecast
- 5.2. Static Synchronous Compensator (STATCOM)
- 5.2.1. Key market trends, growth factors and opportunities
- 5.2.2. Market size and forecast, by region
- 5.2.3. Market share analysis by country
- 5.3. Static VAR Compensator (SVC)
- 5.3.1. Key market trends, growth factors and opportunities
- 5.3.2. Market size and forecast, by region
- 5.3.3. Market share analysis by country
- 5.4. Unified Power Flow Controller (UPFC)
- 5.4.1. Key market trends, growth factors and opportunities
- 5.4.2. Market size and forecast, by region
- 5.4.3. Market share analysis by country
- 5.5. Thyristor Controlled Series Compensator (TCSC)
- 5.5.1. Key market trends, growth factors and opportunities
- 5.5.2. Market size and forecast, by region
- 5.5.3. Market share analysis by country
- 5.6. Others
- 5.6.1. Key market trends, growth factors and opportunities
- 5.6.2. Market size and forecast, by region
- 5.6.3. Market share analysis by country
CHAPTER 6: FLEXIBLE AC TRANSMISSION SYSTEM MARKET, BY INDUSTRY VERTICAL
- 6.1. Overview
- 6.1.1. Market size and forecast
- 6.2. Oil and Gas
- 6.2.1. Key market trends, growth factors and opportunities
- 6.2.2. Market size and forecast, by region
- 6.2.3. Market share analysis by country
- 6.3. Electric Utility
- 6.3.1. Key market trends, growth factors and opportunities
- 6.3.2. Market size and forecast, by region
- 6.3.3. Market share analysis by country
- 6.4. Railways
- 6.4.1. Key market trends, growth factors and opportunities
- 6.4.2. Market size and forecast, by region
- 6.4.3. Market share analysis by country
- 6.5. Others
- 6.5.1. Key market trends, growth factors and opportunities
- 6.5.2. Market size and forecast, by region
- 6.5.3. Market share analysis by country
CHAPTER 7: FLEXIBLE AC TRANSMISSION SYSTEM MARKET, BY REGION
- 7.1. Overview
- 7.1.1. Market size and forecast By Region
- 7.2. North America
- 7.2.1. Key trends and opportunities
- 7.2.2. Market size and forecast, by Compensation Type
- 7.2.3. Market size and forecast, by Controller
- 7.2.4. Market size and forecast, by Industry Vertical
- 7.2.5. Market size and forecast, by country
- 7.2.5.1. U.S.
- 7.2.5.1.1. Key market trends, growth factors and opportunities
- 7.2.5.1.2. Market size and forecast, by Compensation Type
- 7.2.5.1.3. Market size and forecast, by Controller
- 7.2.5.1.4. Market size and forecast, by Industry Vertical
- 7.2.5.2. Canada
- 7.2.5.2.1. Key market trends, growth factors and opportunities
- 7.2.5.2.2. Market size and forecast, by Compensation Type
- 7.2.5.2.3. Market size and forecast, by Controller
- 7.2.5.2.4. Market size and forecast, by Industry Vertical
- 7.2.5.3. Mexico
- 7.2.5.3.1. Key market trends, growth factors and opportunities
- 7.2.5.3.2. Market size and forecast, by Compensation Type
- 7.2.5.3.3. Market size and forecast, by Controller
- 7.2.5.3.4. Market size and forecast, by Industry Vertical
- 7.3. Europe
- 7.3.1. Key trends and opportunities
- 7.3.2. Market size and forecast, by Compensation Type
- 7.3.3. Market size and forecast, by Controller
- 7.3.4. Market size and forecast, by Industry Vertical
- 7.3.5. Market size and forecast, by country
- 7.3.5.1. UK
- 7.3.5.1.1. Key market trends, growth factors and opportunities
- 7.3.5.1.2. Market size and forecast, by Compensation Type
- 7.3.5.1.3. Market size and forecast, by Controller
- 7.3.5.1.4. Market size and forecast, by Industry Vertical
- 7.3.5.2. Germany
- 7.3.5.2.1. Key market trends, growth factors and opportunities
- 7.3.5.2.2. Market size and forecast, by Compensation Type
- 7.3.5.2.3. Market size and forecast, by Controller
- 7.3.5.2.4. Market size and forecast, by Industry Vertical
- 7.3.5.3. France
- 7.3.5.3.1. Key market trends, growth factors and opportunities
- 7.3.5.3.2. Market size and forecast, by Compensation Type
- 7.3.5.3.3. Market size and forecast, by Controller
- 7.3.5.3.4. Market size and forecast, by Industry Vertical
- 7.3.5.4. Italy
- 7.3.5.4.1. Key market trends, growth factors and opportunities
- 7.3.5.4.2. Market size and forecast, by Compensation Type
- 7.3.5.4.3. Market size and forecast, by Controller
- 7.3.5.4.4. Market size and forecast, by Industry Vertical
- 7.3.5.5. Rest of Europe
- 7.3.5.5.1. Key market trends, growth factors and opportunities
- 7.3.5.5.2. Market size and forecast, by Compensation Type
- 7.3.5.5.3. Market size and forecast, by Controller
- 7.3.5.5.4. Market size and forecast, by Industry Vertical
- 7.4. Asia-Pacific
- 7.4.1. Key trends and opportunities
- 7.4.2. Market size and forecast, by Compensation Type
- 7.4.3. Market size and forecast, by Controller
- 7.4.4. Market size and forecast, by Industry Vertical
- 7.4.5. Market size and forecast, by country
- 7.4.5.1. China
- 7.4.5.1.1. Key market trends, growth factors and opportunities
- 7.4.5.1.2. Market size and forecast, by Compensation Type
- 7.4.5.1.3. Market size and forecast, by Controller
- 7.4.5.1.4. Market size and forecast, by Industry Vertical
- 7.4.5.2. India
- 7.4.5.2.1. Key market trends, growth factors and opportunities
- 7.4.5.2.2. Market size and forecast, by Compensation Type
- 7.4.5.2.3. Market size and forecast, by Controller
- 7.4.5.2.4. Market size and forecast, by Industry Vertical
- 7.4.5.3. Japan
- 7.4.5.3.1. Key market trends, growth factors and opportunities
- 7.4.5.3.2. Market size and forecast, by Compensation Type
- 7.4.5.3.3. Market size and forecast, by Controller
- 7.4.5.3.4. Market size and forecast, by Industry Vertical
- 7.4.5.4. Australia
- 7.4.5.4.1. Key market trends, growth factors and opportunities
- 7.4.5.4.2. Market size and forecast, by Compensation Type
- 7.4.5.4.3. Market size and forecast, by Controller
- 7.4.5.4.4. Market size and forecast, by Industry Vertical
- 7.4.5.5. Rest of Asia-Pacific
- 7.4.5.5.1. Key market trends, growth factors and opportunities
- 7.4.5.5.2. Market size and forecast, by Compensation Type
- 7.4.5.5.3. Market size and forecast, by Controller
- 7.4.5.5.4. Market size and forecast, by Industry Vertical
- 7.5. LAMEA
- 7.5.1. Key trends and opportunities
- 7.5.2. Market size and forecast, by Compensation Type
- 7.5.3. Market size and forecast, by Controller
- 7.5.4. Market size and forecast, by Industry Vertical
- 7.5.5. Market size and forecast, by country
- 7.5.5.1. Latin America
- 7.5.5.1.1. Key market trends, growth factors and opportunities
- 7.5.5.1.2. Market size and forecast, by Compensation Type
- 7.5.5.1.3. Market size and forecast, by Controller
- 7.5.5.1.4. Market size and forecast, by Industry Vertical
- 7.5.5.2. Middle East
- 7.5.5.2.1. Key market trends, growth factors and opportunities
- 7.5.5.2.2. Market size and forecast, by Compensation Type
- 7.5.5.2.3. Market size and forecast, by Controller
- 7.5.5.2.4. Market size and forecast, by Industry Vertical
- 7.5.5.3. Africa
- 7.5.5.3.1. Key market trends, growth factors and opportunities
- 7.5.5.3.2. Market size and forecast, by Compensation Type
- 7.5.5.3.3. Market size and forecast, by Controller
- 7.5.5.3.4. Market size and forecast, by Industry Vertical
CHAPTER 8: COMPETITIVE LANDSCAPE
- 8.1. Introduction
- 8.2. Top winning strategies
- 8.3. Product Mapping of Top 10 Player
- 8.4. Competitive Dashboard
- 8.5. Competitive Heatmap
- 8.6. Top player positioning, 2022
CHAPTER 9: COMPANY PROFILES
- 9.1. ABB Ltd.
- 9.1.1. Company overview
- 9.1.2. Key Executives
- 9.1.3. Company snapshot
- 9.1.4. Operating business segments
- 9.1.5. Product portfolio
- 9.1.6. Business performance
- 9.2. Adani Power Ltd
- 9.2.1. Company overview
- 9.2.2. Key Executives
- 9.2.3. Company snapshot
- 9.2.4. Operating business segments
- 9.2.5. Product portfolio
- 9.2.6. Business performance
- 9.2.7. Key strategic moves and developments
- 9.3. Alstom SA
- 9.3.1. Company overview
- 9.3.2. Key Executives
- 9.3.3. Company snapshot
- 9.3.4. Operating business segments
- 9.3.5. Product portfolio
- 9.3.6. Business performance
- 9.4. CG Power and Industrial Solutions Limited.
- 9.4.1. Company overview
- 9.4.2. Key Executives
- 9.4.3. Company snapshot
- 9.4.4. Operating business segments
- 9.4.5. Product portfolio
- 9.4.6. Business performance
- 9.5. Eaton Corporation
- 9.5.1. Company overview
- 9.5.2. Key Executives
- 9.5.3. Company snapshot
- 9.5.4. Operating business segments
- 9.5.5. Product portfolio
- 9.5.6. Business performance
- 9.6. General Electric
- 9.6.1. Company overview
- 9.6.2. Key Executives
- 9.6.3. Company snapshot
- 9.6.4. Operating business segments
- 9.6.5. Product portfolio
- 9.6.6. Business performance
- 9.6.7. Key strategic moves and developments
- 9.7. Hyosung Corporation.
- 9.7.1. Company overview
- 9.7.2. Key Executives
- 9.7.3. Company snapshot
- 9.7.4. Operating business segments
- 9.7.5. Product portfolio
- 9.7.6. Business performance
- 9.8. Mitsubishi Electric Corporation
- 9.8.1. Company overview
- 9.8.2. Key Executives
- 9.8.3. Company snapshot
- 9.8.4. Operating business segments
- 9.8.5. Product portfolio
- 9.8.6. Business performance
- 9.8.7. Key strategic moves and developments
- 9.9. NR Electric Co., Ltd.
- 9.9.1. Company overview
- 9.9.2. Key Executives
- 9.9.3. Company snapshot
- 9.9.4. Operating business segments
- 9.9.5. Product portfolio
- 9.10. Siemens
- 9.10.1. Company overview
- 9.10.2. Key Executives
- 9.10.3. Company snapshot
- 9.10.4. Operating business segments
- 9.10.5. Product portfolio
- 9.10.6. Business performance