
|
市場調査レポート
商品コード
1344414
産業用掃除機市場:製品タイプ別、運転モード別、エンドユーザー産業別:世界の機会分析と産業予測、2023-2032年Industrial Vacuum Cleaner Market By Product Type, By Mode of Operation, By End-User Industry : Global Opportunity Analysis and Industry Forecast, 2023-2032 |
||||||
|
|||||||

| 産業用掃除機市場:製品タイプ別、運転モード別、エンドユーザー産業別:世界の機会分析と産業予測、2023-2032年 |
|
出版日: 2023年05月30日
発行: Allied Market Research
ページ情報: 英文 270 Pages
納期: 2~3営業日
|

- 全表示
- 概要
- 図表
- 目次
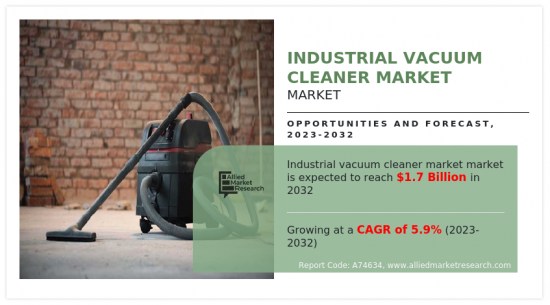
Allied Market Researchが発行した最新レポート「産業用掃除機市場」によると、産業用掃除機市場は2022年に9億5,680万米ドルと評価され、2023年から2032年にかけてCAGR 5.9%で成長し、2032年には17億米ドルに達すると推定されています。
産業用掃除機は、油、グリース、微細粉塵のような物質を効果的に掃除して衛生状態を維持するために、産業で広く使用されています。これらのバキュームクリーナーは、様々なタイプのほこり、固体、または液体を処理するための特別な機能で設計されています。産業用掃除機の構成は、必要な吸引力や吸引する物質の性質や量などの要因によって異なります。
産業用掃除機は、市場で幅広いサイズ、容量、およびタイプで利用できるため、小規模および大規模の産業で使用できます。産業用掃除機は、速いペースのクリーニングや、アクセスが困難なスペースをクリーニングする能力などの利点により、人気の上昇を記録しています。
世界中の飲食品の需要の増加は、産業用掃除機市場の成長を促進すると予想されています。さらに、人口の増加と新しいウイルスや病気の発症に起因する製薬分野の成長は、産業用掃除機の需要を促進すると予想されます。しかし、産業用掃除機の運転コストが高いことが市場の成長抑制要因となっています。さらに、自律型産業用掃除機の開発と、小規模産業部門を支援するための有利な政府のイニシアチブは、市場の成長に有利な機会を提供すると予想されます。
さらに、ウクライナとロシアの紛争は広範囲に影響を及ぼし、世界のインフレ率に大きな影響を与えています。その直接の結果として、石油・ガスなどの基礎商品価格の変動が大きくなり、さまざまな分野が予断を許さない状況になっています。このような景気後退は、産業用掃除機業界とその関連業界に目に見える形で影響を及ぼし、成長の妨げとなっています。メーカーやサプライヤーが直面する困難は、増大するコストと必要な資源の不安定な利用可能性によって、大きく悪化しています。このような不透明な時代を乗り切るために、企業はインフレの進行や商品価格の変動による悪影響を軽減するための戦略を適応させ、回復力を養い、成長を維持するための代替アプローチを模索しなければならないです。
目次
第1章 イントロダクション
第2章 エグゼクティブサマリー
第3章 市場概要
- 市場の定義と範囲
- 主な調査結果
- 影響要因
- 主な投資機会
- ポーターのファイブフォース分析
- 市場力学
- 促進要因
- 製造業の成長
- 製造施設における衛生状態の維持の必要性
- 飲食品産業の成長
- 抑制要因
- 追加的な操業コスト
- 機会
- 新興国における小規模産業の増加
- 促進要因
- COVID-19による市場への影響分析
第4章 産業用掃除機市場:製品タイプ別
- 直立型
- キャニスター型
- バックパック型
- その他
第5章 産業用掃除機市場:運転モード別
- 電気式
- 空気圧式
第6章 産業用掃除機市場:エンドユーザー産業別
- 食品・飲料品
- エレクトロニクス
- 医薬品
- その他
第7章 産業用掃除機市場:地域別
- 北米
- 米国
- カナダ
- メキシコ
- 欧州
- ドイツ
- フランス
- 英国
- イタリア
- その他欧州
- アジア太平洋
- 中国
- インド
- 日本
- 韓国
- その他アジア太平洋地域
- ラテンアメリカ
- ラテンアメリカ
- 中東
- アフリカ
第8章 競合情勢
- イントロダクション
- 主要成功戦略
- 主要10社の製品マッピング
- 競合ダッシュボード
- 競合ヒートマップ
- 主要企業のポジショニング、2022年
第9章 企業プロファイル
- Alfred Karcher GmbH & Co. KG
- ACPL GROUP
- dynavac
- Kevac srl
- SJE Corporation Ltd.
- Tennant Company
- American Vacuum Company
- Nilfisk Group
- Hoover Commercial
- Delfinvacuums
LIST OF TABLES
- TABLE 01. GLOBAL INDUSTRIAL VACUUM CLEANER MARKET, BY PRODUCT TYPE, 2022-2032 ($MILLION)
- TABLE 02. INDUSTRIAL VACUUM CLEANER MARKET FOR UPRIGHT, BY REGION, 2022-2032 ($MILLION)
- TABLE 03. INDUSTRIAL VACUUM CLEANER MARKET FOR CANISTERS, BY REGION, 2022-2032 ($MILLION)
- TABLE 04. INDUSTRIAL VACUUM CLEANER MARKET FOR BACKPACKS, BY REGION, 2022-2032 ($MILLION)
- TABLE 05. INDUSTRIAL VACUUM CLEANER MARKET FOR OTHERS, BY REGION, 2022-2032 ($MILLION)
- TABLE 06. GLOBAL INDUSTRIAL VACUUM CLEANER MARKET, BY MODE OF OPERATION, 2022-2032 ($MILLION)
- TABLE 07. INDUSTRIAL VACUUM CLEANER MARKET FOR ELECTRIC, BY REGION, 2022-2032 ($MILLION)
- TABLE 08. INDUSTRIAL VACUUM CLEANER MARKET FOR PNEUMATIC, BY REGION, 2022-2032 ($MILLION)
- TABLE 09. GLOBAL INDUSTRIAL VACUUM CLEANER MARKET, BY END-USER INDUSTRY, 2022-2032 ($MILLION)
- TABLE 10. INDUSTRIAL VACUUM CLEANER MARKET FOR FOODS AND BEVERAGES, BY REGION, 2022-2032 ($MILLION)
- TABLE 11. INDUSTRIAL VACUUM CLEANER MARKET FOR ELECTRONICS, BY REGION, 2022-2032 ($MILLION)
- TABLE 12. INDUSTRIAL VACUUM CLEANER MARKET FOR PHARMACEUTICALS, BY REGION, 2022-2032 ($MILLION)
- TABLE 13. INDUSTRIAL VACUUM CLEANER MARKET FOR OTHERS, BY REGION, 2022-2032 ($MILLION)
- TABLE 14. INDUSTRIAL VACUUM CLEANER MARKET, BY REGION, 2022-2032 ($MILLION)
- TABLE 15. NORTH AMERICA INDUSTRIAL VACUUM CLEANER MARKET, BY PRODUCT TYPE, 2022-2032 ($MILLION)
- TABLE 16. NORTH AMERICA INDUSTRIAL VACUUM CLEANER MARKET, BY MODE OF OPERATION, 2022-2032 ($MILLION)
- TABLE 17. NORTH AMERICA INDUSTRIAL VACUUM CLEANER MARKET, BY END-USER INDUSTRY, 2022-2032 ($MILLION)
- TABLE 18. NORTH AMERICA INDUSTRIAL VACUUM CLEANER MARKET, BY COUNTRY, 2022-2032 ($MILLION)
- TABLE 19. U.S. INDUSTRIAL VACUUM CLEANER MARKET, BY PRODUCT TYPE, 2022-2032 ($MILLION)
- TABLE 20. U.S. INDUSTRIAL VACUUM CLEANER MARKET, BY MODE OF OPERATION, 2022-2032 ($MILLION)
- TABLE 21. U.S. INDUSTRIAL VACUUM CLEANER MARKET, BY END-USER INDUSTRY, 2022-2032 ($MILLION)
- TABLE 22. CANADA INDUSTRIAL VACUUM CLEANER MARKET, BY PRODUCT TYPE, 2022-2032 ($MILLION)
- TABLE 23. CANADA INDUSTRIAL VACUUM CLEANER MARKET, BY MODE OF OPERATION, 2022-2032 ($MILLION)
- TABLE 24. CANADA INDUSTRIAL VACUUM CLEANER MARKET, BY END-USER INDUSTRY, 2022-2032 ($MILLION)
- TABLE 25. MEXICO INDUSTRIAL VACUUM CLEANER MARKET, BY PRODUCT TYPE, 2022-2032 ($MILLION)
- TABLE 26. MEXICO INDUSTRIAL VACUUM CLEANER MARKET, BY MODE OF OPERATION, 2022-2032 ($MILLION)
- TABLE 27. MEXICO INDUSTRIAL VACUUM CLEANER MARKET, BY END-USER INDUSTRY, 2022-2032 ($MILLION)
- TABLE 28. EUROPE INDUSTRIAL VACUUM CLEANER MARKET, BY PRODUCT TYPE, 2022-2032 ($MILLION)
- TABLE 29. EUROPE INDUSTRIAL VACUUM CLEANER MARKET, BY MODE OF OPERATION, 2022-2032 ($MILLION)
- TABLE 30. EUROPE INDUSTRIAL VACUUM CLEANER MARKET, BY END-USER INDUSTRY, 2022-2032 ($MILLION)
- TABLE 31. EUROPE INDUSTRIAL VACUUM CLEANER MARKET, BY COUNTRY, 2022-2032 ($MILLION)
- TABLE 32. GERMANY INDUSTRIAL VACUUM CLEANER MARKET, BY PRODUCT TYPE, 2022-2032 ($MILLION)
- TABLE 33. GERMANY INDUSTRIAL VACUUM CLEANER MARKET, BY MODE OF OPERATION, 2022-2032 ($MILLION)
- TABLE 34. GERMANY INDUSTRIAL VACUUM CLEANER MARKET, BY END-USER INDUSTRY, 2022-2032 ($MILLION)
- TABLE 35. FRANCE INDUSTRIAL VACUUM CLEANER MARKET, BY PRODUCT TYPE, 2022-2032 ($MILLION)
- TABLE 36. FRANCE INDUSTRIAL VACUUM CLEANER MARKET, BY MODE OF OPERATION, 2022-2032 ($MILLION)
- TABLE 37. FRANCE INDUSTRIAL VACUUM CLEANER MARKET, BY END-USER INDUSTRY, 2022-2032 ($MILLION)
- TABLE 38. UK INDUSTRIAL VACUUM CLEANER MARKET, BY PRODUCT TYPE, 2022-2032 ($MILLION)
- TABLE 39. UK INDUSTRIAL VACUUM CLEANER MARKET, BY MODE OF OPERATION, 2022-2032 ($MILLION)
- TABLE 40. UK INDUSTRIAL VACUUM CLEANER MARKET, BY END-USER INDUSTRY, 2022-2032 ($MILLION)
- TABLE 41. ITALY INDUSTRIAL VACUUM CLEANER MARKET, BY PRODUCT TYPE, 2022-2032 ($MILLION)
- TABLE 42. ITALY INDUSTRIAL VACUUM CLEANER MARKET, BY MODE OF OPERATION, 2022-2032 ($MILLION)
- TABLE 43. ITALY INDUSTRIAL VACUUM CLEANER MARKET, BY END-USER INDUSTRY, 2022-2032 ($MILLION)
- TABLE 44. REST OF EUROPE INDUSTRIAL VACUUM CLEANER MARKET, BY PRODUCT TYPE, 2022-2032 ($MILLION)
- TABLE 45. REST OF EUROPE INDUSTRIAL VACUUM CLEANER MARKET, BY MODE OF OPERATION, 2022-2032 ($MILLION)
- TABLE 46. REST OF EUROPE INDUSTRIAL VACUUM CLEANER MARKET, BY END-USER INDUSTRY, 2022-2032 ($MILLION)
- TABLE 47. ASIA-PACIFIC INDUSTRIAL VACUUM CLEANER MARKET, BY PRODUCT TYPE, 2022-2032 ($MILLION)
- TABLE 48. ASIA-PACIFIC INDUSTRIAL VACUUM CLEANER MARKET, BY MODE OF OPERATION, 2022-2032 ($MILLION)
- TABLE 49. ASIA-PACIFIC INDUSTRIAL VACUUM CLEANER MARKET, BY END-USER INDUSTRY, 2022-2032 ($MILLION)
- TABLE 50. ASIA-PACIFIC INDUSTRIAL VACUUM CLEANER MARKET, BY COUNTRY, 2022-2032 ($MILLION)
- TABLE 51. CHINA INDUSTRIAL VACUUM CLEANER MARKET, BY PRODUCT TYPE, 2022-2032 ($MILLION)
- TABLE 52. CHINA INDUSTRIAL VACUUM CLEANER MARKET, BY MODE OF OPERATION, 2022-2032 ($MILLION)
- TABLE 53. CHINA INDUSTRIAL VACUUM CLEANER MARKET, BY END-USER INDUSTRY, 2022-2032 ($MILLION)
- TABLE 54. INDIA INDUSTRIAL VACUUM CLEANER MARKET, BY PRODUCT TYPE, 2022-2032 ($MILLION)
- TABLE 55. INDIA INDUSTRIAL VACUUM CLEANER MARKET, BY MODE OF OPERATION, 2022-2032 ($MILLION)
- TABLE 56. INDIA INDUSTRIAL VACUUM CLEANER MARKET, BY END-USER INDUSTRY, 2022-2032 ($MILLION)
- TABLE 57. JAPAN INDUSTRIAL VACUUM CLEANER MARKET, BY PRODUCT TYPE, 2022-2032 ($MILLION)
- TABLE 58. JAPAN INDUSTRIAL VACUUM CLEANER MARKET, BY MODE OF OPERATION, 2022-2032 ($MILLION)
- TABLE 59. JAPAN INDUSTRIAL VACUUM CLEANER MARKET, BY END-USER INDUSTRY, 2022-2032 ($MILLION)
- TABLE 60. SOUTH KOREA INDUSTRIAL VACUUM CLEANER MARKET, BY PRODUCT TYPE, 2022-2032 ($MILLION)
- TABLE 61. SOUTH KOREA INDUSTRIAL VACUUM CLEANER MARKET, BY MODE OF OPERATION, 2022-2032 ($MILLION)
- TABLE 62. SOUTH KOREA INDUSTRIAL VACUUM CLEANER MARKET, BY END-USER INDUSTRY, 2022-2032 ($MILLION)
- TABLE 63. REST OF ASIA-PACIFIC INDUSTRIAL VACUUM CLEANER MARKET, BY PRODUCT TYPE, 2022-2032 ($MILLION)
- TABLE 64. REST OF ASIA-PACIFIC INDUSTRIAL VACUUM CLEANER MARKET, BY MODE OF OPERATION, 2022-2032 ($MILLION)
- TABLE 65. REST OF ASIA-PACIFIC INDUSTRIAL VACUUM CLEANER MARKET, BY END-USER INDUSTRY, 2022-2032 ($MILLION)
- TABLE 66. LAMEA INDUSTRIAL VACUUM CLEANER MARKET, BY PRODUCT TYPE, 2022-2032 ($MILLION)
- TABLE 67. LAMEA INDUSTRIAL VACUUM CLEANER MARKET, BY MODE OF OPERATION, 2022-2032 ($MILLION)
- TABLE 68. LAMEA INDUSTRIAL VACUUM CLEANER MARKET, BY END-USER INDUSTRY, 2022-2032 ($MILLION)
- TABLE 69. LAMEA INDUSTRIAL VACUUM CLEANER MARKET, BY COUNTRY, 2022-2032 ($MILLION)
- TABLE 70. LATIN AMERICA INDUSTRIAL VACUUM CLEANER MARKET, BY PRODUCT TYPE, 2022-2032 ($MILLION)
- TABLE 71. LATIN AMERICA INDUSTRIAL VACUUM CLEANER MARKET, BY MODE OF OPERATION, 2022-2032 ($MILLION)
- TABLE 72. LATIN AMERICA INDUSTRIAL VACUUM CLEANER MARKET, BY END-USER INDUSTRY, 2022-2032 ($MILLION)
- TABLE 73. MIDDLE EAST INDUSTRIAL VACUUM CLEANER MARKET, BY PRODUCT TYPE, 2022-2032 ($MILLION)
- TABLE 74. MIDDLE EAST INDUSTRIAL VACUUM CLEANER MARKET, BY MODE OF OPERATION, 2022-2032 ($MILLION)
- TABLE 75. MIDDLE EAST INDUSTRIAL VACUUM CLEANER MARKET, BY END-USER INDUSTRY, 2022-2032 ($MILLION)
- TABLE 76. AFRICA INDUSTRIAL VACUUM CLEANER MARKET, BY PRODUCT TYPE, 2022-2032 ($MILLION)
- TABLE 77. AFRICA INDUSTRIAL VACUUM CLEANER MARKET, BY MODE OF OPERATION, 2022-2032 ($MILLION)
- TABLE 78. AFRICA INDUSTRIAL VACUUM CLEANER MARKET, BY END-USER INDUSTRY, 2022-2032 ($MILLION)
- TABLE 79. ALFRED KARCHER GMBH & CO. KG: KEY EXECUTIVES
- TABLE 80. ALFRED KARCHER GMBH & CO. KG: COMPANY SNAPSHOT
- TABLE 81. ALFRED KARCHER GMBH & CO. KG: PRODUCT SEGMENTS
- TABLE 82. ALFRED KARCHER GMBH & CO. KG: PRODUCT PORTFOLIO
- TABLE 83. ACPL GROUP: KEY EXECUTIVES
- TABLE 84. ACPL GROUP: COMPANY SNAPSHOT
- TABLE 85. ACPL GROUP: PRODUCT SEGMENTS
- TABLE 86. ACPL GROUP: PRODUCT PORTFOLIO
- TABLE 87. DYNAVAC: KEY EXECUTIVES
- TABLE 88. DYNAVAC: COMPANY SNAPSHOT
- TABLE 89. DYNAVAC: PRODUCT SEGMENTS
- TABLE 90. DYNAVAC: PRODUCT PORTFOLIO
- TABLE 91. KEVAC SRL: KEY EXECUTIVES
- TABLE 92. KEVAC SRL: COMPANY SNAPSHOT
- TABLE 93. KEVAC SRL: PRODUCT SEGMENTS
- TABLE 94. KEVAC SRL: PRODUCT PORTFOLIO
- TABLE 95. SJE CORPORATION LTD.: KEY EXECUTIVES
- TABLE 96. SJE CORPORATION LTD.: COMPANY SNAPSHOT
- TABLE 97. SJE CORPORATION LTD.: PRODUCT SEGMENTS
- TABLE 98. SJE CORPORATION LTD.: PRODUCT PORTFOLIO
- TABLE 99. TENNANT COMPANY: KEY EXECUTIVES
- TABLE 100. TENNANT COMPANY: COMPANY SNAPSHOT
- TABLE 101. TENNANT COMPANY: PRODUCT SEGMENTS
- TABLE 102. TENNANT COMPANY: PRODUCT PORTFOLIO
- TABLE 103. AMERICAN VACUUM COMPANY: KEY EXECUTIVES
- TABLE 104. AMERICAN VACUUM COMPANY: COMPANY SNAPSHOT
- TABLE 105. AMERICAN VACUUM COMPANY: PRODUCT SEGMENTS
- TABLE 106. AMERICAN VACUUM COMPANY: PRODUCT PORTFOLIO
- TABLE 107. NILFISK GROUP: KEY EXECUTIVES
- TABLE 108. NILFISK GROUP: COMPANY SNAPSHOT
- TABLE 109. NILFISK GROUP: PRODUCT SEGMENTS
- TABLE 110. NILFISK GROUP: PRODUCT PORTFOLIO
- TABLE 111. HOOVER COMMERCIAL: KEY EXECUTIVES
- TABLE 112. HOOVER COMMERCIAL: COMPANY SNAPSHOT
- TABLE 113. HOOVER COMMERCIAL: PRODUCT SEGMENTS
- TABLE 114. HOOVER COMMERCIAL: PRODUCT PORTFOLIO
- TABLE 115. DELFINVACUUMS: KEY EXECUTIVES
- TABLE 116. DELFINVACUUMS: COMPANY SNAPSHOT
- TABLE 117. DELFINVACUUMS: PRODUCT SEGMENTS
- TABLE 118. DELFINVACUUMS: PRODUCT PORTFOLIO
LIST OF FIGURES
- FIGURE 01. INDUSTRIAL VACUUM CLEANER MARKET, 2022-2032
- FIGURE 02. SEGMENTATION OF INDUSTRIAL VACUUM CLEANER MARKET, 2022-2032
- FIGURE 03. TOP INVESTMENT POCKETS IN INDUSTRIAL VACUUM CLEANER MARKET (2023-2032)
- FIGURE 04. MODERATE BARGAINING POWER OF SUPPLIERS
- FIGURE 05. MODERATE BARGAINING POWER OF BUYERS
- FIGURE 06. LOW THREAT OF SUBSTITUTES
- FIGURE 07. MODERATE THREAT OF NEW ENTRANTS
- FIGURE 08. LOW INTENSITY OF RIVALRY
- FIGURE 09. DRIVERS, RESTRAINTS AND OPPORTUNITIES: GLOBALINDUSTRIAL VACUUM CLEANER MARKET
- FIGURE 10. INDUSTRIAL VACUUM CLEANER MARKET, BY PRODUCT TYPE, 2022(%)
- FIGURE 11. COMPARATIVE SHARE ANALYSIS OF INDUSTRIAL VACUUM CLEANER MARKET FOR UPRIGHT, BY COUNTRY 2022 AND 2032(%)
- FIGURE 12. COMPARATIVE SHARE ANALYSIS OF INDUSTRIAL VACUUM CLEANER MARKET FOR CANISTERS, BY COUNTRY 2022 AND 2032(%)
- FIGURE 13. COMPARATIVE SHARE ANALYSIS OF INDUSTRIAL VACUUM CLEANER MARKET FOR BACKPACKS, BY COUNTRY 2022 AND 2032(%)
- FIGURE 14. COMPARATIVE SHARE ANALYSIS OF INDUSTRIAL VACUUM CLEANER MARKET FOR OTHERS, BY COUNTRY 2022 AND 2032(%)
- FIGURE 15. INDUSTRIAL VACUUM CLEANER MARKET, BY MODE OF OPERATION, 2022(%)
- FIGURE 16. COMPARATIVE SHARE ANALYSIS OF INDUSTRIAL VACUUM CLEANER MARKET FOR ELECTRIC, BY COUNTRY 2022 AND 2032(%)
- FIGURE 17. COMPARATIVE SHARE ANALYSIS OF INDUSTRIAL VACUUM CLEANER MARKET FOR PNEUMATIC, BY COUNTRY 2022 AND 2032(%)
- FIGURE 18. INDUSTRIAL VACUUM CLEANER MARKET, BY END-USER INDUSTRY, 2022(%)
- FIGURE 19. COMPARATIVE SHARE ANALYSIS OF INDUSTRIAL VACUUM CLEANER MARKET FOR FOODS AND BEVERAGES, BY COUNTRY 2022 AND 2032(%)
- FIGURE 20. COMPARATIVE SHARE ANALYSIS OF INDUSTRIAL VACUUM CLEANER MARKET FOR ELECTRONICS, BY COUNTRY 2022 AND 2032(%)
- FIGURE 21. COMPARATIVE SHARE ANALYSIS OF INDUSTRIAL VACUUM CLEANER MARKET FOR PHARMACEUTICALS, BY COUNTRY 2022 AND 2032(%)
- FIGURE 22. COMPARATIVE SHARE ANALYSIS OF INDUSTRIAL VACUUM CLEANER MARKET FOR OTHERS, BY COUNTRY 2022 AND 2032(%)
- FIGURE 23. INDUSTRIAL VACUUM CLEANER MARKET BY REGION, 2022
- FIGURE 24. U.S. INDUSTRIAL VACUUM CLEANER MARKET, 2022-2032 ($MILLION)
- FIGURE 25. CANADA INDUSTRIAL VACUUM CLEANER MARKET, 2022-2032 ($MILLION)
- FIGURE 26. MEXICO INDUSTRIAL VACUUM CLEANER MARKET, 2022-2032 ($MILLION)
- FIGURE 27. GERMANY INDUSTRIAL VACUUM CLEANER MARKET, 2022-2032 ($MILLION)
- FIGURE 28. FRANCE INDUSTRIAL VACUUM CLEANER MARKET, 2022-2032 ($MILLION)
- FIGURE 29. UK INDUSTRIAL VACUUM CLEANER MARKET, 2022-2032 ($MILLION)
- FIGURE 30. ITALY INDUSTRIAL VACUUM CLEANER MARKET, 2022-2032 ($MILLION)
- FIGURE 31. REST OF EUROPE INDUSTRIAL VACUUM CLEANER MARKET, 2022-2032 ($MILLION)
- FIGURE 32. CHINA INDUSTRIAL VACUUM CLEANER MARKET, 2022-2032 ($MILLION)
- FIGURE 33. INDIA INDUSTRIAL VACUUM CLEANER MARKET, 2022-2032 ($MILLION)
- FIGURE 34. JAPAN INDUSTRIAL VACUUM CLEANER MARKET, 2022-2032 ($MILLION)
- FIGURE 35. SOUTH KOREA INDUSTRIAL VACUUM CLEANER MARKET, 2022-2032 ($MILLION)
- FIGURE 36. REST OF ASIA-PACIFIC INDUSTRIAL VACUUM CLEANER MARKET, 2022-2032 ($MILLION)
- FIGURE 37. LATIN AMERICA INDUSTRIAL VACUUM CLEANER MARKET, 2022-2032 ($MILLION)
- FIGURE 38. MIDDLE EAST INDUSTRIAL VACUUM CLEANER MARKET, 2022-2032 ($MILLION)
- FIGURE 39. AFRICA INDUSTRIAL VACUUM CLEANER MARKET, 2022-2032 ($MILLION)
- FIGURE 40. TOP WINNING STRATEGIES, BY YEAR
- FIGURE 41. TOP WINNING STRATEGIES, BY DEVELOPMENT
- FIGURE 42. TOP WINNING STRATEGIES, BY COMPANY
- FIGURE 43. PRODUCT MAPPING OF TOP 10 PLAYERS
- FIGURE 44. COMPETITIVE DASHBOARD
- FIGURE 45. COMPETITIVE HEATMAP: INDUSTRIAL VACUUM CLEANER MARKET
- FIGURE 46. TOP PLAYER POSITIONING, 2022
- FIGURE 47. TENNANT COMPANY: NET SALES, 2020-2022 ($MILLION)
- FIGURE 48. TENNANT COMPANY: RESEARCH & DEVELOPMENT EXPENDITURE, 2020-2022 ($MILLION)
- FIGURE 49. TENNANT COMPANY: REVENUE SHARE BY REGION, 2022 (%)
- FIGURE 50. NILFISK GROUP: NET REVENUE, 2020-2022 ($MILLION)
- FIGURE 51. NILFISK GROUP: RESEARCH & DEVELOPMENT EXPENDITURE, 2020-2022 ($MILLION)
- FIGURE 52. NILFISK GROUP: REVENUE SHARE BY SEGMENT, 2022 (%)
- FIGURE 53. NILFISK GROUP: REVENUE SHARE BY REGION, 2022 (%)
- FIGURE 54. HOOVER COMMERCIAL: NET REVENUE, 2020-2022 ($MILLION)
- FIGURE 55. HOOVER COMMERCIAL: RESEARCH & DEVELOPMENT EXPENDITURE, 2020-2022 ($MILLION)
- FIGURE 56. HOOVER COMMERCIAL: REVENUE SHARE BY SEGMENT, 2022 (%)
- FIGURE 57. HOOVER COMMERCIAL: REVENUE SHARE BY REGION, 2022 (%)
According to a new report published by Allied Market Research, titled, "Industrial Vacuum Cleaner Market," The industrial vacuum cleaner market was valued at $956.80 million in 2022, and is estimated to reach $1.7 billion by 2032, growing at a CAGR of 5.9% from 2023 to 2032. Industrial vacuum cleaners are extensively used in industries to maintain hygienic conditions by effectively cleaning substances like oil, grease, and fine dust. These vacuum cleaners are designed with specific features to handle various types of dust, solids, or liquids. The configuration of an industrial vacuum cleaner depends on factors such as required suction power and the nature and quantity of the material to be suctioned.
Industrial vacuum cleaners are available in a wide range of sizes, capacities, and types in the market, thereby making it usable by small-and large-scale industries. Industrial vacuum cleaners are registering a rise in popularity, owing to their advantageous features such as fast paced cleaning and their ability to clean difficult-to-access spaces.
The rise in demand for food & beverage products across the world is anticipated to drive the growth of the industrial vacuum cleaner market. In addition, growth in the pharmaceutical sector, owing to the rise in population and onset of new viruses and diseases is anticipated to drive the demand for industrial vacuum cleaners. However, the high cost of operation of industrial vacuum cleaner restraints the growth of the market. Furthermore, development of autonomous industrial vacuum cleaners and favorable government initiatives to support small-scale industrial sectors are expected to provide lucrative opportunities for the growth of the market.
Furthermore, the conflict between Ukraine and Russia has had far-reaching effects, significantly affecting global inflation rates. As a direct result, there has been increased volatility in the price of basic commodities like oil and gas, which has made a variety of sectors unpredictable. These economic downturn has had a visible impact on the industrial vacuum cleaner industry and its related industries, which have seen an obstruction in growth. The difficulty faced by manufacturers and suppliers has been greatly exacerbated by the growing costs and erratic availability of necessary resources. As businesses navigate through these uncertain times, they must adapt their strategies to mitigate the adverse effects of increased inflation and volatile commodity prices, fostering resilience and seeking alternative approaches to sustain growth.
The industrial vacuum cleaner market is segmented on the basis of product type, mode of operation, end-user industry and region. By product type, the market is categorized into upright, canisters and backpacks. On the basis of mode of operation, it is bifurcated into electric and pneumatic. On the basis of end-user industry, it is categorized into food & beverages, electronics, pharmaceuticals, and others. Region wise, the market is analyzed across North America, Europe, Asia-Pacific, and LAMEA. Major players that operate in the global market have adopted key strategies such as product launch to strengthen their market outreach and sustain the stiff competition in the market.
Competition Analysis
Competitive analysis and profiles of the major players in the industrial vacuum cleaner market are provided in the report. Major companies in the report include, Alfred Karcher GmbH & Co. KG., Astol Cleantech Pvt. Ltd., Dynavac, Kevac srl, SJE Corporation Ltd., Tennant Company, American Vacuum Company, Nilfisk, Inc., Hoover Commercial, and Delfin Industrial Vacuums.
Key benefits for stakeholders
- The report provides an extensive analysis of the current and emerging industrial vacuum cleaner market trends and dynamics.
- In-depth market analysis is conducted by constructing market estimations for the key market segments between 2022 and 2032.
- Extensive analysis of the industrial vacuum cleaner market is conducted by following key product positioning and monitoring of the top competitors within the market framework.
- A comprehensive analysis of all regions is provided to determine the prevailing opportunities.
- The global industrial vacuum cleaner market forecast analysis from 2023 to 2032 is included in the report.
- Key market players within the industrial vacuum cleaner market are profiled in this report and their strategies are analyzed thoroughly, which helps understand the competitive outlook of the industrial vacuum cleaner industry.
Key Market Segments
By Product Type
- Upright
- Canisters
- Backpacks
- Others
By Mode of Operation
- Electric
- Pneumatic
By End-User Industry
- Foods and beverages
- Electronics
- Pharmaceuticals
- Others
By Region
- North America
- U.S.
- Canada
- Mexico
- Europe
- Germany
- France
- UK
- Italy
- Rest of Europe
- Asia-Pacific
- China
- India
- Japan
- South Korea
- Rest of Asia-Pacific
- LAMEA
- Latin America
- Middle East
- Africa
Key Market Players:
- Hoover Commercial
- Tennant Company
- SJE Corporation Ltd.
- Nilfisk Group
- American Vacuum Company
- Kevac srl
- Delfinvacuums
- dynavac
- ACPL GROUP
- Alfred Karcher GmbH & Co. KG
TABLE OF CONTENTS
CHAPTER 1: INTRODUCTION
- 1.1. Report description
- 1.2. Key market segments
- 1.3. Key benefits to the stakeholders
- 1.4. Research Methodology
- 1.4.1. Primary research
- 1.4.2. Secondary research
- 1.4.3. Analyst tools and models
CHAPTER 2: EXECUTIVE SUMMARY
- 2.1. CXO Perspective
CHAPTER 3: MARKET OVERVIEW
- 3.1. Market definition and scope
- 3.2. Key findings
- 3.2.1. Top impacting factors
- 3.2.2. Top investment pockets
- 3.3. Porter's five forces analysis
- 3.3.1. Bargaining power of suppliers
- 3.3.2. Bargaining power of buyers
- 3.3.3. Threat of substitutes
- 3.3.4. Threat of new entrants
- 3.3.5. Intensity of rivalry
- 3.4. Market dynamics
- 3.4.1. Drivers
- 3.4.1.1. Growth of the manufacturing industry
- 3.4.1.2. Necessity for maintaining hygienic conditions in a manufacturing facility
- 3.4.1.3. Growth of foods & beverages industry
- 3.4.1. Drivers
- 3.4.2. Restraints
- 3.4.2.1. Additional operating cost
- 3.4.3. Opportunities
- 3.4.3.1. Rise in number of small-scale industries in emerging economies
- 3.5. COVID-19 Impact Analysis on the market
CHAPTER 4: INDUSTRIAL VACUUM CLEANER MARKET, BY PRODUCT TYPE
- 4.1. Overview
- 4.1.1. Market size and forecast
- 4.2. Upright
- 4.2.1. Key market trends, growth factors and opportunities
- 4.2.2. Market size and forecast, by region
- 4.2.3. Market share analysis by country
- 4.3. Canisters
- 4.3.1. Key market trends, growth factors and opportunities
- 4.3.2. Market size and forecast, by region
- 4.3.3. Market share analysis by country
- 4.4. Backpacks
- 4.4.1. Key market trends, growth factors and opportunities
- 4.4.2. Market size and forecast, by region
- 4.4.3. Market share analysis by country
- 4.5. Others
- 4.5.1. Key market trends, growth factors and opportunities
- 4.5.2. Market size and forecast, by region
- 4.5.3. Market share analysis by country
CHAPTER 5: INDUSTRIAL VACUUM CLEANER MARKET, BY MODE OF OPERATION
- 5.1. Overview
- 5.1.1. Market size and forecast
- 5.2. Electric
- 5.2.1. Key market trends, growth factors and opportunities
- 5.2.2. Market size and forecast, by region
- 5.2.3. Market share analysis by country
- 5.3. Pneumatic
- 5.3.1. Key market trends, growth factors and opportunities
- 5.3.2. Market size and forecast, by region
- 5.3.3. Market share analysis by country
CHAPTER 6: INDUSTRIAL VACUUM CLEANER MARKET, BY END-USER INDUSTRY
- 6.1. Overview
- 6.1.1. Market size and forecast
- 6.2. Foods and beverages
- 6.2.1. Key market trends, growth factors and opportunities
- 6.2.2. Market size and forecast, by region
- 6.2.3. Market share analysis by country
- 6.3. Electronics
- 6.3.1. Key market trends, growth factors and opportunities
- 6.3.2. Market size and forecast, by region
- 6.3.3. Market share analysis by country
- 6.4. Pharmaceuticals
- 6.4.1. Key market trends, growth factors and opportunities
- 6.4.2. Market size and forecast, by region
- 6.4.3. Market share analysis by country
- 6.5. Others
- 6.5.1. Key market trends, growth factors and opportunities
- 6.5.2. Market size and forecast, by region
- 6.5.3. Market share analysis by country
CHAPTER 7: INDUSTRIAL VACUUM CLEANER MARKET, BY REGION
- 7.1. Overview
- 7.1.1. Market size and forecast By Region
- 7.2. North America
- 7.2.1. Key trends and opportunities
- 7.2.2. Market size and forecast, by Product Type
- 7.2.3. Market size and forecast, by Mode of Operation
- 7.2.4. Market size and forecast, by End-User Industry
- 7.2.5. Market size and forecast, by country
- 7.2.5.1. U.S.
- 7.2.5.1.1. Key market trends, growth factors and opportunities
- 7.2.5.1.2. Market size and forecast, by Product Type
- 7.2.5.1.3. Market size and forecast, by Mode of Operation
- 7.2.5.1.4. Market size and forecast, by End-User Industry
- 7.2.5.2. Canada
- 7.2.5.2.1. Key market trends, growth factors and opportunities
- 7.2.5.2.2. Market size and forecast, by Product Type
- 7.2.5.2.3. Market size and forecast, by Mode of Operation
- 7.2.5.2.4. Market size and forecast, by End-User Industry
- 7.2.5.3. Mexico
- 7.2.5.3.1. Key market trends, growth factors and opportunities
- 7.2.5.3.2. Market size and forecast, by Product Type
- 7.2.5.3.3. Market size and forecast, by Mode of Operation
- 7.2.5.3.4. Market size and forecast, by End-User Industry
- 7.3. Europe
- 7.3.1. Key trends and opportunities
- 7.3.2. Market size and forecast, by Product Type
- 7.3.3. Market size and forecast, by Mode of Operation
- 7.3.4. Market size and forecast, by End-User Industry
- 7.3.5. Market size and forecast, by country
- 7.3.5.1. Germany
- 7.3.5.1.1. Key market trends, growth factors and opportunities
- 7.3.5.1.2. Market size and forecast, by Product Type
- 7.3.5.1.3. Market size and forecast, by Mode of Operation
- 7.3.5.1.4. Market size and forecast, by End-User Industry
- 7.3.5.2. France
- 7.3.5.2.1. Key market trends, growth factors and opportunities
- 7.3.5.2.2. Market size and forecast, by Product Type
- 7.3.5.2.3. Market size and forecast, by Mode of Operation
- 7.3.5.2.4. Market size and forecast, by End-User Industry
- 7.3.5.3. UK
- 7.3.5.3.1. Key market trends, growth factors and opportunities
- 7.3.5.3.2. Market size and forecast, by Product Type
- 7.3.5.3.3. Market size and forecast, by Mode of Operation
- 7.3.5.3.4. Market size and forecast, by End-User Industry
- 7.3.5.4. Italy
- 7.3.5.4.1. Key market trends, growth factors and opportunities
- 7.3.5.4.2. Market size and forecast, by Product Type
- 7.3.5.4.3. Market size and forecast, by Mode of Operation
- 7.3.5.4.4. Market size and forecast, by End-User Industry
- 7.3.5.5. Rest of Europe
- 7.3.5.5.1. Key market trends, growth factors and opportunities
- 7.3.5.5.2. Market size and forecast, by Product Type
- 7.3.5.5.3. Market size and forecast, by Mode of Operation
- 7.3.5.5.4. Market size and forecast, by End-User Industry
- 7.4. Asia-Pacific
- 7.4.1. Key trends and opportunities
- 7.4.2. Market size and forecast, by Product Type
- 7.4.3. Market size and forecast, by Mode of Operation
- 7.4.4. Market size and forecast, by End-User Industry
- 7.4.5. Market size and forecast, by country
- 7.4.5.1. China
- 7.4.5.1.1. Key market trends, growth factors and opportunities
- 7.4.5.1.2. Market size and forecast, by Product Type
- 7.4.5.1.3. Market size and forecast, by Mode of Operation
- 7.4.5.1.4. Market size and forecast, by End-User Industry
- 7.4.5.2. India
- 7.4.5.2.1. Key market trends, growth factors and opportunities
- 7.4.5.2.2. Market size and forecast, by Product Type
- 7.4.5.2.3. Market size and forecast, by Mode of Operation
- 7.4.5.2.4. Market size and forecast, by End-User Industry
- 7.4.5.3. Japan
- 7.4.5.3.1. Key market trends, growth factors and opportunities
- 7.4.5.3.2. Market size and forecast, by Product Type
- 7.4.5.3.3. Market size and forecast, by Mode of Operation
- 7.4.5.3.4. Market size and forecast, by End-User Industry
- 7.4.5.4. South Korea
- 7.4.5.4.1. Key market trends, growth factors and opportunities
- 7.4.5.4.2. Market size and forecast, by Product Type
- 7.4.5.4.3. Market size and forecast, by Mode of Operation
- 7.4.5.4.4. Market size and forecast, by End-User Industry
- 7.4.5.5. Rest of Asia-Pacific
- 7.4.5.5.1. Key market trends, growth factors and opportunities
- 7.4.5.5.2. Market size and forecast, by Product Type
- 7.4.5.5.3. Market size and forecast, by Mode of Operation
- 7.4.5.5.4. Market size and forecast, by End-User Industry
- 7.5. LAMEA
- 7.5.1. Key trends and opportunities
- 7.5.2. Market size and forecast, by Product Type
- 7.5.3. Market size and forecast, by Mode of Operation
- 7.5.4. Market size and forecast, by End-User Industry
- 7.5.5. Market size and forecast, by country
- 7.5.5.1. Latin America
- 7.5.5.1.1. Key market trends, growth factors and opportunities
- 7.5.5.1.2. Market size and forecast, by Product Type
- 7.5.5.1.3. Market size and forecast, by Mode of Operation
- 7.5.5.1.4. Market size and forecast, by End-User Industry
- 7.5.5.2. Middle East
- 7.5.5.2.1. Key market trends, growth factors and opportunities
- 7.5.5.2.2. Market size and forecast, by Product Type
- 7.5.5.2.3. Market size and forecast, by Mode of Operation
- 7.5.5.2.4. Market size and forecast, by End-User Industry
- 7.5.5.3. Africa
- 7.5.5.3.1. Key market trends, growth factors and opportunities
- 7.5.5.3.2. Market size and forecast, by Product Type
- 7.5.5.3.3. Market size and forecast, by Mode of Operation
- 7.5.5.3.4. Market size and forecast, by End-User Industry
CHAPTER 8: COMPETITIVE LANDSCAPE
- 8.1. Introduction
- 8.2. Top winning strategies
- 8.3. Product Mapping of Top 10 Player
- 8.4. Competitive Dashboard
- 8.5. Competitive Heatmap
- 8.6. Top player positioning, 2022
CHAPTER 9: COMPANY PROFILES
- 9.1. Alfred Karcher GmbH & Co. KG
- 9.1.1. Company overview
- 9.1.2. Key Executives
- 9.1.3. Company snapshot
- 9.1.4. Operating business segments
- 9.1.5. Product portfolio
- 9.2. ACPL GROUP
- 9.2.1. Company overview
- 9.2.2. Key Executives
- 9.2.3. Company snapshot
- 9.2.4. Operating business segments
- 9.2.5. Product portfolio
- 9.3. dynavac
- 9.3.1. Company overview
- 9.3.2. Key Executives
- 9.3.3. Company snapshot
- 9.3.4. Operating business segments
- 9.3.5. Product portfolio
- 9.4. Kevac srl
- 9.4.1. Company overview
- 9.4.2. Key Executives
- 9.4.3. Company snapshot
- 9.4.4. Operating business segments
- 9.4.5. Product portfolio
- 9.5. SJE Corporation Ltd.
- 9.5.1. Company overview
- 9.5.2. Key Executives
- 9.5.3. Company snapshot
- 9.5.4. Operating business segments
- 9.5.5. Product portfolio
- 9.6. Tennant Company
- 9.6.1. Company overview
- 9.6.2. Key Executives
- 9.6.3. Company snapshot
- 9.6.4. Operating business segments
- 9.6.5. Product portfolio
- 9.6.6. Business performance
- 9.7. American Vacuum Company
- 9.7.1. Company overview
- 9.7.2. Key Executives
- 9.7.3. Company snapshot
- 9.7.4. Operating business segments
- 9.7.5. Product portfolio
- 9.8. Nilfisk Group
- 9.8.1. Company overview
- 9.8.2. Key Executives
- 9.8.3. Company snapshot
- 9.8.4. Operating business segments
- 9.8.5. Product portfolio
- 9.8.6. Business performance
- 9.9. Hoover Commercial
- 9.9.1. Company overview
- 9.9.2. Key Executives
- 9.9.3. Company snapshot
- 9.9.4. Operating business segments
- 9.9.5. Product portfolio
- 9.9.6. Business performance
- 9.10. Delfinvacuums
- 9.10.1. Company overview
- 9.10.2. Key Executives
- 9.10.3. Company snapshot
- 9.10.4. Operating business segments
- 9.10.5. Product portfolio