 |
市場調査レポート
商品コード
1344405
機械センサー市場:タイプ別、最終用途産業別:世界の機会分析と産業予測、2023-2032年Machine Sensor Market By Type, By End Use Industry : Global Opportunity Analysis and Industry Forecast, 2023-2032 |
||||||

| 機械センサー市場:タイプ別、最終用途産業別:世界の機会分析と産業予測、2023-2032年 |
|
出版日: 2023年05月30日
発行: Allied Market Research
ページ情報: 英文 243 Pages
納期: 2~3営業日
|
- 全表示
- 概要
- 図表
- 目次
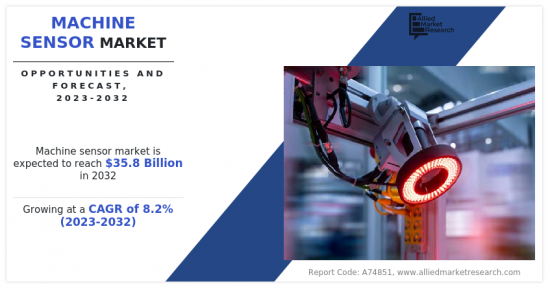
Allied Market Researchが発行した最新の調査レポート「機械センサー市場」によると、機械センサー市場は2022年に165億米ドルと評価され、2023年から2032年にかけてCAGR 8.2%で成長し、2032年には358億米ドルに達すると推定されています。
機械センサーは、機械や工業プロセスにおける温度、圧力、振動、流量などの物理的変数を検出・測定するために使用される装置やシステムです。機械センサーは、機械の健全性と性能を監視し、異常や故障を検出し、産業プロセスの性能を最適化するために使用されることが多いです。
エネルギー管理は、機械のエネルギー消費をモニターし、エネルギーを節約できる場所を特定できるため、機械センサーが適用できる分野です。これは、エネルギー消費が重要な関心事である産業において、コスト削減とエネルギー効率の改善に役立ちます。
機械センサー市場は、予知保全の採用が増加していることから、今後も成長が見込まれます。予知保全とは、リアルタイムの機械データを頼りに保全が必要な時期を予測し、予期せぬダウンタイムを防いで保全コストを削減する予防的な保全戦略です。機械センサーは、機械の性能を監視し、異常を特定し、潜在的な故障を事前に検出するために必要なリアルタイムデータを提供するため、予知保全には不可欠です。
電磁界からの干渉や複雑な信号処理アルゴリズムの必要性などの技術的課題は、機械センサー市場に課題を突きつけています。これらの課題により、正確で信頼性の高いセンサーデータの確保が困難になる可能性があります。機械センサーのメーカーやサプライヤーは、これらの技術的課題を克服し、センサーデータの精度と信頼性を向上させるための研究開発に投資する必要があるかもしれないです。
予知保全は、センサーデータと予測分析を利用して保全活動の最適な時期を決定する、産業機器や機械の保全に対する先進的なアプローチです。あらかじめ決められた間隔に依存する従来のメンテナンス・スケジュールとは異なり、予知保全はリアルタイム・データを活用して潜在的な問題を特定し、機器の故障を未然に防ぎます。センサーデータを取得し、データ通信を促進することで、予知保全は機器性能の継続的な監視を可能にし、メンテナンスの実施時期を予測するのに役立ちます。このプロアクティブ・アプローチは、製造工場のダウンタイムを最小限に抑えるだけでなく、商品の生産が中断されないことを保証し、顧客体験の向上と収益性の向上につながります。その結果、予知保全ソリューションで重要な役割を果たす産業用センサーの需要は、近い将来に大きく伸びると予想されます。このため、産業用センサー市場の市場関係者は、この上昇傾向を利用し、予測保守ソリューションの需要増に対応する有利な機会を得ることができます。
目次
第1章 イントロダクション
第2章 エグゼクティブサマリー
第3章 市場概要
- 市場の定義と範囲
- 主な調査結果
- 影響要因
- 主な投資機会
- ポーターのファイブフォース分析
- 市場力学
- 促進要因
- 自動化とデジタル化が機械センサー市場の成長を促進。
- エネルギー効率と持続可能性への関心の高まりが機械センサー市場を牽引。
- 抑制要因
- 機械センサーの高コストが、中小企業や価格に敏感な業界にとっての障壁となっています。
- 機会
- 機械センサー市場の成長を促進するスマートセンサー
- 促進要因
- COVID-19による市場への影響分析
第4章 機械センサー市場:タイプ別
- 温度センサー
- 圧力センサー
- 位置センサー
- 近接センサー
- 力・トルクセンサー
- その他
第5章 機械センサー市場:最終用途産業別
- 製造業
- 石油・ガス
- 自動車
- 航空宇宙
- ヘルスケア
- その他
第6章 機械センサー市場:地域別
- 北米
- 米国
- カナダ
- メキシコ
- 欧州
- 英国
- ドイツ
- フランス
- その他欧州
- アジア太平洋
- 中国
- 日本
- インド
- 韓国
- その他アジア太平洋地域
- ラテンアメリカ
- ラテンアメリカ
- 中東
- アフリカ
第7章 競合情勢
- イントロダクション
- 主要成功戦略
- 主要10社の製品マッピング
- 競合ダッシュボード
- 競合ヒートマップ
- 主要企業のポジショニング、2022年
第8章 企業プロファイル
- KYOCERA AVX Components(Werne)GmbH
- ATI Industrial Automation
- Baumer
- FUTEK Advanced Sensor Technology, Inc.
- Honeywell International Inc.,
- Infineon Technologies AG
- OMRON Corporation
- Sensata Technologies, Inc.
- TE Connectivity Ltd.
- Tekscan, Inc.
LIST OF TABLES
- TABLE 01. GLOBAL MACHINE SENSOR MARKET, BY TYPE, 2022-2032 ($MILLION)
- TABLE 02. MACHINE SENSOR MARKET FOR TEMPERATURE SENSOR, BY REGION, 2022-2032 ($MILLION)
- TABLE 03. MACHINE SENSOR MARKET FOR PRESSURE SENSOR, BY REGION, 2022-2032 ($MILLION)
- TABLE 04. MACHINE SENSOR MARKET FOR POSITION SENSOR, BY REGION, 2022-2032 ($MILLION)
- TABLE 05. MACHINE SENSOR MARKET FOR PROXIMITY SENSOR, BY REGION, 2022-2032 ($MILLION)
- TABLE 06. MACHINE SENSOR MARKET FOR FORCE AND TORQUE SENSOR, BY REGION, 2022-2032 ($MILLION)
- TABLE 07. MACHINE SENSOR MARKET FOR OTHERS, BY REGION, 2022-2032 ($MILLION)
- TABLE 08. GLOBAL MACHINE SENSOR MARKET, BY END USE INDUSTRY, 2022-2032 ($MILLION)
- TABLE 09. MACHINE SENSOR MARKET FOR MANUFACTURING, BY REGION, 2022-2032 ($MILLION)
- TABLE 10. MACHINE SENSOR MARKET FOR OIL AND GAS, BY REGION, 2022-2032 ($MILLION)
- TABLE 11. MACHINE SENSOR MARKET FOR AUTOMOTIVE, BY REGION, 2022-2032 ($MILLION)
- TABLE 12. MACHINE SENSOR MARKET FOR AEROSPACE, BY REGION, 2022-2032 ($MILLION)
- TABLE 13. MACHINE SENSOR MARKET FOR HEALTHCARE, BY REGION, 2022-2032 ($MILLION)
- TABLE 14. MACHINE SENSOR MARKET FOR OTHERS, BY REGION, 2022-2032 ($MILLION)
- TABLE 15. MACHINE SENSOR MARKET, BY REGION, 2022-2032 ($MILLION)
- TABLE 16. NORTH AMERICA MACHINE SENSOR MARKET, BY TYPE, 2022-2032 ($MILLION)
- TABLE 17. NORTH AMERICA MACHINE SENSOR MARKET, BY END USE INDUSTRY, 2022-2032 ($MILLION)
- TABLE 18. NORTH AMERICA MACHINE SENSOR MARKET, BY COUNTRY, 2022-2032 ($MILLION)
- TABLE 19. U.S. MACHINE SENSOR MARKET, BY TYPE, 2022-2032 ($MILLION)
- TABLE 20. U.S. MACHINE SENSOR MARKET, BY END USE INDUSTRY, 2022-2032 ($MILLION)
- TABLE 21. CANADA MACHINE SENSOR MARKET, BY TYPE, 2022-2032 ($MILLION)
- TABLE 22. CANADA MACHINE SENSOR MARKET, BY END USE INDUSTRY, 2022-2032 ($MILLION)
- TABLE 23. MEXICO MACHINE SENSOR MARKET, BY TYPE, 2022-2032 ($MILLION)
- TABLE 24. MEXICO MACHINE SENSOR MARKET, BY END USE INDUSTRY, 2022-2032 ($MILLION)
- TABLE 25. EUROPE MACHINE SENSOR MARKET, BY TYPE, 2022-2032 ($MILLION)
- TABLE 26. EUROPE MACHINE SENSOR MARKET, BY END USE INDUSTRY, 2022-2032 ($MILLION)
- TABLE 27. EUROPE MACHINE SENSOR MARKET, BY COUNTRY, 2022-2032 ($MILLION)
- TABLE 28. UK MACHINE SENSOR MARKET, BY TYPE, 2022-2032 ($MILLION)
- TABLE 29. UK MACHINE SENSOR MARKET, BY END USE INDUSTRY, 2022-2032 ($MILLION)
- TABLE 30. GERMANY MACHINE SENSOR MARKET, BY TYPE, 2022-2032 ($MILLION)
- TABLE 31. GERMANY MACHINE SENSOR MARKET, BY END USE INDUSTRY, 2022-2032 ($MILLION)
- TABLE 32. FRANCE MACHINE SENSOR MARKET, BY TYPE, 2022-2032 ($MILLION)
- TABLE 33. FRANCE MACHINE SENSOR MARKET, BY END USE INDUSTRY, 2022-2032 ($MILLION)
- TABLE 34. REST OF EUROPE MACHINE SENSOR MARKET, BY TYPE, 2022-2032 ($MILLION)
- TABLE 35. REST OF EUROPE MACHINE SENSOR MARKET, BY END USE INDUSTRY, 2022-2032 ($MILLION)
- TABLE 36. ASIA-PACIFIC MACHINE SENSOR MARKET, BY TYPE, 2022-2032 ($MILLION)
- TABLE 37. ASIA-PACIFIC MACHINE SENSOR MARKET, BY END USE INDUSTRY, 2022-2032 ($MILLION)
- TABLE 38. ASIA-PACIFIC MACHINE SENSOR MARKET, BY COUNTRY, 2022-2032 ($MILLION)
- TABLE 39. CHINA MACHINE SENSOR MARKET, BY TYPE, 2022-2032 ($MILLION)
- TABLE 40. CHINA MACHINE SENSOR MARKET, BY END USE INDUSTRY, 2022-2032 ($MILLION)
- TABLE 41. JAPAN MACHINE SENSOR MARKET, BY TYPE, 2022-2032 ($MILLION)
- TABLE 42. JAPAN MACHINE SENSOR MARKET, BY END USE INDUSTRY, 2022-2032 ($MILLION)
- TABLE 43. INDIA MACHINE SENSOR MARKET, BY TYPE, 2022-2032 ($MILLION)
- TABLE 44. INDIA MACHINE SENSOR MARKET, BY END USE INDUSTRY, 2022-2032 ($MILLION)
- TABLE 45. SOUTH KOREA MACHINE SENSOR MARKET, BY TYPE, 2022-2032 ($MILLION)
- TABLE 46. SOUTH KOREA MACHINE SENSOR MARKET, BY END USE INDUSTRY, 2022-2032 ($MILLION)
- TABLE 47. REST OF ASIA-PACIFIC MACHINE SENSOR MARKET, BY TYPE, 2022-2032 ($MILLION)
- TABLE 48. REST OF ASIA-PACIFIC MACHINE SENSOR MARKET, BY END USE INDUSTRY, 2022-2032 ($MILLION)
- TABLE 49. LAMEA MACHINE SENSOR MARKET, BY TYPE, 2022-2032 ($MILLION)
- TABLE 50. LAMEA MACHINE SENSOR MARKET, BY END USE INDUSTRY, 2022-2032 ($MILLION)
- TABLE 51. LAMEA MACHINE SENSOR MARKET, BY COUNTRY, 2022-2032 ($MILLION)
- TABLE 52. LATIN AMERICA MACHINE SENSOR MARKET, BY TYPE, 2022-2032 ($MILLION)
- TABLE 53. LATIN AMERICA MACHINE SENSOR MARKET, BY END USE INDUSTRY, 2022-2032 ($MILLION)
- TABLE 54. MIDDLE EAST MACHINE SENSOR MARKET, BY TYPE, 2022-2032 ($MILLION)
- TABLE 55. MIDDLE EAST MACHINE SENSOR MARKET, BY END USE INDUSTRY, 2022-2032 ($MILLION)
- TABLE 56. AFRICA MACHINE SENSOR MARKET, BY TYPE, 2022-2032 ($MILLION)
- TABLE 57. AFRICA MACHINE SENSOR MARKET, BY END USE INDUSTRY, 2022-2032 ($MILLION)
- TABLE 58. KYOCERA AVX COMPONENTS (WERNE) GMBH: KEY EXECUTIVES
- TABLE 59. KYOCERA AVX COMPONENTS (WERNE) GMBH: COMPANY SNAPSHOT
- TABLE 60. KYOCERA AVX COMPONENTS (WERNE) GMBH: SERVICE SEGMENTS
- TABLE 61. KYOCERA AVX COMPONENTS (WERNE) GMBH: PRODUCT PORTFOLIO
- TABLE 62. ATI INDUSTRIAL AUTOMATION: KEY EXECUTIVES
- TABLE 63. ATI INDUSTRIAL AUTOMATION: COMPANY SNAPSHOT
- TABLE 64. ATI INDUSTRIAL AUTOMATION: PRODUCT SEGMENTS
- TABLE 65. ATI INDUSTRIAL AUTOMATION: PRODUCT PORTFOLIO
- TABLE 66. ATI INDUSTRIAL AUTOMATION: KEY STRATERGIES
- TABLE 67. BAUMER: KEY EXECUTIVES
- TABLE 68. BAUMER: COMPANY SNAPSHOT
- TABLE 69. BAUMER: SERVICE SEGMENTS
- TABLE 70. BAUMER: PRODUCT PORTFOLIO
- TABLE 71. BAUMER: KEY STRATERGIES
- TABLE 72. FUTEK ADVANCED SENSOR TECHNOLOGY, INC.: KEY EXECUTIVES
- TABLE 73. FUTEK ADVANCED SENSOR TECHNOLOGY, INC.: COMPANY SNAPSHOT
- TABLE 74. FUTEK ADVANCED SENSOR TECHNOLOGY, INC.: SERVICE SEGMENTS
- TABLE 75. FUTEK ADVANCED SENSOR TECHNOLOGY, INC.: PRODUCT PORTFOLIO
- TABLE 76. HONEYWELL INTERNATIONAL INC.,: KEY EXECUTIVES
- TABLE 77. HONEYWELL INTERNATIONAL INC.,: COMPANY SNAPSHOT
- TABLE 78. HONEYWELL INTERNATIONAL INC.,: SERVICE SEGMENTS
- TABLE 79. HONEYWELL INTERNATIONAL INC.,: PRODUCT PORTFOLIO
- TABLE 80. HONEYWELL INTERNATIONAL INC.,: KEY STRATERGIES
- TABLE 81. INFINEON TECHNOLOGIES AG: KEY EXECUTIVES
- TABLE 82. INFINEON TECHNOLOGIES AG: COMPANY SNAPSHOT
- TABLE 83. INFINEON TECHNOLOGIES AG: PRODUCT SEGMENTS
- TABLE 84. INFINEON TECHNOLOGIES AG: PRODUCT PORTFOLIO
- TABLE 85. INFINEON TECHNOLOGIES AG: KEY STRATERGIES
- TABLE 86. OMRON CORPORATION: KEY EXECUTIVES
- TABLE 87. OMRON CORPORATION: COMPANY SNAPSHOT
- TABLE 88. OMRON CORPORATION: PRODUCT SEGMENTS
- TABLE 89. OMRON CORPORATION: PRODUCT PORTFOLIO
- TABLE 90. OMRON CORPORATION: KEY STRATERGIES
- TABLE 91. SENSATA TECHNOLOGIES, INC.: KEY EXECUTIVES
- TABLE 92. SENSATA TECHNOLOGIES, INC.: COMPANY SNAPSHOT
- TABLE 93. SENSATA TECHNOLOGIES, INC.: PRODUCT SEGMENTS
- TABLE 94. SENSATA TECHNOLOGIES, INC.: PRODUCT PORTFOLIO
- TABLE 95. SENSATA TECHNOLOGIES, INC.: KEY STRATERGIES
- TABLE 96. TE CONNECTIVITY LTD.: KEY EXECUTIVES
- TABLE 97. TE CONNECTIVITY LTD.: COMPANY SNAPSHOT
- TABLE 98. TE CONNECTIVITY LTD.: SERVICE SEGMENTS
- TABLE 99. TE CONNECTIVITY LTD.: PRODUCT PORTFOLIO
- TABLE 100. TE CONNECTIVITY LTD.: KEY STRATERGIES
- TABLE 101. TEKSCAN, INC.: KEY EXECUTIVES
- TABLE 102. TEKSCAN, INC.: COMPANY SNAPSHOT
- TABLE 103. TEKSCAN, INC.: PRODUCT SEGMENTS
- TABLE 104. TEKSCAN, INC.: PRODUCT PORTFOLIO
- TABLE 105. TEKSCAN, INC.: KEY STRATERGIES
LIST OF FIGURES
- FIGURE 01. MACHINE SENSOR MARKET, 2022-2032
- FIGURE 02. SEGMENTATION OF MACHINE SENSOR MARKET, 2022-2032
- FIGURE 03. TOP INVESTMENT POCKETS IN MACHINE SENSOR MARKET (2023-2032)
- FIGURE 04. HIGH BARGAINING POWER OF SUPPLIERS
- FIGURE 05. MODERATE BARGAINING POWER OF BUYERS
- FIGURE 06. MODERATE THREAT OF SUBSTITUTES
- FIGURE 07. HIGH THREAT OF NEW ENTRANTS
- FIGURE 08. MODERATE INTENSITY OF RIVALRY
- FIGURE 09. DRIVERS, RESTRAINTS AND OPPORTUNITIES: GLOBALMACHINE SENSOR MARKET
- FIGURE 10. MACHINE SENSOR MARKET, BY TYPE, 2022(%)
- FIGURE 11. COMPARATIVE SHARE ANALYSIS OF MACHINE SENSOR MARKET FOR TEMPERATURE SENSOR, BY COUNTRY 2022 AND 2032(%)
- FIGURE 12. COMPARATIVE SHARE ANALYSIS OF MACHINE SENSOR MARKET FOR PRESSURE SENSOR, BY COUNTRY 2022 AND 2032(%)
- FIGURE 13. COMPARATIVE SHARE ANALYSIS OF MACHINE SENSOR MARKET FOR POSITION SENSOR, BY COUNTRY 2022 AND 2032(%)
- FIGURE 14. COMPARATIVE SHARE ANALYSIS OF MACHINE SENSOR MARKET FOR PROXIMITY SENSOR, BY COUNTRY 2022 AND 2032(%)
- FIGURE 15. COMPARATIVE SHARE ANALYSIS OF MACHINE SENSOR MARKET FOR FORCE AND TORQUE SENSOR, BY COUNTRY 2022 AND 2032(%)
- FIGURE 16. COMPARATIVE SHARE ANALYSIS OF MACHINE SENSOR MARKET FOR OTHERS, BY COUNTRY 2022 AND 2032(%)
- FIGURE 17. MACHINE SENSOR MARKET, BY END USE INDUSTRY, 2022(%)
- FIGURE 18. COMPARATIVE SHARE ANALYSIS OF MACHINE SENSOR MARKET FOR MANUFACTURING, BY COUNTRY 2022 AND 2032(%)
- FIGURE 19. COMPARATIVE SHARE ANALYSIS OF MACHINE SENSOR MARKET FOR OIL AND GAS, BY COUNTRY 2022 AND 2032(%)
- FIGURE 20. COMPARATIVE SHARE ANALYSIS OF MACHINE SENSOR MARKET FOR AUTOMOTIVE, BY COUNTRY 2022 AND 2032(%)
- FIGURE 21. COMPARATIVE SHARE ANALYSIS OF MACHINE SENSOR MARKET FOR AEROSPACE, BY COUNTRY 2022 AND 2032(%)
- FIGURE 22. COMPARATIVE SHARE ANALYSIS OF MACHINE SENSOR MARKET FOR HEALTHCARE, BY COUNTRY 2022 AND 2032(%)
- FIGURE 23. COMPARATIVE SHARE ANALYSIS OF MACHINE SENSOR MARKET FOR OTHERS, BY COUNTRY 2022 AND 2032(%)
- FIGURE 24. MACHINE SENSOR MARKET BY REGION, 2022
- FIGURE 25. U.S. MACHINE SENSOR MARKET, 2022-2032 ($MILLION)
- FIGURE 26. CANADA MACHINE SENSOR MARKET, 2022-2032 ($MILLION)
- FIGURE 27. MEXICO MACHINE SENSOR MARKET, 2022-2032 ($MILLION)
- FIGURE 28. UK MACHINE SENSOR MARKET, 2022-2032 ($MILLION)
- FIGURE 29. GERMANY MACHINE SENSOR MARKET, 2022-2032 ($MILLION)
- FIGURE 30. FRANCE MACHINE SENSOR MARKET, 2022-2032 ($MILLION)
- FIGURE 31. REST OF EUROPE MACHINE SENSOR MARKET, 2022-2032 ($MILLION)
- FIGURE 32. CHINA MACHINE SENSOR MARKET, 2022-2032 ($MILLION)
- FIGURE 33. JAPAN MACHINE SENSOR MARKET, 2022-2032 ($MILLION)
- FIGURE 34. INDIA MACHINE SENSOR MARKET, 2022-2032 ($MILLION)
- FIGURE 35. SOUTH KOREA MACHINE SENSOR MARKET, 2022-2032 ($MILLION)
- FIGURE 36. REST OF ASIA-PACIFIC MACHINE SENSOR MARKET, 2022-2032 ($MILLION)
- FIGURE 37. LATIN AMERICA MACHINE SENSOR MARKET, 2022-2032 ($MILLION)
- FIGURE 38. MIDDLE EAST MACHINE SENSOR MARKET, 2022-2032 ($MILLION)
- FIGURE 39. AFRICA MACHINE SENSOR MARKET, 2022-2032 ($MILLION)
- FIGURE 40. TOP WINNING STRATEGIES, BY YEAR
- FIGURE 41. TOP WINNING STRATEGIES, BY DEVELOPMENT
- FIGURE 42. TOP WINNING STRATEGIES, BY COMPANY
- FIGURE 43. PRODUCT MAPPING OF TOP 10 PLAYERS
- FIGURE 44. COMPETITIVE DASHBOARD
- FIGURE 45. COMPETITIVE HEATMAP: MACHINE SENSOR MARKET
- FIGURE 46. TOP PLAYER POSITIONING, 2022
- FIGURE 47. HONEYWELL INTERNATIONAL INC.,: NET REVENUE, 2020-2022 ($MILLION)
- FIGURE 48. HONEYWELL INTERNATIONAL INC.,: RESEARCH & DEVELOPMENT EXPENDITURE, 2020-2022 ($MILLION)
- FIGURE 49. HONEYWELL INTERNATIONAL INC.,: REVENUE SHARE BY SEGMENT, 2022 (%)
- FIGURE 50. HONEYWELL INTERNATIONAL INC.,: REVENUE SHARE BY REGION, 2022 (%)
- FIGURE 51. INFINEON TECHNOLOGIES AG: NET SALES, 2020-2022 ($MILLION)
- FIGURE 52. INFINEON TECHNOLOGIES AG: RESEARCH & DEVELOPMENT EXPENDITURE, 2020-2022 ($MILLION)
- FIGURE 53. INFINEON TECHNOLOGIES AG: REVENUE SHARE BY SEGMENT, 2022 (%)
- FIGURE 54. INFINEON TECHNOLOGIES AG: REVENUE SHARE BY REGION, 2022 (%)
- FIGURE 55. OMRON CORPORATION: NET SALES, 2019-2021 ($MILLION)
- FIGURE 56. OMRON CORPORATION: RESEARCH & DEVELOPMENT EXPENDITURE, 2019-2021 ($MILLION)
- FIGURE 57. OMRON CORPORATION: REVENUE SHARE BY SEGMENT, 2021 (%)
- FIGURE 58. OMRON CORPORATION: REVENUE SHARE BY REGION, 2020 (%)
- FIGURE 59. SENSATA TECHNOLOGIES, INC.: NET REVENUE, 2020-2022 ($MILLION)
- FIGURE 60. SENSATA TECHNOLOGIES, INC.: RESEARCH & DEVELOPMENT EXPENDITURE, 2020-2022 ($MILLION)
- FIGURE 61. SENSATA TECHNOLOGIES, INC.: REVENUE SHARE BY SEGMENT, 2022 (%)
- FIGURE 62. SENSATA TECHNOLOGIES, INC.: REVENUE SHARE BY REGION, 2022 (%)
- FIGURE 63. TE CONNECTIVITY LTD.: NET REVENUE, 2020-2022 ($MILLION)
- FIGURE 64. TE CONNECTIVITY LTD.: RESEARCH & DEVELOPMENT EXPENDITURE, 2020-2022 ($MILLION)
- FIGURE 65. TE CONNECTIVITY LTD.: REVENUE SHARE BY SEGMENT, 2021 (%)
- FIGURE 66. TE CONNECTIVITY LTD.: REVENUE SHARE BY REGION, 2021 (%)
According to a new report published by Allied Market Research, titled, "Machine Sensor Market," The machine sensor market was valued at $16.5 billion in 2022, and is estimated to reach $35.8 billion by 2032, growing at a CAGR of 8.2% from 2023 to 2032.
A machine sensor is a device or system that is used to detect and measure physical variables, such as temperature, pressure, vibration, or flow, in a machine or industrial process. Machine sensors are often used to monitor the health and performance of machines, detect anomalies or malfunctions, and optimize the performance of industrial processes.
Energy management is an area where machine sensors can be applied, as they can monitor energy consumption in machines and identify areas where energy can be saved. This helps reduce costs and improve energy efficiency in industries where energy consumption is a significant concern.
The machine sensor market is expected to continue to grow due to the increasing adoption of predictive maintenance. Predictive maintenance is a proactive maintenance strategy that relies on real-time machine data to predict when maintenance is needed, helping to prevent unexpected downtime and reduce maintenance costs. Machine sensors are essential for predictive maintenance, as they provide the real-time data needed to monitor machine performance, identify anomalies, and detect potential failures before they occur.
Technical challenges such as interference from electromagnetic fields or the need for complex signal processing algorithms pose a challenge to the machine sensor market. These challenges can make it difficult to ensure accurate and reliable sensor data. Manufacturers and suppliers of machine sensors may need to invest in research and development to overcome these technical challenges and improve the accuracy and reliability of sensor data.
Predictive maintenance is an advanced approach to maintaining industrial equipment and machinery that involves using sensor data and predictive analytics to determine the optimal time for maintenance activities. Unlike traditional maintenance schedules that rely on predetermined intervals, predictive maintenance leverages real-time data to identify potential issues and prevent equipment failures before they occur. By capturing sensor data and facilitating data communications, predictive maintenance enables continuous monitoring of equipment performance and helps predict when maintenance should be performed. This proactive approach not only minimizes downtime for manufacturing factories but also ensures the uninterrupted production of goods, leading to enhanced customer experiences and increased profitability. As a result, the demand for industrial sensors, which play a crucial role in predictive maintenance solutions, is expected to grow significantly in the near future. This presents lucrative opportunities for market players in the industrial sensors market to capitalize on this rising trend and cater to the increasing demand for predictive maintenance solutions.
The machine sensor market is segmented on the basis of type, end use industry, and region. By type, the market is divided into temperature sensor, pressure sensor, position sensor, proximity sensor, force & torque sensor, and others. By end use industry, the market is segregated into manufacturing, oil and gas, automotive, aerospace, healthcare, and others. By region, the market is analyzed across North America (U.S., Canada, and Mexico), Europe (UK, Germany, France, and rest of Europe), Asia-Pacific (China, Japan, India, South Korea, and rest of Asia-Pacific) and LAMEA (Latin America, Middle East, and Africa).
The key players profiled in the machine sensor industry include AB Elektronik Gmbh, ATI Industrial Automation, Inc., Baumer Group, FUTEK Advanced Sensor Technology, Inc., Honeywell International Inc., Infineon Technologies AG, OMRON Corporation, Sensata Technologies, Inc., TE Connectivity Ltd., and Tekscan, Inc. The competitive environment in this market is expected to increase as product launches, funding, acquisitions, agreements, collaboration, expansion, and partnership like different strategies adopted by key vendors increase.
Key Benefits For Stakeholders
- This report provides a quantitative analysis of the market segments, current trends, estimations, and dynamics of the machine sensor market analysis from 2022 to 2032 to identify the prevailing machine sensor market opportunities.
- The market research is offered along with information related to key drivers, restraints, and opportunities.
- Porter's five forces analysis highlights the potency of buyers and suppliers to enable stakeholders make profit-oriented business decisions and strengthen their supplier-buyer network.
- In-depth analysis of the machine sensor market segmentation assists to determine the prevailing market opportunities.
- Major countries in each region are mapped according to their revenue contribution to the global market.
- Market player positioning facilitates benchmarking and provides a clear understanding of the present position of the market players.
- The report includes the analysis of the regional as well as global machine sensor market trends, key players, market segments, application areas, and market growth strategies.
Key Market Segments
By Type
- Temperature Sensor
- Pressure Sensor
- Position Sensor
- Proximity Sensor
- Force and Torque Sensor
- Others
By End Use Industry
- Oil and Gas
- Automotive
- Aerospace
- Healthcare
- Others
- Manufacturing
By Region
- North America
- U.S.
- Canada
- Mexico
- Europe
- UK
- Germany
- France
- Rest of Europe
- Asia-Pacific
- China
- Japan
- India
- South Korea
- Rest of Asia-Pacific
- LAMEA
- Latin America
- Middle East
- Africa
Key Market Players:
- ATI Industrial Automation
- Baumer
- FUTEK Advanced Sensor Technology, Inc.
- Honeywell International Inc.,
- Infineon Technologies AG
- KYOCERA AVX Components (Werne) GmbH
- OMRON Corporation
- Sensata Technologies, Inc.
- TE Connectivity Ltd.
- Tekscan, Inc.
TABLE OF CONTENTS
CHAPTER 1: INTRODUCTION
- 1.1. Report description
- 1.2. Key market segments
- 1.3. Key benefits to the stakeholders
- 1.4. Research Methodology
- 1.4.1. Primary research
- 1.4.2. Secondary research
- 1.4.3. Analyst tools and models
CHAPTER 2: EXECUTIVE SUMMARY
- 2.1. CXO Perspective
CHAPTER 3: MARKET OVERVIEW
- 3.1. Market definition and scope
- 3.2. Key findings
- 3.2.1. Top impacting factors
- 3.2.2. Top investment pockets
- 3.3. Porter's five forces analysis
- 3.3.1. Bargaining power of suppliers
- 3.3.2. Bargaining power of buyers
- 3.3.3. Threat of substitutes
- 3.3.4. Threat of new entrants
- 3.3.5. Intensity of rivalry
- 3.4. Market dynamics
- 3.4.1. Drivers
- 3.4.1.1. Automation and digitization driving the machine sensor market growth.
- 3.4.1.2. Growing focus on energy efficiency and sustainability driving the machine sensor market.
- 3.4.1. Drivers
- 3.4.2. Restraints
- 3.4.2.1. High cost of machine sensors is a barrier for smaller businesses and price-sensitive industries.
- 3.4.3. Opportunities
- 3.4.3.1. Smart sensors fueling machine sensor market growth.
- 3.5. COVID-19 Impact Analysis on the market
CHAPTER 4: MACHINE SENSOR MARKET, BY TYPE
- 4.1. Overview
- 4.1.1. Market size and forecast
- 4.2. Temperature Sensor
- 4.2.1. Key market trends, growth factors and opportunities
- 4.2.2. Market size and forecast, by region
- 4.2.3. Market share analysis by country
- 4.3. Pressure Sensor
- 4.3.1. Key market trends, growth factors and opportunities
- 4.3.2. Market size and forecast, by region
- 4.3.3. Market share analysis by country
- 4.4. Position Sensor
- 4.4.1. Key market trends, growth factors and opportunities
- 4.4.2. Market size and forecast, by region
- 4.4.3. Market share analysis by country
- 4.5. Proximity Sensor
- 4.5.1. Key market trends, growth factors and opportunities
- 4.5.2. Market size and forecast, by region
- 4.5.3. Market share analysis by country
- 4.6. Force and Torque Sensor
- 4.6.1. Key market trends, growth factors and opportunities
- 4.6.2. Market size and forecast, by region
- 4.6.3. Market share analysis by country
- 4.7. Others
- 4.7.1. Key market trends, growth factors and opportunities
- 4.7.2. Market size and forecast, by region
- 4.7.3. Market share analysis by country
CHAPTER 5: MACHINE SENSOR MARKET, BY END USE INDUSTRY
- 5.1. Overview
- 5.1.1. Market size and forecast
- 5.2. Manufacturing
- 5.2.1. Key market trends, growth factors and opportunities
- 5.2.2. Market size and forecast, by region
- 5.2.3. Market share analysis by country
- 5.3. Oil and Gas
- 5.3.1. Key market trends, growth factors and opportunities
- 5.3.2. Market size and forecast, by region
- 5.3.3. Market share analysis by country
- 5.4. Automotive
- 5.4.1. Key market trends, growth factors and opportunities
- 5.4.2. Market size and forecast, by region
- 5.4.3. Market share analysis by country
- 5.5. Aerospace
- 5.5.1. Key market trends, growth factors and opportunities
- 5.5.2. Market size and forecast, by region
- 5.5.3. Market share analysis by country
- 5.6. Healthcare
- 5.6.1. Key market trends, growth factors and opportunities
- 5.6.2. Market size and forecast, by region
- 5.6.3. Market share analysis by country
- 5.7. Others
- 5.7.1. Key market trends, growth factors and opportunities
- 5.7.2. Market size and forecast, by region
- 5.7.3. Market share analysis by country
CHAPTER 6: MACHINE SENSOR MARKET, BY REGION
- 6.1. Overview
- 6.1.1. Market size and forecast By Region
- 6.2. North America
- 6.2.1. Key trends and opportunities
- 6.2.2. Market size and forecast, by Type
- 6.2.3. Market size and forecast, by End Use Industry
- 6.2.4. Market size and forecast, by country
- 6.2.4.1. U.S.
- 6.2.4.1.1. Key market trends, growth factors and opportunities
- 6.2.4.1.2. Market size and forecast, by Type
- 6.2.4.1.3. Market size and forecast, by End Use Industry
- 6.2.4.2. Canada
- 6.2.4.2.1. Key market trends, growth factors and opportunities
- 6.2.4.2.2. Market size and forecast, by Type
- 6.2.4.2.3. Market size and forecast, by End Use Industry
- 6.2.4.3. Mexico
- 6.2.4.3.1. Key market trends, growth factors and opportunities
- 6.2.4.3.2. Market size and forecast, by Type
- 6.2.4.3.3. Market size and forecast, by End Use Industry
- 6.3. Europe
- 6.3.1. Key trends and opportunities
- 6.3.2. Market size and forecast, by Type
- 6.3.3. Market size and forecast, by End Use Industry
- 6.3.4. Market size and forecast, by country
- 6.3.4.1. UK
- 6.3.4.1.1. Key market trends, growth factors and opportunities
- 6.3.4.1.2. Market size and forecast, by Type
- 6.3.4.1.3. Market size and forecast, by End Use Industry
- 6.3.4.2. Germany
- 6.3.4.2.1. Key market trends, growth factors and opportunities
- 6.3.4.2.2. Market size and forecast, by Type
- 6.3.4.2.3. Market size and forecast, by End Use Industry
- 6.3.4.3. France
- 6.3.4.3.1. Key market trends, growth factors and opportunities
- 6.3.4.3.2. Market size and forecast, by Type
- 6.3.4.3.3. Market size and forecast, by End Use Industry
- 6.3.4.4. Rest of Europe
- 6.3.4.4.1. Key market trends, growth factors and opportunities
- 6.3.4.4.2. Market size and forecast, by Type
- 6.3.4.4.3. Market size and forecast, by End Use Industry
- 6.4. Asia-Pacific
- 6.4.1. Key trends and opportunities
- 6.4.2. Market size and forecast, by Type
- 6.4.3. Market size and forecast, by End Use Industry
- 6.4.4. Market size and forecast, by country
- 6.4.4.1. China
- 6.4.4.1.1. Key market trends, growth factors and opportunities
- 6.4.4.1.2. Market size and forecast, by Type
- 6.4.4.1.3. Market size and forecast, by End Use Industry
- 6.4.4.2. Japan
- 6.4.4.2.1. Key market trends, growth factors and opportunities
- 6.4.4.2.2. Market size and forecast, by Type
- 6.4.4.2.3. Market size and forecast, by End Use Industry
- 6.4.4.3. India
- 6.4.4.3.1. Key market trends, growth factors and opportunities
- 6.4.4.3.2. Market size and forecast, by Type
- 6.4.4.3.3. Market size and forecast, by End Use Industry
- 6.4.4.4. South Korea
- 6.4.4.4.1. Key market trends, growth factors and opportunities
- 6.4.4.4.2. Market size and forecast, by Type
- 6.4.4.4.3. Market size and forecast, by End Use Industry
- 6.4.4.5. Rest of Asia-Pacific
- 6.4.4.5.1. Key market trends, growth factors and opportunities
- 6.4.4.5.2. Market size and forecast, by Type
- 6.4.4.5.3. Market size and forecast, by End Use Industry
- 6.5. LAMEA
- 6.5.1. Key trends and opportunities
- 6.5.2. Market size and forecast, by Type
- 6.5.3. Market size and forecast, by End Use Industry
- 6.5.4. Market size and forecast, by country
- 6.5.4.1. Latin America
- 6.5.4.1.1. Key market trends, growth factors and opportunities
- 6.5.4.1.2. Market size and forecast, by Type
- 6.5.4.1.3. Market size and forecast, by End Use Industry
- 6.5.4.2. Middle East
- 6.5.4.2.1. Key market trends, growth factors and opportunities
- 6.5.4.2.2. Market size and forecast, by Type
- 6.5.4.2.3. Market size and forecast, by End Use Industry
- 6.5.4.3. Africa
- 6.5.4.3.1. Key market trends, growth factors and opportunities
- 6.5.4.3.2. Market size and forecast, by Type
- 6.5.4.3.3. Market size and forecast, by End Use Industry
CHAPTER 7: COMPETITIVE LANDSCAPE
- 7.1. Introduction
- 7.2. Top winning strategies
- 7.3. Product Mapping of Top 10 Player
- 7.4. Competitive Dashboard
- 7.5. Competitive Heatmap
- 7.6. Top player positioning, 2022
CHAPTER 8: COMPANY PROFILES
- 8.1. KYOCERA AVX Components (Werne) GmbH
- 8.1.1. Company overview
- 8.1.2. Key Executives
- 8.1.3. Company snapshot
- 8.1.4. Operating business segments
- 8.1.5. Product portfolio
- 8.2. ATI Industrial Automation
- 8.2.1. Company overview
- 8.2.2. Key Executives
- 8.2.3. Company snapshot
- 8.2.4. Operating business segments
- 8.2.5. Product portfolio
- 8.2.6. Key strategic moves and developments
- 8.3. Baumer
- 8.3.1. Company overview
- 8.3.2. Key Executives
- 8.3.3. Company snapshot
- 8.3.4. Operating business segments
- 8.3.5. Product portfolio
- 8.3.6. Key strategic moves and developments
- 8.4. FUTEK Advanced Sensor Technology, Inc.
- 8.4.1. Company overview
- 8.4.2. Key Executives
- 8.4.3. Company snapshot
- 8.4.4. Operating business segments
- 8.4.5. Product portfolio
- 8.5. Honeywell International Inc.,
- 8.5.1. Company overview
- 8.5.2. Key Executives
- 8.5.3. Company snapshot
- 8.5.4. Operating business segments
- 8.5.5. Product portfolio
- 8.5.6. Business performance
- 8.5.7. Key strategic moves and developments
- 8.6. Infineon Technologies AG
- 8.6.1. Company overview
- 8.6.2. Key Executives
- 8.6.3. Company snapshot
- 8.6.4. Operating business segments
- 8.6.5. Product portfolio
- 8.6.6. Business performance
- 8.6.7. Key strategic moves and developments
- 8.7. OMRON Corporation
- 8.7.1. Company overview
- 8.7.2. Key Executives
- 8.7.3. Company snapshot
- 8.7.4. Operating business segments
- 8.7.5. Product portfolio
- 8.7.6. Business performance
- 8.7.7. Key strategic moves and developments
- 8.8. Sensata Technologies, Inc.
- 8.8.1. Company overview
- 8.8.2. Key Executives
- 8.8.3. Company snapshot
- 8.8.4. Operating business segments
- 8.8.5. Product portfolio
- 8.8.6. Business performance
- 8.8.7. Key strategic moves and developments
- 8.9. TE Connectivity Ltd.
- 8.9.1. Company overview
- 8.9.2. Key Executives
- 8.9.3. Company snapshot
- 8.9.4. Operating business segments
- 8.9.5. Product portfolio
- 8.9.6. Business performance
- 8.9.7. Key strategic moves and developments
- 8.10. Tekscan, Inc.
- 8.10.1. Company overview
- 8.10.2. Key Executives
- 8.10.3. Company snapshot
- 8.10.4. Operating business segments
- 8.10.5. Product portfolio
- 8.10.6. Key strategic moves and developments