
|
市場調査レポート
商品コード
1344386
ペニシリン系抗菌薬市場:由来別、投与経路別、抗菌スペクトル別、流通チャネル別:世界の機会分析と産業予測、2023-2032年Penicillin Drug Market By Source, By Route of Administration, By Spectrum of Activity, By Distribution Channel : Global Opportunity Analysis and Industry Forecast, 2023-2032 |
||||||
|
|||||||

| ペニシリン系抗菌薬市場:由来別、投与経路別、抗菌スペクトル別、流通チャネル別:世界の機会分析と産業予測、2023-2032年 |
|
出版日: 2023年06月01日
発行: Allied Market Research
ページ情報: 英文 313 Pages
納期: 2~3営業日
|

- 全表示
- 概要
- 図表
- 目次
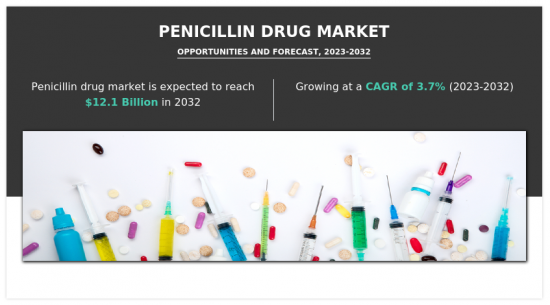
ペニシリン系抗菌薬市場は、製薬部門からの市場需要の増加により、2023年から2032年にかけて3.7%の大幅な成長率を記録する可能性があります。
COVID-19パンデミックは、効果的な感染対策と適切な抗生物質治療の必要性の重要性を高めたため、市場にわずかながらプラスの影響を与えました。さらに、パンデミックの間、呼吸器感染症に対する意識が高まり、ペニシリン系抗菌薬の需要が急増し、市場成長に貢献しました。
目次
第1章 イントロダクション
第2章 エグゼクティブサマリー
第3章 市場概要
- 市場の定義と範囲
- 主な調査結果
- 影響要因
- 主な投資機会
- ポーターのファイブフォース分析
- 供給企業の交渉力
- 買い手の交渉力
- 代替品の脅威
- 新規参入業者の脅威
- 競合の激しさ
- 市場力学
- 促進要因
- 併用療法に対する認識と採用の急増
- 細菌感染症の増加
- ジェネリック医薬品の入手可能性
- 抑制要因
- ペニシリンに伴う副作用
- 抗菌薬に対する耐性菌の増加
- 機会
- 研究開発活動への投資の増加
- 促進要因
- COVID-19:市場への影響分析
第4章 ペニシリン系抗菌薬市場:由来別
- 概要
- 天然
- 半合成
第5章 ペニシリン系抗菌薬市場:投与経路別
- 概要
- 経口
- 非経口
第6章 ペニシリン系抗菌薬市場:抗菌スペクトル別
- 概要
- 狭域
- 広域
- 拡張
第7章 ペニシリン系抗菌薬市場:流通チャネル別
- 概要
- 病院薬局
- ドラッグストア・小売薬局
- オンラインプロバイダー
第8章 ペニシリン系抗菌薬市場:地域別
- 概要
- 北米
- 米国
- カナダ
- メキシコ
- 欧州
- ドイツ
- フランス
- 英国
- イタリア
- スペイン
- その他欧州
- アジア太平洋
- 日本
- 中国
- インド
- オーストラリア
- 韓国
- その他アジア太平洋地域
- ラテンアメリカ・中東・アフリカ
- ブラジル
- サウジアラビア
- 南アフリカ
- その他ラテンアメリカ・中東・アフリカ
第9章 競合情勢
- イントロダクション
- 主要成功戦略
- 主要10企業の製品マッピング
- 競合ダッシュボード
- 競合ヒートマップ
- 主要企業のポジショニング、2022年
第10章 企業プロファイル
- GlaxoSmithKline plc
- Pfizer Inc.
- Novartis AG
- Lupin
- Abbott Laboratories
- Cipla Ltd
- Takeda Pharmaceutical Company Ltd
- Alkem Laboratories Ltd.
- Teva Pharmaceutical Industries Limited
- SUN PHARMACEUTICAL INDUSTRIES LIMITED
LIST OF TABLES
- TABLE 01. GLOBAL PENICILLIN DRUG MARKET, BY SOURCE, 2022-2032 ($MILLION)
- TABLE 02. PENICILLIN DRUG MARKET FOR NATURAL PENICILLIN, BY REGION, 2022-2032 ($MILLION)
- TABLE 03. PENICILLIN DRUG MARKET FOR SEMISYNTHETIC PENICILLIN, BY REGION, 2022-2032 ($MILLION)
- TABLE 04. GLOBAL SEMISYNTHETIC PENICILLIN PENICILLIN DRUG MARKET, BY CLASS, 2022-2032 ($MILLION)
- TABLE 05. GLOBAL PENICILLIN DRUG MARKET, BY ROUTE OF ADMINISTRATION, 2022-2032 ($MILLION)
- TABLE 06. PENICILLIN DRUG MARKET FOR ORAL, BY REGION, 2022-2032 ($MILLION)
- TABLE 07. PENICILLIN DRUG MARKET FOR PARENTERAL, BY REGION, 2022-2032 ($MILLION)
- TABLE 08. GLOBAL PENICILLIN DRUG MARKET, BY SPECTRUM OF ACTIVITY, 2022-2032 ($MILLION)
- TABLE 09. PENICILLIN DRUG MARKET FOR NARROW SPECTRUM PENICILLIN, BY REGION, 2022-2032 ($MILLION)
- TABLE 10. PENICILLIN DRUG MARKET FOR BROAD SPECTRUM PENICILLIN, BY REGION, 2022-2032 ($MILLION)
- TABLE 11. PENICILLIN DRUG MARKET FOR EXTENDED SPECTRUM PENICILLIN, BY REGION, 2022-2032 ($MILLION)
- TABLE 12. GLOBAL PENICILLIN DRUG MARKET, BY DISTRIBUTION CHANNEL, 2022-2032 ($MILLION)
- TABLE 13. PENICILLIN DRUG MARKET FOR HOSPITAL PHARMACIES, BY REGION, 2022-2032 ($MILLION)
- TABLE 14. PENICILLIN DRUG MARKET FOR DRUG STORES AND RETAIL PHARMACIES, BY REGION, 2022-2032 ($MILLION)
- TABLE 15. PENICILLIN DRUG MARKET FOR ONLINE PROVIDERS, BY REGION, 2022-2032 ($MILLION)
- TABLE 16. PENICILLIN DRUG MARKET, BY REGION, 2022-2032 ($MILLION)
- TABLE 17. NORTH AMERICA PENICILLIN DRUG MARKET, BY SOURCE, 2022-2032 ($MILLION)
- TABLE 18. NORTH AMERICA PENICILLIN DRUG MARKET, BY ROUTE OF ADMINISTRATION, 2022-2032 ($MILLION)
- TABLE 19. NORTH AMERICA PENICILLIN DRUG MARKET, BY SPECTRUM OF ACTIVITY, 2022-2032 ($MILLION)
- TABLE 20. NORTH AMERICA PENICILLIN DRUG MARKET, BY DISTRIBUTION CHANNEL, 2022-2032 ($MILLION)
- TABLE 21. NORTH AMERICA PENICILLIN DRUG MARKET, BY COUNTRY, 2022-2032 ($MILLION)
- TABLE 22. U.S. PENICILLIN DRUG MARKET, BY SOURCE, 2022-2032 ($MILLION)
- TABLE 23. U.S. PENICILLIN DRUG MARKET, BY ROUTE OF ADMINISTRATION, 2022-2032 ($MILLION)
- TABLE 24. U.S. PENICILLIN DRUG MARKET, BY SPECTRUM OF ACTIVITY, 2022-2032 ($MILLION)
- TABLE 25. U.S. PENICILLIN DRUG MARKET, BY DISTRIBUTION CHANNEL, 2022-2032 ($MILLION)
- TABLE 26. CANADA PENICILLIN DRUG MARKET, BY SOURCE, 2022-2032 ($MILLION)
- TABLE 27. CANADA PENICILLIN DRUG MARKET, BY ROUTE OF ADMINISTRATION, 2022-2032 ($MILLION)
- TABLE 28. CANADA PENICILLIN DRUG MARKET, BY SPECTRUM OF ACTIVITY, 2022-2032 ($MILLION)
- TABLE 29. CANADA PENICILLIN DRUG MARKET, BY DISTRIBUTION CHANNEL, 2022-2032 ($MILLION)
- TABLE 30. MEXICO PENICILLIN DRUG MARKET, BY SOURCE, 2022-2032 ($MILLION)
- TABLE 31. MEXICO PENICILLIN DRUG MARKET, BY ROUTE OF ADMINISTRATION, 2022-2032 ($MILLION)
- TABLE 32. MEXICO PENICILLIN DRUG MARKET, BY SPECTRUM OF ACTIVITY, 2022-2032 ($MILLION)
- TABLE 33. MEXICO PENICILLIN DRUG MARKET, BY DISTRIBUTION CHANNEL, 2022-2032 ($MILLION)
- TABLE 34. EUROPE PENICILLIN DRUG MARKET, BY SOURCE, 2022-2032 ($MILLION)
- TABLE 35. EUROPE PENICILLIN DRUG MARKET, BY ROUTE OF ADMINISTRATION, 2022-2032 ($MILLION)
- TABLE 36. EUROPE PENICILLIN DRUG MARKET, BY SPECTRUM OF ACTIVITY, 2022-2032 ($MILLION)
- TABLE 37. EUROPE PENICILLIN DRUG MARKET, BY DISTRIBUTION CHANNEL, 2022-2032 ($MILLION)
- TABLE 38. EUROPE PENICILLIN DRUG MARKET, BY COUNTRY, 2022-2032 ($MILLION)
- TABLE 39. GERMANY PENICILLIN DRUG MARKET, BY SOURCE, 2022-2032 ($MILLION)
- TABLE 40. GERMANY PENICILLIN DRUG MARKET, BY ROUTE OF ADMINISTRATION, 2022-2032 ($MILLION)
- TABLE 41. GERMANY PENICILLIN DRUG MARKET, BY SPECTRUM OF ACTIVITY, 2022-2032 ($MILLION)
- TABLE 42. GERMANY PENICILLIN DRUG MARKET, BY DISTRIBUTION CHANNEL, 2022-2032 ($MILLION)
- TABLE 43. FRANCE PENICILLIN DRUG MARKET, BY SOURCE, 2022-2032 ($MILLION)
- TABLE 44. FRANCE PENICILLIN DRUG MARKET, BY ROUTE OF ADMINISTRATION, 2022-2032 ($MILLION)
- TABLE 45. FRANCE PENICILLIN DRUG MARKET, BY SPECTRUM OF ACTIVITY, 2022-2032 ($MILLION)
- TABLE 46. FRANCE PENICILLIN DRUG MARKET, BY DISTRIBUTION CHANNEL, 2022-2032 ($MILLION)
- TABLE 47. UK PENICILLIN DRUG MARKET, BY SOURCE, 2022-2032 ($MILLION)
- TABLE 48. UK PENICILLIN DRUG MARKET, BY ROUTE OF ADMINISTRATION, 2022-2032 ($MILLION)
- TABLE 49. UK PENICILLIN DRUG MARKET, BY SPECTRUM OF ACTIVITY, 2022-2032 ($MILLION)
- TABLE 50. UK PENICILLIN DRUG MARKET, BY DISTRIBUTION CHANNEL, 2022-2032 ($MILLION)
- TABLE 51. ITALY PENICILLIN DRUG MARKET, BY SOURCE, 2022-2032 ($MILLION)
- TABLE 52. ITALY PENICILLIN DRUG MARKET, BY ROUTE OF ADMINISTRATION, 2022-2032 ($MILLION)
- TABLE 53. ITALY PENICILLIN DRUG MARKET, BY SPECTRUM OF ACTIVITY, 2022-2032 ($MILLION)
- TABLE 54. ITALY PENICILLIN DRUG MARKET, BY DISTRIBUTION CHANNEL, 2022-2032 ($MILLION)
- TABLE 55. SPAIN PENICILLIN DRUG MARKET, BY SOURCE, 2022-2032 ($MILLION)
- TABLE 56. SPAIN PENICILLIN DRUG MARKET, BY ROUTE OF ADMINISTRATION, 2022-2032 ($MILLION)
- TABLE 57. SPAIN PENICILLIN DRUG MARKET, BY SPECTRUM OF ACTIVITY, 2022-2032 ($MILLION)
- TABLE 58. SPAIN PENICILLIN DRUG MARKET, BY DISTRIBUTION CHANNEL, 2022-2032 ($MILLION)
- TABLE 59. REST OF EUROPE PENICILLIN DRUG MARKET, BY SOURCE, 2022-2032 ($MILLION)
- TABLE 60. REST OF EUROPE PENICILLIN DRUG MARKET, BY ROUTE OF ADMINISTRATION, 2022-2032 ($MILLION)
- TABLE 61. REST OF EUROPE PENICILLIN DRUG MARKET, BY SPECTRUM OF ACTIVITY, 2022-2032 ($MILLION)
- TABLE 62. REST OF EUROPE PENICILLIN DRUG MARKET, BY DISTRIBUTION CHANNEL, 2022-2032 ($MILLION)
- TABLE 63. ASIA-PACIFIC PENICILLIN DRUG MARKET, BY SOURCE, 2022-2032 ($MILLION)
- TABLE 64. ASIA-PACIFIC PENICILLIN DRUG MARKET, BY ROUTE OF ADMINISTRATION, 2022-2032 ($MILLION)
- TABLE 65. ASIA-PACIFIC PENICILLIN DRUG MARKET, BY SPECTRUM OF ACTIVITY, 2022-2032 ($MILLION)
- TABLE 66. ASIA-PACIFIC PENICILLIN DRUG MARKET, BY DISTRIBUTION CHANNEL, 2022-2032 ($MILLION)
- TABLE 67. ASIA-PACIFIC PENICILLIN DRUG MARKET, BY COUNTRY, 2022-2032 ($MILLION)
- TABLE 68. JAPAN PENICILLIN DRUG MARKET, BY SOURCE, 2022-2032 ($MILLION)
- TABLE 69. JAPAN PENICILLIN DRUG MARKET, BY ROUTE OF ADMINISTRATION, 2022-2032 ($MILLION)
- TABLE 70. JAPAN PENICILLIN DRUG MARKET, BY SPECTRUM OF ACTIVITY, 2022-2032 ($MILLION)
- TABLE 71. JAPAN PENICILLIN DRUG MARKET, BY DISTRIBUTION CHANNEL, 2022-2032 ($MILLION)
- TABLE 72. CHINA PENICILLIN DRUG MARKET, BY SOURCE, 2022-2032 ($MILLION)
- TABLE 73. CHINA PENICILLIN DRUG MARKET, BY ROUTE OF ADMINISTRATION, 2022-2032 ($MILLION)
- TABLE 74. CHINA PENICILLIN DRUG MARKET, BY SPECTRUM OF ACTIVITY, 2022-2032 ($MILLION)
- TABLE 75. CHINA PENICILLIN DRUG MARKET, BY DISTRIBUTION CHANNEL, 2022-2032 ($MILLION)
- TABLE 76. INDIA PENICILLIN DRUG MARKET, BY SOURCE, 2022-2032 ($MILLION)
- TABLE 77. INDIA PENICILLIN DRUG MARKET, BY ROUTE OF ADMINISTRATION, 2022-2032 ($MILLION)
- TABLE 78. INDIA PENICILLIN DRUG MARKET, BY SPECTRUM OF ACTIVITY, 2022-2032 ($MILLION)
- TABLE 79. INDIA PENICILLIN DRUG MARKET, BY DISTRIBUTION CHANNEL, 2022-2032 ($MILLION)
- TABLE 80. AUSTRALIA PENICILLIN DRUG MARKET, BY SOURCE, 2022-2032 ($MILLION)
- TABLE 81. AUSTRALIA PENICILLIN DRUG MARKET, BY ROUTE OF ADMINISTRATION, 2022-2032 ($MILLION)
- TABLE 82. AUSTRALIA PENICILLIN DRUG MARKET, BY SPECTRUM OF ACTIVITY, 2022-2032 ($MILLION)
- TABLE 83. AUSTRALIA PENICILLIN DRUG MARKET, BY DISTRIBUTION CHANNEL, 2022-2032 ($MILLION)
- TABLE 84. SOUTH KOREA PENICILLIN DRUG MARKET, BY SOURCE, 2022-2032 ($MILLION)
- TABLE 85. SOUTH KOREA PENICILLIN DRUG MARKET, BY ROUTE OF ADMINISTRATION, 2022-2032 ($MILLION)
- TABLE 86. SOUTH KOREA PENICILLIN DRUG MARKET, BY SPECTRUM OF ACTIVITY, 2022-2032 ($MILLION)
- TABLE 87. SOUTH KOREA PENICILLIN DRUG MARKET, BY DISTRIBUTION CHANNEL, 2022-2032 ($MILLION)
- TABLE 88. REST OF ASIA-PACIFIC PENICILLIN DRUG MARKET, BY SOURCE, 2022-2032 ($MILLION)
- TABLE 89. REST OF ASIA-PACIFIC PENICILLIN DRUG MARKET, BY ROUTE OF ADMINISTRATION, 2022-2032 ($MILLION)
- TABLE 90. REST OF ASIA-PACIFIC PENICILLIN DRUG MARKET, BY SPECTRUM OF ACTIVITY, 2022-2032 ($MILLION)
- TABLE 91. REST OF ASIA-PACIFIC PENICILLIN DRUG MARKET, BY DISTRIBUTION CHANNEL, 2022-2032 ($MILLION)
- TABLE 92. LAMEA PENICILLIN DRUG MARKET, BY SOURCE, 2022-2032 ($MILLION)
- TABLE 93. LAMEA PENICILLIN DRUG MARKET, BY ROUTE OF ADMINISTRATION, 2022-2032 ($MILLION)
- TABLE 94. LAMEA PENICILLIN DRUG MARKET, BY SPECTRUM OF ACTIVITY, 2022-2032 ($MILLION)
- TABLE 95. LAMEA PENICILLIN DRUG MARKET, BY DISTRIBUTION CHANNEL, 2022-2032 ($MILLION)
- TABLE 96. LAMEA PENICILLIN DRUG MARKET, BY COUNTRY, 2022-2032 ($MILLION)
- TABLE 97. BRAZIL PENICILLIN DRUG MARKET, BY SOURCE, 2022-2032 ($MILLION)
- TABLE 98. BRAZIL PENICILLIN DRUG MARKET, BY ROUTE OF ADMINISTRATION, 2022-2032 ($MILLION)
- TABLE 99. BRAZIL PENICILLIN DRUG MARKET, BY SPECTRUM OF ACTIVITY, 2022-2032 ($MILLION)
- TABLE 100. BRAZIL PENICILLIN DRUG MARKET, BY DISTRIBUTION CHANNEL, 2022-2032 ($MILLION)
- TABLE 101. SAUDI ARABIA PENICILLIN DRUG MARKET, BY SOURCE, 2022-2032 ($MILLION)
- TABLE 102. SAUDI ARABIA PENICILLIN DRUG MARKET, BY ROUTE OF ADMINISTRATION, 2022-2032 ($MILLION)
- TABLE 103. SAUDI ARABIA PENICILLIN DRUG MARKET, BY SPECTRUM OF ACTIVITY, 2022-2032 ($MILLION)
- TABLE 104. SAUDI ARABIA PENICILLIN DRUG MARKET, BY DISTRIBUTION CHANNEL, 2022-2032 ($MILLION)
- TABLE 105. SOUTH AFRICA PENICILLIN DRUG MARKET, BY SOURCE, 2022-2032 ($MILLION)
- TABLE 106. SOUTH AFRICA PENICILLIN DRUG MARKET, BY ROUTE OF ADMINISTRATION, 2022-2032 ($MILLION)
- TABLE 107. SOUTH AFRICA PENICILLIN DRUG MARKET, BY SPECTRUM OF ACTIVITY, 2022-2032 ($MILLION)
- TABLE 108. SOUTH AFRICA PENICILLIN DRUG MARKET, BY DISTRIBUTION CHANNEL, 2022-2032 ($MILLION)
- TABLE 109. REST OF LAMEA PENICILLIN DRUG MARKET, BY SOURCE, 2022-2032 ($MILLION)
- TABLE 110. REST OF LAMEA PENICILLIN DRUG MARKET, BY ROUTE OF ADMINISTRATION, 2022-2032 ($MILLION)
- TABLE 111. REST OF LAMEA PENICILLIN DRUG MARKET, BY SPECTRUM OF ACTIVITY, 2022-2032 ($MILLION)
- TABLE 112. REST OF LAMEA PENICILLIN DRUG MARKET, BY DISTRIBUTION CHANNEL, 2022-2032 ($MILLION)
- TABLE 113. GLAXOSMITHKLINE PLC: KEY EXECUTIVES
- TABLE 114. GLAXOSMITHKLINE PLC: COMPANY SNAPSHOT
- TABLE 115. GLAXOSMITHKLINE PLC: PRODUCT SEGMENTS
- TABLE 116. GLAXOSMITHKLINE PLC: PRODUCT PORTFOLIO
- TABLE 117. GLAXOSMITHKLINE PLC: KEY STRATERGIES
- TABLE 118. PFIZER INC.: KEY EXECUTIVES
- TABLE 119. PFIZER INC.: COMPANY SNAPSHOT
- TABLE 120. PFIZER INC.: PRODUCT SEGMENTS
- TABLE 121. PFIZER INC.: PRODUCT PORTFOLIO
- TABLE 122. NOVARTIS AG: KEY EXECUTIVES
- TABLE 123. NOVARTIS AG: COMPANY SNAPSHOT
- TABLE 124. NOVARTIS AG: PRODUCT SEGMENTS
- TABLE 125. NOVARTIS AG: PRODUCT PORTFOLIO
- TABLE 126. NOVARTIS AG: KEY STRATERGIES
- TABLE 127. LUPIN: KEY EXECUTIVES
- TABLE 128. LUPIN: COMPANY SNAPSHOT
- TABLE 129. LUPIN: PRODUCT SEGMENTS
- TABLE 130. LUPIN: PRODUCT PORTFOLIO
- TABLE 131. ABBOTT LABORATORIES: KEY EXECUTIVES
- TABLE 132. ABBOTT LABORATORIES: COMPANY SNAPSHOT
- TABLE 133. ABBOTT LABORATORIES: PRODUCT SEGMENTS
- TABLE 134. ABBOTT LABORATORIES: PRODUCT PORTFOLIO
- TABLE 135. CIPLA LTD: KEY EXECUTIVES
- TABLE 136. CIPLA LTD: COMPANY SNAPSHOT
- TABLE 137. CIPLA LTD: PRODUCT SEGMENTS
- TABLE 138. CIPLA LTD: PRODUCT PORTFOLIO
- TABLE 139. TAKEDA PHARMACEUTICAL COMPANY LTD: KEY EXECUTIVES
- TABLE 140. TAKEDA PHARMACEUTICAL COMPANY LTD: COMPANY SNAPSHOT
- TABLE 141. TAKEDA PHARMACEUTICAL COMPANY LTD: PRODUCT SEGMENTS
- TABLE 142. TAKEDA PHARMACEUTICAL COMPANY LTD: PRODUCT PORTFOLIO
- TABLE 143. ALKEM LABORATORIES LTD.: KEY EXECUTIVES
- TABLE 144. ALKEM LABORATORIES LTD.: COMPANY SNAPSHOT
- TABLE 145. ALKEM LABORATORIES LTD.: PRODUCT SEGMENTS
- TABLE 146. ALKEM LABORATORIES LTD.: PRODUCT PORTFOLIO
- TABLE 147. TEVA PHARMACEUTICAL INDUSTRIES LIMITED: KEY EXECUTIVES
- TABLE 148. TEVA PHARMACEUTICAL INDUSTRIES LIMITED: COMPANY SNAPSHOT
- TABLE 149. TEVA PHARMACEUTICAL INDUSTRIES LIMITED: PRODUCT SEGMENTS
- TABLE 150. TEVA PHARMACEUTICAL INDUSTRIES LIMITED: PRODUCT PORTFOLIO
- TABLE 151. SUN PHARMACEUTICAL INDUSTRIES LIMITED: KEY EXECUTIVES
- TABLE 152. SUN PHARMACEUTICAL INDUSTRIES LIMITED: COMPANY SNAPSHOT
- TABLE 153. SUN PHARMACEUTICAL INDUSTRIES LIMITED: PRODUCT SEGMENTS
- TABLE 154. SUN PHARMACEUTICAL INDUSTRIES LIMITED: PRODUCT PORTFOLIO
LIST OF FIGURES
- FIGURE 01. PENICILLIN DRUG MARKET, 2022-2032
- FIGURE 02. SEGMENTATION OF PENICILLIN DRUG MARKET, 2022-2032
- FIGURE 03. TOP INVESTMENT POCKETS IN PENICILLIN DRUG MARKET (2023-2032)
- FIGURE 04. LOW BARGAINING POWER OF SUPPLIERS
- FIGURE 05. LOW BARGAINING POWER OF BUYERS
- FIGURE 06. LOW THREAT OF SUBSTITUTES
- FIGURE 07. LOW THREAT OF NEW ENTRANTS
- FIGURE 08. LOW INTENSITY OF RIVALRY
- FIGURE 09. DRIVERS, RESTRAINTS AND OPPORTUNITIES: GLOBALPENICILLIN DRUG MARKET
- FIGURE 09. PENICILLIN DRUG MARKET, BY SOURCE, 2022(%)
- FIGURE 10. COMPARATIVE SHARE ANALYSIS OF PENICILLIN DRUG MARKET FOR NATURAL PENICILLIN, BY COUNTRY 2022 AND 2032(%)
- FIGURE 11. COMPARATIVE SHARE ANALYSIS OF PENICILLIN DRUG MARKET FOR SEMISYNTHETIC PENICILLIN, BY COUNTRY 2022 AND 2032(%)
- FIGURE 12. PENICILLIN DRUG MARKET, BY ROUTE OF ADMINISTRATION, 2022(%)
- FIGURE 13. COMPARATIVE SHARE ANALYSIS OF PENICILLIN DRUG MARKET FOR ORAL, BY COUNTRY 2022 AND 2032(%)
- FIGURE 14. COMPARATIVE SHARE ANALYSIS OF PENICILLIN DRUG MARKET FOR PARENTERAL, BY COUNTRY 2022 AND 2032(%)
- FIGURE 15. PENICILLIN DRUG MARKET, BY SPECTRUM OF ACTIVITY, 2022(%)
- FIGURE 16. COMPARATIVE SHARE ANALYSIS OF PENICILLIN DRUG MARKET FOR NARROW SPECTRUM PENICILLIN, BY COUNTRY 2022 AND 2032(%)
- FIGURE 17. COMPARATIVE SHARE ANALYSIS OF PENICILLIN DRUG MARKET FOR BROAD SPECTRUM PENICILLIN, BY COUNTRY 2022 AND 2032(%)
- FIGURE 18. COMPARATIVE SHARE ANALYSIS OF PENICILLIN DRUG MARKET FOR EXTENDED SPECTRUM PENICILLIN, BY COUNTRY 2022 AND 2032(%)
- FIGURE 19. PENICILLIN DRUG MARKET, BY DISTRIBUTION CHANNEL, 2022(%)
- FIGURE 20. COMPARATIVE SHARE ANALYSIS OF PENICILLIN DRUG MARKET FOR HOSPITAL PHARMACIES, BY COUNTRY 2022 AND 2032(%)
- FIGURE 21. COMPARATIVE SHARE ANALYSIS OF PENICILLIN DRUG MARKET FOR DRUG STORES AND RETAIL PHARMACIES, BY COUNTRY 2022 AND 2032(%)
- FIGURE 22. COMPARATIVE SHARE ANALYSIS OF PENICILLIN DRUG MARKET FOR ONLINE PROVIDERS, BY COUNTRY 2022 AND 2032(%)
- FIGURE 23. PENICILLIN DRUG MARKET BY REGION, 2022
- FIGURE 24. U.S. PENICILLIN DRUG MARKET, 2022-2032 ($MILLION)
- FIGURE 25. CANADA PENICILLIN DRUG MARKET, 2022-2032 ($MILLION)
- FIGURE 26. MEXICO PENICILLIN DRUG MARKET, 2022-2032 ($MILLION)
- FIGURE 27. GERMANY PENICILLIN DRUG MARKET, 2022-2032 ($MILLION)
- FIGURE 28. FRANCE PENICILLIN DRUG MARKET, 2022-2032 ($MILLION)
- FIGURE 29. UK PENICILLIN DRUG MARKET, 2022-2032 ($MILLION)
- FIGURE 30. ITALY PENICILLIN DRUG MARKET, 2022-2032 ($MILLION)
- FIGURE 31. SPAIN PENICILLIN DRUG MARKET, 2022-2032 ($MILLION)
- FIGURE 32. REST OF EUROPE PENICILLIN DRUG MARKET, 2022-2032 ($MILLION)
- FIGURE 33. JAPAN PENICILLIN DRUG MARKET, 2022-2032 ($MILLION)
- FIGURE 34. CHINA PENICILLIN DRUG MARKET, 2022-2032 ($MILLION)
- FIGURE 35. INDIA PENICILLIN DRUG MARKET, 2022-2032 ($MILLION)
- FIGURE 36. AUSTRALIA PENICILLIN DRUG MARKET, 2022-2032 ($MILLION)
- FIGURE 37. SOUTH KOREA PENICILLIN DRUG MARKET, 2022-2032 ($MILLION)
- FIGURE 38. REST OF ASIA-PACIFIC PENICILLIN DRUG MARKET, 2022-2032 ($MILLION)
- FIGURE 39. BRAZIL PENICILLIN DRUG MARKET, 2022-2032 ($MILLION)
- FIGURE 40. SAUDI ARABIA PENICILLIN DRUG MARKET, 2022-2032 ($MILLION)
- FIGURE 41. SOUTH AFRICA PENICILLIN DRUG MARKET, 2022-2032 ($MILLION)
- FIGURE 42. REST OF LAMEA PENICILLIN DRUG MARKET, 2022-2032 ($MILLION)
- FIGURE 43. TOP WINNING STRATEGIES, BY YEAR
- FIGURE 44. TOP WINNING STRATEGIES, BY DEVELOPMENT
- FIGURE 45. TOP WINNING STRATEGIES, BY COMPANY
- FIGURE 46. PRODUCT MAPPING OF TOP 10 PLAYERS
- FIGURE 47. COMPETITIVE DASHBOARD
- FIGURE 48. COMPETITIVE HEATMAP: PENICILLIN DRUG MARKET
- FIGURE 49. TOP PLAYER POSITIONING, 2022
- FIGURE 50. GLAXOSMITHKLINE PLC: NET SALES, 2020-2022 ($MILLION)
- FIGURE 51. GLAXOSMITHKLINE PLC: REVENUE SHARE BY SEGMENT, 2022 (%)
- FIGURE 52. GLAXOSMITHKLINE PLC: REVENUE SHARE BY REGION, 2022 (%)
- FIGURE 53. PFIZER INC.: NET REVENUE, 2020-2022 ($MILLION)
- FIGURE 54. PFIZER INC.: REVENUE SHARE BY SEGMENT, 2022 (%)
- FIGURE 55. PFIZER INC.: REVENUE SHARE BY REGION, 2022 (%)
- FIGURE 56. NOVARTIS AG: NET SALES, 2020-2022 ($MILLION)
- FIGURE 57. NOVARTIS AG: REVENUE SHARE BY SEGMENT, 2022 (%)
- FIGURE 58. NOVARTIS AG: REVENUE SHARE BY REGION, 2022 (%)
- FIGURE 59. LUPIN: NET SALES, 2020-2022 ($MILLION)
- FIGURE 60. LUPIN: REVENUE SHARE BY REGION, 2022 (%)
- FIGURE 61. ABBOTT LABORATORIES: NET SALES, 2020-2022 ($MILLION)
- FIGURE 62. ABBOTT LABORATORIES: REVENUE SHARE BY SEGMENT, 2022 (%)
- FIGURE 63. ABBOTT LABORATORIES: REVENUE SHARE BY REGION, 2022 (%)
- FIGURE 64. CIPLA LTD: SALES REVENUE, 2020-2022 ($MILLION)
- FIGURE 65. CIPLA LTD: REVENUE SHARE BY SEGMENT, 2022 (%)
- FIGURE 66. CIPLA LTD: REVENUE SHARE BY REGION, 2022 (%)
- FIGURE 67. TAKEDA PHARMACEUTICAL COMPANY LTD: NET REVENUE, 2020-2022 ($MILLION)
- FIGURE 68. TAKEDA PHARMACEUTICAL COMPANY LTD: REVENUE SHARE BY REGION, 2022 (%)
- FIGURE 69. ALKEM LABORATORIES LTD.: NET REVENUE, 2020-2022 ($MILLION)
- FIGURE 70. ALKEM LABORATORIES LTD.: REVENUE SHARE BY REGION, 2022 (%)
- FIGURE 71. TEVA PHARMACEUTICAL INDUSTRIES LIMITED: NET REVENUE, 2020-2022 ($MILLION)
- FIGURE 72. TEVA PHARMACEUTICAL INDUSTRIES LIMITED: REVENUE SHARE BY SEGMENT, 2022 (%)
- FIGURE 73. SUN PHARMACEUTICAL INDUSTRIES LIMITED: SALES REVENUE, 2020-2022 ($MILLION)
- FIGURE 74. SUN PHARMACEUTICAL INDUSTRIES LIMITED: REVENUE SHARE BY REGION, 2022 (%)
The penicillin drug market is likely to experience a significant growth rate of 3.7% from 2023-2032 owing to increasing market demand from pharmaceutical sector - Allied Market Research.
"The COVID-19 pandemic had a slight positive impact on the penicillin market as it heightened the importance of effective infection control measures and the need for appropriate antibiotic treatment. Additionally, the increased awareness about respiratory infections during the pandemic led to a surge in demand for penicillin drugs, contributing to market growth."
Market Dynamics
The penicillin drug market size is experiencing significant growth due to various driving factors including the prevalence of bacterial infections which plays a crucial role in the increased demand for penicillin. Bacterial infections are a common healthcare concern globally, which includes skin infection, dental infection, ear infection, an infection of the nose, throat or lungs, urinary tract infection and other bacterial infections.
For instance, According to National Center for Health Statistics (NCHS), there were 1.5 million number of visits to emergency departments with pneumonia as the primary diagnosis in U.S. Such huge prevalence of pneumonia and other respiratory tract infections is contributing to the growth of the market. As penicillin, as an effective and well-established antibiotic, remains a frontline treatment option for many bacterial infections. The rising incidence of these infections, both in community and healthcare settings, necessitates the use of penicillin and drives the penicillin drug market growth.
In addition, advancements in healthcare infrastructure and access to healthcare services play a significant role in driving penicillin drug market share. Improved healthcare facilities, especially in developing countries, have led to better diagnosis and management of bacterial infections. As healthcare systems strengthen, the availability and accessibility of penicillin are enhanced, leading to increased utilization and market growth.
Furthermore, the growing awareness about the importance of appropriate antibiotic use among healthcare providers and patients has contributed to the demand for penicillin in penicillin drug market forecast period. With increased knowledge about the appropriate indications, dosing, and duration of penicillin therapy, healthcare professionals are more likely to prescribe it when appropriate, promoting its market growth. Patients also play a vital role in driving market growth by seeking timely medical attention for bacterial infections and following the prescribed penicillin regimen.
While there are several driving factors for the growth of the penicillin market, the rising antimicrobial resistance (AMR) indeed acts as a significant restraint to its growth. Antimicrobial resistance refers to the ability of bacteria to survive and multiply despite the presence of antibiotics, leading to the reduced effectiveness of these medications. AMR poses a considerable challenge to the treatment of bacterial infections, including those that penicillin is commonly used to treat. Antimicrobial resistance leads to reduced efficacy, need for alternative treatments, and increased healthcare costs, which may hinder the growth of the penicillin market.
However, R&D efforts in the pharmaceutical industry are anticipated to overcome this challenge. Addressing antimicrobial resistance requires a multi-faceted approach, including improved infection prevention measures, optimized antibiotic use, and the development of novel antimicrobial agents. Thus, pharmaceutical companies are recognizing the importance of continually improving and expanding the options available for penicillin therapy, which is anticipated to boost the penicillin market growth during the forecast period.
In addition, companies are investing on a large scale to create alternative formulations that offer advantages such as improved pharmacokinetics, or better patient tolerability of penicillin medications. For instance, in November 2022, Sandoz, a global pharmaceutical company, announced plans for a significant investment in one of its key manufacturing facilities in Austria. The company aims to address the increased global demand for essential antibiotics, specifically finished dosage form penicillin, which are considered the leading class of antibiotics worldwide. The planned investment amounts to EUR 50 million and is focused on expanding the manufacturing capacity for penicillin antibiotics.
In addition, the surge in demand for affordable and generic penicillin medication is playing a pivotal role in boosting the growth of the market. Generic medications, including generic penicillin, offer a more cost-effective alternative to their brand-name counterparts, making them increasingly sought after by patients and healthcare systems. The availability of multiple manufacturers producing generic penicillin has also led to increased market competition, resulting in lower prices and a steady supply of medications. This contributed to the growth of the global penicillin drug market.
The covid-19 pandemic had a slight positive impact on the penicillin drug market. An article by National Center for Biotechnology Information (NCBI) in 2022, stated that COVID-19 pandemic led to increased self-medication of antimicrobials, vitamins, and immune boosters among the people. This led to an increased demand for penicillin and other antibiotics during the pandemic and contributed to market growth.
On the other hand, the global supply chains for pharmaceutical products experienced disruptions due to lockdowns, travel restrictions, and increased demand. These challenges impacted the availability of raw materials and finished products, including penicillin. However, the market is anticipated to normalize in the coming years as there have been surge in investment to meet the increasing demand for penicillin in the market.
Segmental Overview
The global penicillin drug market is segmented on the basis of source, route of administration, distribution channel and region. On the basis of source, the market is categorized as natural penicillin and semisynthetic penicillin. The Semisynthetic penicillin segment is further segmented into aminopenicillin, penicillinase-resistant penicillin and others. Based on spectrum of activity, the narrow spectrum penicillin, broad spectrum penicillin, and extended spectrum penicillin. On the basis of route of administration, it is bifurcated into oral and parenteral.
Based on the distribution channel the market is segmented into hospital pharmacies, drug stores and retail pharmacies and online providers. Based on region, the market is analyzed across North America (U.S., Canada, and Mexico), Europe (Germany, France, UK, Italy, Spain, and Rest of Europe), Asia-Pacific (Japan, China, Australia, India, South Korea, and Rest of Asia-Pacific), and LAMEA (Brazil, South Africa, Saudi Arabia, and Rest of LAMEA).
Key Benefits For Stakeholders:
- This report provides a quantitative analysis of the market segments, current trends, estimations, and dynamics of the penicillin drug market analysis from 2022 to 2032 to identify the prevailing penicillin drug market opportunity.
- The market research is offered along with information related to key drivers, restraints, and opportunities.
- Porter's five forces analysis highlights the potency of buyers and suppliers to enable stakeholders make profit-oriented business decisions and strengthen their supplier-buyer network.
- In-depth analysis of the penicillin drug market segmentation assists to determine the prevailing market opportunities.
- Major countries in each region are mapped according to their revenue contribution to the global market.
- Market player positioning facilitates benchmarking and provides a clear understanding of the present position of the market players.
- The report includes the analysis of the regional as well as global penicillin drug market trends, key players, market segments, application areas, and market growth strategies.
TABLE OF CONTENTS
CHAPTER 1: INTRODUCTION
- 1.1. Report description
- 1.2. Key market segments
- 1.3. Key benefits to the stakeholders
- 1.4. Research Methodology
- 1.4.1. Primary research
- 1.4.2. Secondary research
- 1.4.3. Analyst tools and models
CHAPTER 2: EXECUTIVE SUMMARY
- 2.1. CXO Perspective
CHAPTER 3: MARKET OVERVIEW
- 3.1. Market definition and scope
- 3.2. Key findings
- 3.2.1. Top impacting factors
- 3.2.2. Top investment pockets
- 3.3. Porter's five forces analysis
- 3.3.1. Bargaining power of suppliers
- 3.3.2. Bargaining power of buyers
- 3.3.3. Threat of substitutes
- 3.3.4. Threat of new entrants
- 3.3.5. Intensity of rivalry
- 3.4. Market dynamics
- 3.4.1. Drivers
- 3.4.1.1. Surge in awareness and adoption of combination medication
- 3.4.1.2. Rise in incidences of bacterial infections
- 3.4.1.3. Availability of generic medications
- 3.4.1. Drivers
- 3.4.2. Restraints
- 3.4.2.1. Side effects associated with penicillin
- 3.4.2.2. Increase in Resistance to Anti-microbials
- 3.4.3. Opportunities
- 3.4.3.1. Rise in investments in R&D activities
- 3.5. COVID-19 Impact Analysis on the market
CHAPTER 4: PENICILLIN DRUG MARKET, BY SOURCE
- 4.1. Overview
- 4.1.1. Market size and forecast
- 4.2. Natural penicillin
- 4.2.1. Key market trends, growth factors and opportunities
- 4.2.2. Market size and forecast, by region
- 4.2.3. Market share analysis by country
- 4.3. Semisynthetic penicillin
- 4.3.1. Key market trends, growth factors and opportunities
- 4.3.2. Market size and forecast, by region
- 4.3.3. Market share analysis by country
- 4.3.4. Semisynthetic penicillin Penicillin Drug Market by Class
CHAPTER 5: PENICILLIN DRUG MARKET, BY ROUTE OF ADMINISTRATION
- 5.1. Overview
- 5.1.1. Market size and forecast
- 5.2. Oral
- 5.2.1. Key market trends, growth factors and opportunities
- 5.2.2. Market size and forecast, by region
- 5.2.3. Market share analysis by country
- 5.3. Parenteral
- 5.3.1. Key market trends, growth factors and opportunities
- 5.3.2. Market size and forecast, by region
- 5.3.3. Market share analysis by country
CHAPTER 6: PENICILLIN DRUG MARKET, BY SPECTRUM OF ACTIVITY
- 6.1. Overview
- 6.1.1. Market size and forecast
- 6.2. Narrow spectrum penicillin
- 6.2.1. Key market trends, growth factors and opportunities
- 6.2.2. Market size and forecast, by region
- 6.2.3. Market share analysis by country
- 6.3. Broad spectrum penicillin
- 6.3.1. Key market trends, growth factors and opportunities
- 6.3.2. Market size and forecast, by region
- 6.3.3. Market share analysis by country
- 6.4. Extended spectrum penicillin
- 6.4.1. Key market trends, growth factors and opportunities
- 6.4.2. Market size and forecast, by region
- 6.4.3. Market share analysis by country
CHAPTER 7: PENICILLIN DRUG MARKET, BY DISTRIBUTION CHANNEL
- 7.1. Overview
- 7.1.1. Market size and forecast
- 7.2. Hospital Pharmacies
- 7.2.1. Key market trends, growth factors and opportunities
- 7.2.2. Market size and forecast, by region
- 7.2.3. Market share analysis by country
- 7.3. Drug Stores and Retail Pharmacies
- 7.3.1. Key market trends, growth factors and opportunities
- 7.3.2. Market size and forecast, by region
- 7.3.3. Market share analysis by country
- 7.4. Online Providers
- 7.4.1. Key market trends, growth factors and opportunities
- 7.4.2. Market size and forecast, by region
- 7.4.3. Market share analysis by country
CHAPTER 8: PENICILLIN DRUG MARKET, BY REGION
- 8.1. Overview
- 8.1.1. Market size and forecast By Region
- 8.2. North America
- 8.2.1. Key trends and opportunities
- 8.2.2. Market size and forecast, by Source
- 8.2.3. Market size and forecast, by Route of Administration
- 8.2.4. Market size and forecast, by Spectrum of Activity
- 8.2.5. Market size and forecast, by Distribution Channel
- 8.2.6. Market size and forecast, by country
- 8.2.6.1. U.S.
- 8.2.6.1.1. Key market trends, growth factors and opportunities
- 8.2.6.1.2. Market size and forecast, by Source
- 8.2.6.1.3. Market size and forecast, by Route of Administration
- 8.2.6.1.4. Market size and forecast, by Spectrum of Activity
- 8.2.6.1.5. Market size and forecast, by Distribution Channel
- 8.2.6.2. Canada
- 8.2.6.2.1. Key market trends, growth factors and opportunities
- 8.2.6.2.2. Market size and forecast, by Source
- 8.2.6.2.3. Market size and forecast, by Route of Administration
- 8.2.6.2.4. Market size and forecast, by Spectrum of Activity
- 8.2.6.2.5. Market size and forecast, by Distribution Channel
- 8.2.6.3. Mexico
- 8.2.6.3.1. Key market trends, growth factors and opportunities
- 8.2.6.3.2. Market size and forecast, by Source
- 8.2.6.3.3. Market size and forecast, by Route of Administration
- 8.2.6.3.4. Market size and forecast, by Spectrum of Activity
- 8.2.6.3.5. Market size and forecast, by Distribution Channel
- 8.3. Europe
- 8.3.1. Key trends and opportunities
- 8.3.2. Market size and forecast, by Source
- 8.3.3. Market size and forecast, by Route of Administration
- 8.3.4. Market size and forecast, by Spectrum of Activity
- 8.3.5. Market size and forecast, by Distribution Channel
- 8.3.6. Market size and forecast, by country
- 8.3.6.1. Germany
- 8.3.6.1.1. Key market trends, growth factors and opportunities
- 8.3.6.1.2. Market size and forecast, by Source
- 8.3.6.1.3. Market size and forecast, by Route of Administration
- 8.3.6.1.4. Market size and forecast, by Spectrum of Activity
- 8.3.6.1.5. Market size and forecast, by Distribution Channel
- 8.3.6.2. France
- 8.3.6.2.1. Key market trends, growth factors and opportunities
- 8.3.6.2.2. Market size and forecast, by Source
- 8.3.6.2.3. Market size and forecast, by Route of Administration
- 8.3.6.2.4. Market size and forecast, by Spectrum of Activity
- 8.3.6.2.5. Market size and forecast, by Distribution Channel
- 8.3.6.3. UK
- 8.3.6.3.1. Key market trends, growth factors and opportunities
- 8.3.6.3.2. Market size and forecast, by Source
- 8.3.6.3.3. Market size and forecast, by Route of Administration
- 8.3.6.3.4. Market size and forecast, by Spectrum of Activity
- 8.3.6.3.5. Market size and forecast, by Distribution Channel
- 8.3.6.4. Italy
- 8.3.6.4.1. Key market trends, growth factors and opportunities
- 8.3.6.4.2. Market size and forecast, by Source
- 8.3.6.4.3. Market size and forecast, by Route of Administration
- 8.3.6.4.4. Market size and forecast, by Spectrum of Activity
- 8.3.6.4.5. Market size and forecast, by Distribution Channel
- 8.3.6.5. Spain
- 8.3.6.5.1. Key market trends, growth factors and opportunities
- 8.3.6.5.2. Market size and forecast, by Source
- 8.3.6.5.3. Market size and forecast, by Route of Administration
- 8.3.6.5.4. Market size and forecast, by Spectrum of Activity
- 8.3.6.5.5. Market size and forecast, by Distribution Channel
- 8.3.6.6. Rest of Europe
- 8.3.6.6.1. Key market trends, growth factors and opportunities
- 8.3.6.6.2. Market size and forecast, by Source
- 8.3.6.6.3. Market size and forecast, by Route of Administration
- 8.3.6.6.4. Market size and forecast, by Spectrum of Activity
- 8.3.6.6.5. Market size and forecast, by Distribution Channel
- 8.4. Asia-Pacific
- 8.4.1. Key trends and opportunities
- 8.4.2. Market size and forecast, by Source
- 8.4.3. Market size and forecast, by Route of Administration
- 8.4.4. Market size and forecast, by Spectrum of Activity
- 8.4.5. Market size and forecast, by Distribution Channel
- 8.4.6. Market size and forecast, by country
- 8.4.6.1. Japan
- 8.4.6.1.1. Key market trends, growth factors and opportunities
- 8.4.6.1.2. Market size and forecast, by Source
- 8.4.6.1.3. Market size and forecast, by Route of Administration
- 8.4.6.1.4. Market size and forecast, by Spectrum of Activity
- 8.4.6.1.5. Market size and forecast, by Distribution Channel
- 8.4.6.2. China
- 8.4.6.2.1. Key market trends, growth factors and opportunities
- 8.4.6.2.2. Market size and forecast, by Source
- 8.4.6.2.3. Market size and forecast, by Route of Administration
- 8.4.6.2.4. Market size and forecast, by Spectrum of Activity
- 8.4.6.2.5. Market size and forecast, by Distribution Channel
- 8.4.6.3. India
- 8.4.6.3.1. Key market trends, growth factors and opportunities
- 8.4.6.3.2. Market size and forecast, by Source
- 8.4.6.3.3. Market size and forecast, by Route of Administration
- 8.4.6.3.4. Market size and forecast, by Spectrum of Activity
- 8.4.6.3.5. Market size and forecast, by Distribution Channel
- 8.4.6.4. Australia
- 8.4.6.4.1. Key market trends, growth factors and opportunities
- 8.4.6.4.2. Market size and forecast, by Source
- 8.4.6.4.3. Market size and forecast, by Route of Administration
- 8.4.6.4.4. Market size and forecast, by Spectrum of Activity
- 8.4.6.4.5. Market size and forecast, by Distribution Channel
- 8.4.6.5. South Korea
- 8.4.6.5.1. Key market trends, growth factors and opportunities
- 8.4.6.5.2. Market size and forecast, by Source
- 8.4.6.5.3. Market size and forecast, by Route of Administration
- 8.4.6.5.4. Market size and forecast, by Spectrum of Activity
- 8.4.6.5.5. Market size and forecast, by Distribution Channel
- 8.4.6.6. Rest of Asia-Pacific
- 8.4.6.6.1. Key market trends, growth factors and opportunities
- 8.4.6.6.2. Market size and forecast, by Source
- 8.4.6.6.3. Market size and forecast, by Route of Administration
- 8.4.6.6.4. Market size and forecast, by Spectrum of Activity
- 8.4.6.6.5. Market size and forecast, by Distribution Channel
- 8.5. LAMEA
- 8.5.1. Key trends and opportunities
- 8.5.2. Market size and forecast, by Source
- 8.5.3. Market size and forecast, by Route of Administration
- 8.5.4. Market size and forecast, by Spectrum of Activity
- 8.5.5. Market size and forecast, by Distribution Channel
- 8.5.6. Market size and forecast, by country
- 8.5.6.1. Brazil
- 8.5.6.1.1. Key market trends, growth factors and opportunities
- 8.5.6.1.2. Market size and forecast, by Source
- 8.5.6.1.3. Market size and forecast, by Route of Administration
- 8.5.6.1.4. Market size and forecast, by Spectrum of Activity
- 8.5.6.1.5. Market size and forecast, by Distribution Channel
- 8.5.6.2. Saudi Arabia
- 8.5.6.2.1. Key market trends, growth factors and opportunities
- 8.5.6.2.2. Market size and forecast, by Source
- 8.5.6.2.3. Market size and forecast, by Route of Administration
- 8.5.6.2.4. Market size and forecast, by Spectrum of Activity
- 8.5.6.2.5. Market size and forecast, by Distribution Channel
- 8.5.6.3. South Africa
- 8.5.6.3.1. Key market trends, growth factors and opportunities
- 8.5.6.3.2. Market size and forecast, by Source
- 8.5.6.3.3. Market size and forecast, by Route of Administration
- 8.5.6.3.4. Market size and forecast, by Spectrum of Activity
- 8.5.6.3.5. Market size and forecast, by Distribution Channel
- 8.5.6.4. Rest of LAMEA
- 8.5.6.4.1. Key market trends, growth factors and opportunities
- 8.5.6.4.2. Market size and forecast, by Source
- 8.5.6.4.3. Market size and forecast, by Route of Administration
- 8.5.6.4.4. Market size and forecast, by Spectrum of Activity
- 8.5.6.4.5. Market size and forecast, by Distribution Channel
CHAPTER 9: COMPETITIVE LANDSCAPE
- 9.1. Introduction
- 9.2. Top winning strategies
- 9.3. Product Mapping of Top 10 Player
- 9.4. Competitive Dashboard
- 9.5. Competitive Heatmap
- 9.6. Top player positioning, 2022
CHAPTER 10: COMPANY PROFILES
- 10.1. GlaxoSmithKline plc
- 10.1.1. Company overview
- 10.1.2. Key Executives
- 10.1.3. Company snapshot
- 10.1.4. Operating business segments
- 10.1.5. Product portfolio
- 10.1.6. Business performance
- 10.1.7. Key strategic moves and developments
- 10.2. Pfizer Inc.
- 10.2.1. Company overview
- 10.2.2. Key Executives
- 10.2.3. Company snapshot
- 10.2.4. Operating business segments
- 10.2.5. Product portfolio
- 10.2.6. Business performance
- 10.3. Novartis AG
- 10.3.1. Company overview
- 10.3.2. Key Executives
- 10.3.3. Company snapshot
- 10.3.4. Operating business segments
- 10.3.5. Product portfolio
- 10.3.6. Business performance
- 10.3.7. Key strategic moves and developments
- 10.4. Lupin
- 10.4.1. Company overview
- 10.4.2. Key Executives
- 10.4.3. Company snapshot
- 10.4.4. Operating business segments
- 10.4.5. Product portfolio
- 10.4.6. Business performance
- 10.5. Abbott Laboratories
- 10.5.1. Company overview
- 10.5.2. Key Executives
- 10.5.3. Company snapshot
- 10.5.4. Operating business segments
- 10.5.5. Product portfolio
- 10.5.6. Business performance
- 10.6. Cipla Ltd
- 10.6.1. Company overview
- 10.6.2. Key Executives
- 10.6.3. Company snapshot
- 10.6.4. Operating business segments
- 10.6.5. Product portfolio
- 10.6.6. Business performance
- 10.7. Takeda Pharmaceutical Company Ltd
- 10.7.1. Company overview
- 10.7.2. Key Executives
- 10.7.3. Company snapshot
- 10.7.4. Operating business segments
- 10.7.5. Product portfolio
- 10.7.6. Business performance
- 10.8. Alkem Laboratories Ltd.
- 10.8.1. Company overview
- 10.8.2. Key Executives
- 10.8.3. Company snapshot
- 10.8.4. Operating business segments
- 10.8.5. Product portfolio
- 10.8.6. Business performance
- 10.9. Teva Pharmaceutical Industries Limited
- 10.9.1. Company overview
- 10.9.2. Key Executives
- 10.9.3. Company snapshot
- 10.9.4. Operating business segments
- 10.9.5. Product portfolio
- 10.9.6. Business performance
- 10.10. SUN PHARMACEUTICAL INDUSTRIES LIMITED
- 10.10.1. Company overview
- 10.10.2. Key Executives
- 10.10.3. Company snapshot
- 10.10.4. Operating business segments
- 10.10.5. Product portfolio
- 10.10.6. Business performance