 |
市場調査レポート
商品コード
1298383
手押し車市場:ホイール別、用途別、販売チャネル別:2023年~2032年の世界の機会分析と産業予測Wheelbarrow Market By Wheel (Single, Double, Multi), By Application (Construction, Industrial, Gardening, Agriculture and Livestock, Others), By Sales Channel (Online, Offline): Global Opportunity Analysis and Industry Forecast, 2023-2032 |
||||||

| 手押し車市場:ホイール別、用途別、販売チャネル別:2023年~2032年の世界の機会分析と産業予測 |
|
出版日: 2023年04月01日
発行: Allied Market Research
ページ情報: 英文 210 Pages
納期: 2~3営業日
|
- 全表示
- 概要
- 図表
- 目次
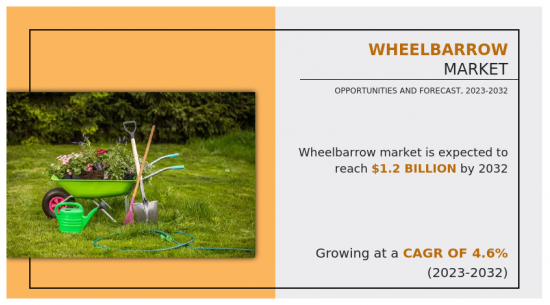
世界の手押し車市場は、2022年には7億4,340万米ドルと評価され、2023年から2032年までのCAGRは4.6%を記録し、2032年には11億8,096万米ドルに達すると予測されています。
庭師や建設作業員は、小さな荷物を運ぶ手段として手押し車を使用します。手押し車は、1つ以上のホイールを持つ手で動かす乗り物で、車の後部にある2つのハンドルを使って1人で押したり、指示したりすることを目的としています。
アジア太平洋、ラテンアメリカ、アフリカなどの新興市場は、人口の増加、経済成長、都市化を目の当たりにしてきました。アジア太平洋とアフリカの人口は急ピッチで増加しており、そのため住宅需要が急増しています。この2つの地域の国々のほとんどは新興国で、力強い経済成長を遂げています。新興国の経済成長は、商業用、工業用、企業用、住宅用不動産の成長を促進します。新興国政府は、道路、水道、衛生設備を改善し、公園、保健センター、コミュニティセンターを建設して市民に良い経験を提供するための措置を講じることで、インフラの改善に期待しています。例えば、ブラジル政府はインフラ整備のために2021年に1億6,730万米ドルを投資しました。新興国の成長は、マテリアルハンドリング用手押し車のニーズに拍車をかけています。手押し車の利点に関する意識の高まりと、インフラ整備に対する各国政府による投資の増加は、市場成長を促進すると予想されます。
目次
第1章 イントロダクション
第2章 エグゼクティブサマリー
第3章 市場概要
- 市場の定義と範囲
- 主な調査結果
- 影響要因
- 主な投資機会
- ポーターのファイブフォース分析
- 供給企業の交渉力
- 買い手の交渉力
- 代替品の脅威
- 新規参入業者の脅威
- 競合の激しさ
- 市場力学
- 促進要因
- 建設業の増加、急速な都市化。
- 農業分野での需要増加
- eコマースとオンライン販売における需要の伸び
- 阻害要因
- 原材料価格の変動
- 機会
- 新興国の急速な都市化と工業化
- 促進要因
- COVID-19:市場への影響分析
第4章 手押し車市場:ホイール別
- 概要
- 市場規模と予測
- シングル
- 主要市場動向、成長要因、機会
- 市場規模・予測:地域別
- 市場シェア分析:国別
- ダブル
- 主な市場動向、成長要因、機会
- 市場規模・予測:地域別
- 市場シェア分析:国別
- マルチ
- 主な市場動向、成長要因、機会
- 市場規模・予測:地域別
- 市場シェア分析:国別
第5章 手押し車市場:用途別
- 概要
- 市場規模と予測
- 建設
- 主要市場動向、成長要因、機会
- 市場規模・予測:地域別
- 市場シェア分析:国別
- 工業
- 主な市場動向、成長要因、機会
- 市場規模・予測:地域別
- 市場シェア分析:国別
- ガーデニング
- 主な市場動向、成長要因、機会
- 市場規模・予測:地域別
- 市場シェア分析:国別
- 農業・畜産
- 主な市場動向、成長要因、機会
- 市場規模・予測:地域別
- 市場シェア分析:国別
- その他
- 主要市場動向、成長要因、機会
- 市場規模・予測:地域別
- 市場シェア分析:国別
第6章 手押し車市場:販売チャネル別
- 概要
- 市場規模と予測
- オンライン
- 主要市場動向、成長要因、機会
- 市場規模・予測:地域別
- 市場シェア分析:国別
- オフライン
- 主な市場動向、成長要因、機会
- 市場規模・予測:地域別
- 市場シェア分析:国別
第7章 手押し車市場:地域別
- 概要
- 市場規模・予測:地域別
- 北米
- 主要動向と機会
- 市場規模・予測:ホイール別
- 市場規模・予測:用途別
- 市場規模・予測:販売チャネル別
- 市場規模・予測:国別
- 米国
- 主要市場動向、成長要因、機会
- 市場規模・予測:ホイール別
- 市場規模・予測:用途別
- 市場規模・予測:販売チャネル別
- カナダ
- 主要市場動向、成長要因、機会
- 市場規模・予測:ホイール別
- 市場規模・予測:用途別
- 市場規模・予測:販売チャネル別
- メキシコ
- 主要市場動向、成長要因、機会
- 市場規模・予測:ホイール別
- 市場規模・予測:用途別
- 市場規模・予測:販売チャネル別
- 欧州
- 主要動向と機会
- 市場規模・予測:ホイール別
- 市場規模・予測:用途別
- 市場規模・予測:販売チャネル別
- 市場規模・予測:国別
- ドイツ
- 主要市場動向、成長要因、機会
- 市場規模・予測:ホイール別
- 市場規模・予測:用途別
- 市場規模・予測:販売チャネル別
- 英国
- 主要市場動向、成長要因、機会
- 市場規模・予測:ホイール別
- 市場規模・予測:用途別
- 市場規模・予測:販売チャネル別
- フランス
- 主要市場動向、成長要因、機会
- 市場規模・予測:ホイール別
- 市場規模・予測:用途別
- 市場規模・予測:販売チャネル別
- イタリア
- 主要市場動向、成長要因、機会
- 市場規模・予測:ホイール別
- 市場規模・予測:用途別
- 市場規模・予測:販売チャネル別
- その他欧州
- 主要市場動向、成長要因、機会
- 市場規模・予測:ホイール別
- 市場規模・予測:用途別
- 市場規模・予測:販売チャネル別
- アジア太平洋
- 主要動向と機会
- 市場規模・予測:ホイール別
- 市場規模・予測:用途別
- 市場規模・予測:販売チャネル別
- 市場規模・予測:国別
- 中国
- 主要市場動向、成長要因、機会
- 市場規模・予測:ホイール別
- 市場規模・予測:用途別
- 市場規模・予測:販売チャネル別
- 日本
- 主要市場動向、成長要因、機会
- 市場規模・予測:ホイール別
- 市場規模・予測:用途別
- 市場規模・予測:販売チャネル別
- 韓国
- 主要市場動向、成長要因、機会
- 市場規模・予測:ホイール別
- 市場規模・予測:用途別
- 市場規模・予測:販売チャネル別
- インド
- 主要市場動向、成長要因、機会
- 市場規模・予測:ホイール別
- 市場規模・予測:用途別
- 市場規模・予測:販売チャネル別
- その他アジア太平洋地域
- 主要市場動向、成長要因、機会
- 市場規模・予測:ホイール別
- 市場規模・予測:用途別
- 市場規模・予測:販売チャネル別
- ラテンアメリカ・中東・アフリカ
- 主要動向と機会
- 市場規模・予測:ホイール別
- 市場規模・予測:用途別
- 市場規模・予測:販売チャネル別
- 市場規模・予測:国別
- ラテンアメリカ
- 主要市場動向、成長要因、機会
- 市場規模・予測:ホイール別
- 市場規模・予測:用途別
- 市場規模・予測:販売チャネル別
- 中東
- 主要市場動向、成長要因、機会
- 市場規模・予測:ホイール別
- 市場規模・予測:用途別
- 市場規模・予測:販売チャネル別
- アフリカ
- 主要市場動向、成長要因、機会
- 市場規模・予測:ホイール別
- 市場規模・予測:用途別
- 市場規模・予測:販売チャネル別
第8章 競合情勢
- イントロダクション
- 主要成功戦略
- 主要10社の製品マッピング
- 競合ダッシュボード
- 競合ヒートマップ
- トップ企業のポジショニング、2022年
第9章 企業プロファイル
- Bullbarrow
- Gorilla Carts
- Griffin Bros Truck & Equipment
- Haemmerlin
- Qingdao Taifa Group
- QINGDAO XINJIANG HANDTRUCK CO., LTD
- SILVAN Australia Pty Ltd.
- Stanley
- The Walsall Wheelbarrow Co Ltd.
- Wolverine Products
LIST OF TABLES
- TABLE 01. GLOBAL WHEELBARROW MARKET, BY WHEEL, 2022-2032 ($MILLION)
- TABLE 02. WHEELBARROW MARKET FOR SINGLE, BY REGION, 2022-2032 ($MILLION)
- TABLE 03. WHEELBARROW MARKET FOR DOUBLE, BY REGION, 2022-2032 ($MILLION)
- TABLE 04. WHEELBARROW MARKET FOR MULTI, BY REGION, 2022-2032 ($MILLION)
- TABLE 05. GLOBAL WHEELBARROW MARKET, BY APPLICATION, 2022-2032 ($MILLION)
- TABLE 06. WHEELBARROW MARKET FOR CONSTRUCTION, BY REGION, 2022-2032 ($MILLION)
- TABLE 07. WHEELBARROW MARKET FOR INDUSTRIAL, BY REGION, 2022-2032 ($MILLION)
- TABLE 08. WHEELBARROW MARKET FOR GARDENING, BY REGION, 2022-2032 ($MILLION)
- TABLE 09. WHEELBARROW MARKET FOR AGRICULTURE AND LIVESTOCK, BY REGION, 2022-2032 ($MILLION)
- TABLE 10. WHEELBARROW MARKET FOR OTHERS, BY REGION, 2022-2032 ($MILLION)
- TABLE 11. GLOBAL WHEELBARROW MARKET, BY SALES CHANNEL, 2022-2032 ($MILLION)
- TABLE 12. WHEELBARROW MARKET FOR ONLINE, BY REGION, 2022-2032 ($MILLION)
- TABLE 13. WHEELBARROW MARKET FOR OFFLINE, BY REGION, 2022-2032 ($MILLION)
- TABLE 14. WHEELBARROW MARKET, BY REGION, 2022-2032 ($MILLION)
- TABLE 15. NORTH AMERICA WHEELBARROW MARKET, BY WHEEL, 2022-2032 ($MILLION)
- TABLE 16. NORTH AMERICA WHEELBARROW MARKET, BY APPLICATION, 2022-2032 ($MILLION)
- TABLE 17. NORTH AMERICA WHEELBARROW MARKET, BY SALES CHANNEL, 2022-2032 ($MILLION)
- TABLE 18. NORTH AMERICA WHEELBARROW MARKET, BY COUNTRY, 2022-2032 ($MILLION)
- TABLE 19. U.S. WHEELBARROW MARKET, BY WHEEL, 2022-2032 ($MILLION)
- TABLE 20. U.S. WHEELBARROW MARKET, BY APPLICATION, 2022-2032 ($MILLION)
- TABLE 21. U.S. WHEELBARROW MARKET, BY SALES CHANNEL, 2022-2032 ($MILLION)
- TABLE 22. CANADA WHEELBARROW MARKET, BY WHEEL, 2022-2032 ($MILLION)
- TABLE 23. CANADA WHEELBARROW MARKET, BY APPLICATION, 2022-2032 ($MILLION)
- TABLE 24. CANADA WHEELBARROW MARKET, BY SALES CHANNEL, 2022-2032 ($MILLION)
- TABLE 25. MEXICO WHEELBARROW MARKET, BY WHEEL, 2022-2032 ($MILLION)
- TABLE 26. MEXICO WHEELBARROW MARKET, BY APPLICATION, 2022-2032 ($MILLION)
- TABLE 27. MEXICO WHEELBARROW MARKET, BY SALES CHANNEL, 2022-2032 ($MILLION)
- TABLE 28. EUROPE WHEELBARROW MARKET, BY WHEEL, 2022-2032 ($MILLION)
- TABLE 29. EUROPE WHEELBARROW MARKET, BY APPLICATION, 2022-2032 ($MILLION)
- TABLE 30. EUROPE WHEELBARROW MARKET, BY SALES CHANNEL, 2022-2032 ($MILLION)
- TABLE 31. EUROPE WHEELBARROW MARKET, BY COUNTRY, 2022-2032 ($MILLION)
- TABLE 32. GERMANY WHEELBARROW MARKET, BY WHEEL, 2022-2032 ($MILLION)
- TABLE 33. GERMANY WHEELBARROW MARKET, BY APPLICATION, 2022-2032 ($MILLION)
- TABLE 34. GERMANY WHEELBARROW MARKET, BY SALES CHANNEL, 2022-2032 ($MILLION)
- TABLE 35. UK WHEELBARROW MARKET, BY WHEEL, 2022-2032 ($MILLION)
- TABLE 36. UK WHEELBARROW MARKET, BY APPLICATION, 2022-2032 ($MILLION)
- TABLE 37. UK WHEELBARROW MARKET, BY SALES CHANNEL, 2022-2032 ($MILLION)
- TABLE 38. FRANCE WHEELBARROW MARKET, BY WHEEL, 2022-2032 ($MILLION)
- TABLE 39. FRANCE WHEELBARROW MARKET, BY APPLICATION, 2022-2032 ($MILLION)
- TABLE 40. FRANCE WHEELBARROW MARKET, BY SALES CHANNEL, 2022-2032 ($MILLION)
- TABLE 41. ITALY WHEELBARROW MARKET, BY WHEEL, 2022-2032 ($MILLION)
- TABLE 42. ITALY WHEELBARROW MARKET, BY APPLICATION, 2022-2032 ($MILLION)
- TABLE 43. ITALY WHEELBARROW MARKET, BY SALES CHANNEL, 2022-2032 ($MILLION)
- TABLE 44. REST OF EUROPE WHEELBARROW MARKET, BY WHEEL, 2022-2032 ($MILLION)
- TABLE 45. REST OF EUROPE WHEELBARROW MARKET, BY APPLICATION, 2022-2032 ($MILLION)
- TABLE 46. REST OF EUROPE WHEELBARROW MARKET, BY SALES CHANNEL, 2022-2032 ($MILLION)
- TABLE 47. ASIA-PACIFIC WHEELBARROW MARKET, BY WHEEL, 2022-2032 ($MILLION)
- TABLE 48. ASIA-PACIFIC WHEELBARROW MARKET, BY APPLICATION, 2022-2032 ($MILLION)
- TABLE 49. ASIA-PACIFIC WHEELBARROW MARKET, BY SALES CHANNEL, 2022-2032 ($MILLION)
- TABLE 50. ASIA-PACIFIC WHEELBARROW MARKET, BY COUNTRY, 2022-2032 ($MILLION)
- TABLE 51. CHINA WHEELBARROW MARKET, BY WHEEL, 2022-2032 ($MILLION)
- TABLE 52. CHINA WHEELBARROW MARKET, BY APPLICATION, 2022-2032 ($MILLION)
- TABLE 53. CHINA WHEELBARROW MARKET, BY SALES CHANNEL, 2022-2032 ($MILLION)
- TABLE 54. JAPAN WHEELBARROW MARKET, BY WHEEL, 2022-2032 ($MILLION)
- TABLE 55. JAPAN WHEELBARROW MARKET, BY APPLICATION, 2022-2032 ($MILLION)
- TABLE 56. JAPAN WHEELBARROW MARKET, BY SALES CHANNEL, 2022-2032 ($MILLION)
- TABLE 57. SOUTH KOREA WHEELBARROW MARKET, BY WHEEL, 2022-2032 ($MILLION)
- TABLE 58. SOUTH KOREA WHEELBARROW MARKET, BY APPLICATION, 2022-2032 ($MILLION)
- TABLE 59. SOUTH KOREA WHEELBARROW MARKET, BY SALES CHANNEL, 2022-2032 ($MILLION)
- TABLE 60. INDIA WHEELBARROW MARKET, BY WHEEL, 2022-2032 ($MILLION)
- TABLE 61. INDIA WHEELBARROW MARKET, BY APPLICATION, 2022-2032 ($MILLION)
- TABLE 62. INDIA WHEELBARROW MARKET, BY SALES CHANNEL, 2022-2032 ($MILLION)
- TABLE 63. REST OF ASIA-PACIFIC WHEELBARROW MARKET, BY WHEEL, 2022-2032 ($MILLION)
- TABLE 64. REST OF ASIA-PACIFIC WHEELBARROW MARKET, BY APPLICATION, 2022-2032 ($MILLION)
- TABLE 65. REST OF ASIA-PACIFIC WHEELBARROW MARKET, BY SALES CHANNEL, 2022-2032 ($MILLION)
- TABLE 66. LAMEA WHEELBARROW MARKET, BY WHEEL, 2022-2032 ($MILLION)
- TABLE 67. LAMEA WHEELBARROW MARKET, BY APPLICATION, 2022-2032 ($MILLION)
- TABLE 68. LAMEA WHEELBARROW MARKET, BY SALES CHANNEL, 2022-2032 ($MILLION)
- TABLE 69. LAMEA WHEELBARROW MARKET, BY COUNTRY, 2022-2032 ($MILLION)
- TABLE 70. LATIN AMERICA WHEELBARROW MARKET, BY WHEEL, 2022-2032 ($MILLION)
- TABLE 71. LATIN AMERICA WHEELBARROW MARKET, BY APPLICATION, 2022-2032 ($MILLION)
- TABLE 72. LATIN AMERICA WHEELBARROW MARKET, BY SALES CHANNEL, 2022-2032 ($MILLION)
- TABLE 73. MIDDLE EAST WHEELBARROW MARKET, BY WHEEL, 2022-2032 ($MILLION)
- TABLE 74. MIDDLE EAST WHEELBARROW MARKET, BY APPLICATION, 2022-2032 ($MILLION)
- TABLE 75. MIDDLE EAST WHEELBARROW MARKET, BY SALES CHANNEL, 2022-2032 ($MILLION)
- TABLE 76. AFRICA WHEELBARROW MARKET, BY WHEEL, 2022-2032 ($MILLION)
- TABLE 77. AFRICA WHEELBARROW MARKET, BY APPLICATION, 2022-2032 ($MILLION)
- TABLE 78. AFRICA WHEELBARROW MARKET, BY SALES CHANNEL, 2022-2032 ($MILLION)
- TABLE 79. BULLBARROW: KEY EXECUTIVES
- TABLE 80. BULLBARROW: COMPANY SNAPSHOT
- TABLE 81. BULLBARROW: PRODUCT SEGMENTS
- TABLE 82. BULLBARROW: PRODUCT PORTFOLIO
- TABLE 83. GORILLA CARTS: KEY EXECUTIVES
- TABLE 84. GORILLA CARTS: COMPANY SNAPSHOT
- TABLE 85. GORILLA CARTS: PRODUCT SEGMENTS
- TABLE 86. GORILLA CARTS: PRODUCT PORTFOLIO
- TABLE 87. GRIFFIN BROS TRUCK & EQUIPMENT: KEY EXECUTIVES
- TABLE 88. GRIFFIN BROS TRUCK & EQUIPMENT: COMPANY SNAPSHOT
- TABLE 89. GRIFFIN BROS TRUCK & EQUIPMENT: PRODUCT SEGMENTS
- TABLE 90. GRIFFIN BROS TRUCK & EQUIPMENT: PRODUCT PORTFOLIO
- TABLE 91. HAEMMERLIN: KEY EXECUTIVES
- TABLE 92. HAEMMERLIN: COMPANY SNAPSHOT
- TABLE 93. HAEMMERLIN: PRODUCT SEGMENTS
- TABLE 94. HAEMMERLIN: PRODUCT PORTFOLIO
- TABLE 95. QINGDAO TAIFA GROUP: KEY EXECUTIVES
- TABLE 96. QINGDAO TAIFA GROUP: COMPANY SNAPSHOT
- TABLE 97. QINGDAO TAIFA GROUP: PRODUCT SEGMENTS
- TABLE 98. QINGDAO TAIFA GROUP: PRODUCT PORTFOLIO
- TABLE 99. QINGDAO XINJIANG HANDTRUCK CO., LTD: KEY EXECUTIVES
- TABLE 100. QINGDAO XINJIANG HANDTRUCK CO., LTD: COMPANY SNAPSHOT
- TABLE 101. QINGDAO XINJIANG HANDTRUCK CO., LTD: PRODUCT SEGMENTS
- TABLE 102. QINGDAO XINJIANG HANDTRUCK CO., LTD: PRODUCT PORTFOLIO
- TABLE 103. SILVAN AUSTRALIA PTY LTD.: KEY EXECUTIVES
- TABLE 104. SILVAN AUSTRALIA PTY LTD.: COMPANY SNAPSHOT
- TABLE 105. SILVAN AUSTRALIA PTY LTD.: PRODUCT SEGMENTS
- TABLE 106. SILVAN AUSTRALIA PTY LTD.: PRODUCT PORTFOLIO
- TABLE 107. STANLEY: KEY EXECUTIVES
- TABLE 108. STANLEY: COMPANY SNAPSHOT
- TABLE 109. STANLEY: PRODUCT SEGMENTS
- TABLE 110. STANLEY: PRODUCT PORTFOLIO
- TABLE 111. THE WALSALL WHEELBARROW CO LTD.: KEY EXECUTIVES
- TABLE 112. THE WALSALL WHEELBARROW CO LTD.: COMPANY SNAPSHOT
- TABLE 113. THE WALSALL WHEELBARROW CO LTD.: PRODUCT SEGMENTS
- TABLE 114. THE WALSALL WHEELBARROW CO LTD.: PRODUCT PORTFOLIO
- TABLE 115. WOLVERINE PRODUCTS: KEY EXECUTIVES
- TABLE 116. WOLVERINE PRODUCTS: COMPANY SNAPSHOT
- TABLE 117. WOLVERINE PRODUCTS: PRODUCT SEGMENTS
- TABLE 118. WOLVERINE PRODUCTS: PRODUCT PORTFOLIO
LIST OF FIGURES
- FIGURE 01. WHEELBARROW MARKET, 2022-2032
- FIGURE 02. SEGMENTATION OF WHEELBARROW MARKET, 2022-2032
- FIGURE 03. TOP INVESTMENT POCKETS IN WHEELBARROW MARKET (2023-2032)
- FIGURE 04. LOW BARGAINING POWER OF SUPPLIERS
- FIGURE 05. LOW BARGAINING POWER OF BUYERS
- FIGURE 06. LOW THREAT OF SUBSTITUTES
- FIGURE 07. LOW THREAT OF NEW ENTRANTS
- FIGURE 08. LOW INTENSITY OF RIVALRY
- FIGURE 09. DRIVERS, RESTRAINTS AND OPPORTUNITIES: GLOBALWHEELBARROW MARKET
- FIGURE 10. WHEELBARROW MARKET, BY WHEEL, 2022(%)
- FIGURE 11. COMPARATIVE SHARE ANALYSIS OF WHEELBARROW MARKET FOR SINGLE, BY COUNTRY 2022 AND 2032(%)
- FIGURE 12. COMPARATIVE SHARE ANALYSIS OF WHEELBARROW MARKET FOR DOUBLE, BY COUNTRY 2022 AND 2032(%)
- FIGURE 13. COMPARATIVE SHARE ANALYSIS OF WHEELBARROW MARKET FOR MULTI, BY COUNTRY 2022 AND 2032(%)
- FIGURE 14. WHEELBARROW MARKET, BY APPLICATION, 2022(%)
- FIGURE 15. COMPARATIVE SHARE ANALYSIS OF WHEELBARROW MARKET FOR CONSTRUCTION, BY COUNTRY 2022 AND 2032(%)
- FIGURE 16. COMPARATIVE SHARE ANALYSIS OF WHEELBARROW MARKET FOR INDUSTRIAL, BY COUNTRY 2022 AND 2032(%)
- FIGURE 17. COMPARATIVE SHARE ANALYSIS OF WHEELBARROW MARKET FOR GARDENING, BY COUNTRY 2022 AND 2032(%)
- FIGURE 18. COMPARATIVE SHARE ANALYSIS OF WHEELBARROW MARKET FOR AGRICULTURE AND LIVESTOCK, BY COUNTRY 2022 AND 2032(%)
- FIGURE 19. COMPARATIVE SHARE ANALYSIS OF WHEELBARROW MARKET FOR OTHERS, BY COUNTRY 2022 AND 2032(%)
- FIGURE 20. WHEELBARROW MARKET, BY SALES CHANNEL, 2022(%)
- FIGURE 21. COMPARATIVE SHARE ANALYSIS OF WHEELBARROW MARKET FOR ONLINE, BY COUNTRY 2022 AND 2032(%)
- FIGURE 22. COMPARATIVE SHARE ANALYSIS OF WHEELBARROW MARKET FOR OFFLINE, BY COUNTRY 2022 AND 2032(%)
- FIGURE 23. WHEELBARROW MARKET BY REGION, 2022
- FIGURE 24. U.S. WHEELBARROW MARKET, 2022-2032 ($MILLION)
- FIGURE 25. CANADA WHEELBARROW MARKET, 2022-2032 ($MILLION)
- FIGURE 26. MEXICO WHEELBARROW MARKET, 2022-2032 ($MILLION)
- FIGURE 27. GERMANY WHEELBARROW MARKET, 2022-2032 ($MILLION)
- FIGURE 28. UK WHEELBARROW MARKET, 2022-2032 ($MILLION)
- FIGURE 29. FRANCE WHEELBARROW MARKET, 2022-2032 ($MILLION)
- FIGURE 30. ITALY WHEELBARROW MARKET, 2022-2032 ($MILLION)
- FIGURE 31. REST OF EUROPE WHEELBARROW MARKET, 2022-2032 ($MILLION)
- FIGURE 32. CHINA WHEELBARROW MARKET, 2022-2032 ($MILLION)
- FIGURE 33. JAPAN WHEELBARROW MARKET, 2022-2032 ($MILLION)
- FIGURE 34. SOUTH KOREA WHEELBARROW MARKET, 2022-2032 ($MILLION)
- FIGURE 35. INDIA WHEELBARROW MARKET, 2022-2032 ($MILLION)
- FIGURE 36. REST OF ASIA-PACIFIC WHEELBARROW MARKET, 2022-2032 ($MILLION)
- FIGURE 37. LATIN AMERICA WHEELBARROW MARKET, 2022-2032 ($MILLION)
- FIGURE 38. MIDDLE EAST WHEELBARROW MARKET, 2022-2032 ($MILLION)
- FIGURE 39. AFRICA WHEELBARROW MARKET, 2022-2032 ($MILLION)
- FIGURE 40. TOP WINNING STRATEGIES, BY YEAR
- FIGURE 41. TOP WINNING STRATEGIES, BY DEVELOPMENT
- FIGURE 42. TOP WINNING STRATEGIES, BY COMPANY
- FIGURE 43. PRODUCT MAPPING OF TOP 10 PLAYERS
- FIGURE 44. COMPETITIVE DASHBOARD
- FIGURE 45. COMPETITIVE HEATMAP: WHEELBARROW MARKET
- FIGURE 46. TOP PLAYER POSITIONING, 2022
- FIGURE 47. STANLEY: NET REVENUE, 2020-2022 ($MILLION)
- FIGURE 48. STANLEY: RESEARCH & DEVELOPMENT EXPENDITURE, 2020-2022 ($MILLION)
- FIGURE 49. STANLEY: REVENUE SHARE BY SEGMENT, 2022 (%)
- FIGURE 50. STANLEY: REVENUE SHARE BY REGION, 2022 (%)
The global wheelbarrow market was valued at $743.4 million in 2022, and is projected to reach $1,180.96 million by 2032, registering a CAGR of 4.6% from 2023 to 2032. Gardeners and construction workers use wheelbarrows as a means of conveyance to move small goods. A wheelbarrow is a hand-driven vehicle with one or more wheels that is intended to be pushed or directed by a single person using two handles at the rear of the vehicle.
Emerging markets such as Asia-Pacific, Latin America, and Africa, have witnessed a rise in population, economic growth, and urbanization. The population in Asia-Pacific and Africa has increased at a rapid pace, thus creating a surge in demand for housing accommodation. Most of the countries in these two regions are emerging nations and are experiencing strong economic growth. The progress of the economy in the emerging country fuels the growth of commercial, industrial, corporate, and residential properties. The governments of emerging countries look forward to improving the infrastructure by taking steps to improve the roadways, waterworks, sanitation, and offer positive experiences to the citizen by building parks, health centers, and community centers. For instance, the Brazilian government invested $167.3 million for 2021 for the development of the infrastructure. The growth of emerging countries has fueled the need of wheelbarrow for material handling. The rise in awareness about the benefit of wheelbarrow and increase in investment by the governments in infrastructure development are expected to drive the market growth.
In addition, due to their high strength, wheelbarrow machines are often composed of steel and plastic materials. As a result, market participants find it challenging to maintain profitability and set their budgets when steel prices fluctuate. For instance, since March 2020, the cost of hot-rolled steel in the U.S. has climbed by more than 215%, to $1,825. Prior to that, in 2017, its cost was in the $500-$800 range. In addition, metal costs have doubled since COVID-19. These swings are a key factor that limit the expansion of the wheelbarrow market.
The construction and agriculture industries have grown as a result of increased urbanization and industrialization of developing nations. In addition, the market is majorly driven by rise in demand for infrastructure and construction projects due to growth in population. Building of new infrastructure such as, roads, railways, tunnels, residential & non-residential construction, and mining, has become necessary as a result of the ongoing development of industries. Wheelbarrows make it easier to transport materials from one location to another. This increased the need for wheelbarrows, which presents a significant opportunity for the market's expansion in emerging nations.
The wheelbarrow market is segmented on the basis of wheel, application, sales channel, and region. By wheel, the market is divided into single, double, and multi. By application, the market is classified into construction, industrial, gardening, agriculture & livestock, and others. By sales channel, the market is bifurcated into online and offline. Region wise, the market is analyzed across North America (the U.S., Canada, and Mexico), Europe (the UK, France, Germany, Italy, and rest of Europe), Asia-Pacific (China, Japan, India, South Korea, and rest of Asia-Pacific), and LAMEA (Latin America, the Middle East, and Africa).
Competition analysis
The major players profiled in the wheelbarrow market include: Bullbarrow, Gorilla carts, Griffin Bros Truck & Equipment, Haemmerlin Ltd., Qingdao Taifa Group, QINGDAO XINJIANG HANDTRUCK CO.,LTD, Silvan, Stanley, The Walsall Wheelbarrow Co Ltd. and Wolverine Products. Major companies in the market have adopted various developmental strategies such as product launch to offer better products and services to customers in the wheelbarrow markets.
Key Benefits For Stakeholders
- This report provides a quantitative analysis of the market segments, current trends, estimations, and dynamics of the wheelbarrow market analysis from 2022 to 2032 to identify the prevailing wheelbarrow market opportunities.
- The market research is offered along with information related to key drivers, restraints, and opportunities.
- Porter's five forces analysis highlights the potency of buyers and suppliers to enable stakeholders make profit-oriented business decisions and strengthen their supplier-buyer network.
- In-depth analysis of the wheelbarrow market segmentation assists to determine the prevailing market opportunities.
- Major countries in each region are mapped according to their revenue contribution to the global market.
- Market player positioning facilitates benchmarking and provides a clear understanding of the present position of the market players.
- The report includes the analysis of the regional as well as global wheelbarrow market trends, key players, market segments, application areas, and market growth strategies.
Key Market Segments
By Wheel
- Single
- Double
- Multi
By Application
- Construction
- Industrial
- Gardening
- Agriculture and Livestock
- Others
By Sales Channel
- Online
- Offline
By Region
- North America
- U.S.
- Canada
- Mexico
- Europe
- Germany
- UK
- France
- Italy
- Rest of Europe
- Asia-Pacific
- China
- Japan
- South Korea
- India
- Rest of Asia-Pacific
- LAMEA
- Latin America
- Middle East
- Africa
Key Market Players:
- Bullbarrow
- Gorilla Carts
- Griffin Bros Truck & Equipment
- Haemmerlin
- Qingdao Taifa Group
- QINGDAO XINJIANG HANDTRUCK CO., LTD
- SILVAN Australia Pty Ltd.
- Stanley
- The Walsall Wheelbarrow Co Ltd.
- Wolverine Products
TABLE OF CONTENTS
CHAPTER 1: INTRODUCTION
- 1.1. Report description
- 1.2. Key market segments
- 1.3. Key benefits to the stakeholders
- 1.4. Research Methodology
- 1.4.1. Primary research
- 1.4.2. Secondary research
- 1.4.3. Analyst tools and models
CHAPTER 2: EXECUTIVE SUMMARY
- 2.1. CXO Perspective
CHAPTER 3: MARKET OVERVIEW
- 3.1. Market definition and scope
- 3.2. Key findings
- 3.2.1. Top impacting factors
- 3.2.2. Top investment pockets
- 3.3. Porter's five forces analysis
- 3.3.1. Bargaining power of suppliers
- 3.3.2. Bargaining power of buyers
- 3.3.3. Threat of substitutes
- 3.3.4. Threat of new entrants
- 3.3.5. Intensity of rivalry
- 3.4. Market dynamics
- 3.4.1. Drivers
- 3.4.1.1. Rise in the construction industry, and rapid urbanization.
- 3.4.1.2. Rise in demand from the agriculture industry
- 3.4.1.3. Growth in demand in e-commerce and online sales
- 3.4.1. Drivers
- 3.4.2. Restraints
- 3.4.2.1. Fluctuating prices of raw materials.
- 3.4.3. Opportunities
- 3.4.3.1. Rapid urbanization and industrialization of emerging countries.
- 3.5. COVID-19 Impact Analysis on the market
CHAPTER 4: WHEELBARROW MARKET, BY WHEEL
- 4.1. Overview
- 4.1.1. Market size and forecast
- 4.2. Single
- 4.2.1. Key market trends, growth factors and opportunities
- 4.2.2. Market size and forecast, by region
- 4.2.3. Market share analysis by country
- 4.3. Double
- 4.3.1. Key market trends, growth factors and opportunities
- 4.3.2. Market size and forecast, by region
- 4.3.3. Market share analysis by country
- 4.4. Multi
- 4.4.1. Key market trends, growth factors and opportunities
- 4.4.2. Market size and forecast, by region
- 4.4.3. Market share analysis by country
CHAPTER 5: WHEELBARROW MARKET, BY APPLICATION
- 5.1. Overview
- 5.1.1. Market size and forecast
- 5.2. Construction
- 5.2.1. Key market trends, growth factors and opportunities
- 5.2.2. Market size and forecast, by region
- 5.2.3. Market share analysis by country
- 5.3. Industrial
- 5.3.1. Key market trends, growth factors and opportunities
- 5.3.2. Market size and forecast, by region
- 5.3.3. Market share analysis by country
- 5.4. Gardening
- 5.4.1. Key market trends, growth factors and opportunities
- 5.4.2. Market size and forecast, by region
- 5.4.3. Market share analysis by country
- 5.5. Agriculture and Livestock
- 5.5.1. Key market trends, growth factors and opportunities
- 5.5.2. Market size and forecast, by region
- 5.5.3. Market share analysis by country
- 5.6. Others
- 5.6.1. Key market trends, growth factors and opportunities
- 5.6.2. Market size and forecast, by region
- 5.6.3. Market share analysis by country
CHAPTER 6: WHEELBARROW MARKET, BY SALES CHANNEL
- 6.1. Overview
- 6.1.1. Market size and forecast
- 6.2. Online
- 6.2.1. Key market trends, growth factors and opportunities
- 6.2.2. Market size and forecast, by region
- 6.2.3. Market share analysis by country
- 6.3. Offline
- 6.3.1. Key market trends, growth factors and opportunities
- 6.3.2. Market size and forecast, by region
- 6.3.3. Market share analysis by country
CHAPTER 7: WHEELBARROW MARKET, BY REGION
- 7.1. Overview
- 7.1.1. Market size and forecast By Region
- 7.2. North America
- 7.2.1. Key trends and opportunities
- 7.2.2. Market size and forecast, by Wheel
- 7.2.3. Market size and forecast, by Application
- 7.2.4. Market size and forecast, by Sales Channel
- 7.2.5. Market size and forecast, by country
- 7.2.5.1. U.S.
- 7.2.5.1.1. Key market trends, growth factors and opportunities
- 7.2.5.1.2. Market size and forecast, by Wheel
- 7.2.5.1.3. Market size and forecast, by Application
- 7.2.5.1.4. Market size and forecast, by Sales Channel
- 7.2.5.2. Canada
- 7.2.5.2.1. Key market trends, growth factors and opportunities
- 7.2.5.2.2. Market size and forecast, by Wheel
- 7.2.5.2.3. Market size and forecast, by Application
- 7.2.5.2.4. Market size and forecast, by Sales Channel
- 7.2.5.3. Mexico
- 7.2.5.3.1. Key market trends, growth factors and opportunities
- 7.2.5.3.2. Market size and forecast, by Wheel
- 7.2.5.3.3. Market size and forecast, by Application
- 7.2.5.3.4. Market size and forecast, by Sales Channel
- 7.3. Europe
- 7.3.1. Key trends and opportunities
- 7.3.2. Market size and forecast, by Wheel
- 7.3.3. Market size and forecast, by Application
- 7.3.4. Market size and forecast, by Sales Channel
- 7.3.5. Market size and forecast, by country
- 7.3.5.1. Germany
- 7.3.5.1.1. Key market trends, growth factors and opportunities
- 7.3.5.1.2. Market size and forecast, by Wheel
- 7.3.5.1.3. Market size and forecast, by Application
- 7.3.5.1.4. Market size and forecast, by Sales Channel
- 7.3.5.2. UK
- 7.3.5.2.1. Key market trends, growth factors and opportunities
- 7.3.5.2.2. Market size and forecast, by Wheel
- 7.3.5.2.3. Market size and forecast, by Application
- 7.3.5.2.4. Market size and forecast, by Sales Channel
- 7.3.5.3. France
- 7.3.5.3.1. Key market trends, growth factors and opportunities
- 7.3.5.3.2. Market size and forecast, by Wheel
- 7.3.5.3.3. Market size and forecast, by Application
- 7.3.5.3.4. Market size and forecast, by Sales Channel
- 7.3.5.4. Italy
- 7.3.5.4.1. Key market trends, growth factors and opportunities
- 7.3.5.4.2. Market size and forecast, by Wheel
- 7.3.5.4.3. Market size and forecast, by Application
- 7.3.5.4.4. Market size and forecast, by Sales Channel
- 7.3.5.5. Rest of Europe
- 7.3.5.5.1. Key market trends, growth factors and opportunities
- 7.3.5.5.2. Market size and forecast, by Wheel
- 7.3.5.5.3. Market size and forecast, by Application
- 7.3.5.5.4. Market size and forecast, by Sales Channel
- 7.4. Asia-Pacific
- 7.4.1. Key trends and opportunities
- 7.4.2. Market size and forecast, by Wheel
- 7.4.3. Market size and forecast, by Application
- 7.4.4. Market size and forecast, by Sales Channel
- 7.4.5. Market size and forecast, by country
- 7.4.5.1. China
- 7.4.5.1.1. Key market trends, growth factors and opportunities
- 7.4.5.1.2. Market size and forecast, by Wheel
- 7.4.5.1.3. Market size and forecast, by Application
- 7.4.5.1.4. Market size and forecast, by Sales Channel
- 7.4.5.2. Japan
- 7.4.5.2.1. Key market trends, growth factors and opportunities
- 7.4.5.2.2. Market size and forecast, by Wheel
- 7.4.5.2.3. Market size and forecast, by Application
- 7.4.5.2.4. Market size and forecast, by Sales Channel
- 7.4.5.3. South Korea
- 7.4.5.3.1. Key market trends, growth factors and opportunities
- 7.4.5.3.2. Market size and forecast, by Wheel
- 7.4.5.3.3. Market size and forecast, by Application
- 7.4.5.3.4. Market size and forecast, by Sales Channel
- 7.4.5.4. India
- 7.4.5.4.1. Key market trends, growth factors and opportunities
- 7.4.5.4.2. Market size and forecast, by Wheel
- 7.4.5.4.3. Market size and forecast, by Application
- 7.4.5.4.4. Market size and forecast, by Sales Channel
- 7.4.5.5. Rest of Asia-Pacific
- 7.4.5.5.1. Key market trends, growth factors and opportunities
- 7.4.5.5.2. Market size and forecast, by Wheel
- 7.4.5.5.3. Market size and forecast, by Application
- 7.4.5.5.4. Market size and forecast, by Sales Channel
- 7.5. LAMEA
- 7.5.1. Key trends and opportunities
- 7.5.2. Market size and forecast, by Wheel
- 7.5.3. Market size and forecast, by Application
- 7.5.4. Market size and forecast, by Sales Channel
- 7.5.5. Market size and forecast, by country
- 7.5.5.1. Latin America
- 7.5.5.1.1. Key market trends, growth factors and opportunities
- 7.5.5.1.2. Market size and forecast, by Wheel
- 7.5.5.1.3. Market size and forecast, by Application
- 7.5.5.1.4. Market size and forecast, by Sales Channel
- 7.5.5.2. Middle East
- 7.5.5.2.1. Key market trends, growth factors and opportunities
- 7.5.5.2.2. Market size and forecast, by Wheel
- 7.5.5.2.3. Market size and forecast, by Application
- 7.5.5.2.4. Market size and forecast, by Sales Channel
- 7.5.5.3. Africa
- 7.5.5.3.1. Key market trends, growth factors and opportunities
- 7.5.5.3.2. Market size and forecast, by Wheel
- 7.5.5.3.3. Market size and forecast, by Application
- 7.5.5.3.4. Market size and forecast, by Sales Channel
CHAPTER 8: COMPETITIVE LANDSCAPE
- 8.1. Introduction
- 8.2. Top winning strategies
- 8.3. Product Mapping of Top 10 Player
- 8.4. Competitive Dashboard
- 8.5. Competitive Heatmap
- 8.6. Top player positioning, 2022
CHAPTER 9: COMPANY PROFILES
- 9.1. Bullbarrow
- 9.1.1. Company overview
- 9.1.2. Key Executives
- 9.1.3. Company snapshot
- 9.1.4. Operating business segments
- 9.1.5. Product portfolio
- 9.2. Gorilla Carts
- 9.2.1. Company overview
- 9.2.2. Key Executives
- 9.2.3. Company snapshot
- 9.2.4. Operating business segments
- 9.2.5. Product portfolio
- 9.3. Griffin Bros Truck & Equipment
- 9.3.1. Company overview
- 9.3.2. Key Executives
- 9.3.3. Company snapshot
- 9.3.4. Operating business segments
- 9.3.5. Product portfolio
- 9.4. Haemmerlin
- 9.4.1. Company overview
- 9.4.2. Key Executives
- 9.4.3. Company snapshot
- 9.4.4. Operating business segments
- 9.4.5. Product portfolio
- 9.5. Qingdao Taifa Group
- 9.5.1. Company overview
- 9.5.2. Key Executives
- 9.5.3. Company snapshot
- 9.5.4. Operating business segments
- 9.5.5. Product portfolio
- 9.6. QINGDAO XINJIANG HANDTRUCK CO., LTD
- 9.6.1. Company overview
- 9.6.2. Key Executives
- 9.6.3. Company snapshot
- 9.6.4. Operating business segments
- 9.6.5. Product portfolio
- 9.7. SILVAN Australia Pty Ltd.
- 9.7.1. Company overview
- 9.7.2. Key Executives
- 9.7.3. Company snapshot
- 9.7.4. Operating business segments
- 9.7.5. Product portfolio
- 9.8. Stanley
- 9.8.1. Company overview
- 9.8.2. Key Executives
- 9.8.3. Company snapshot
- 9.8.4. Operating business segments
- 9.8.5. Product portfolio
- 9.8.6. Business performance
- 9.9. The Walsall Wheelbarrow Co Ltd.
- 9.9.1. Company overview
- 9.9.2. Key Executives
- 9.9.3. Company snapshot
- 9.9.4. Operating business segments
- 9.9.5. Product portfolio
- 9.10. Wolverine Products
- 9.10.1. Company overview
- 9.10.2. Key Executives
- 9.10.3. Company snapshot
- 9.10.4. Operating business segments
- 9.10.5. Product portfolio