 |
市場調査レポート
商品コード
1298379
有機化学品市場:製品別、最終用途産業別:世界の機会分析と産業予測、2023-2032年Organic Chemicals Market By Product, By End Use Industry : Global Opportunity Analysis and Industry Forecast, 2023-2032 |
||||||

| 有機化学品市場:製品別、最終用途産業別:世界の機会分析と産業予測、2023-2032年 |
|
出版日: 2023年04月01日
発行: Allied Market Research
ページ情報: 英文 605 Pages
納期: 2~3営業日
|
- 全表示
- 概要
- 図表
- 目次
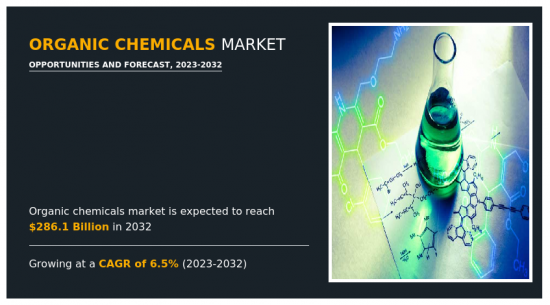
有機化学品市場は2022年に1,532億米ドルと評価され、2023年から2032年までのCAGRは6.5%を示し、2032年には2,860億米ドルに達すると推定されています。
有機化学物質または化合物は、炭素-水素結合を含む特別なカテゴリーの化合物です。炭素は、異なる炭素水素結合を持つ数多くの有機化合物やその誘導体を形成することを可能にするカテネーションと呼ばれるユニークな性質を示します。これらの化学物質は、天然に入手することができますし、同様に人工的なプロセスによって生成することもできます。有機化学物質は、香料、芳香剤、各種アルコールに分類され、飲食品、医薬品、化粧品、肥料などの産業で広く使用されています。
セルフグルーミング活動に対する意識の高まりは、脂肪族炭化水素がベビーオイル、ベビーシャンプー、ヘアコンディショナー、日焼け止め、クリーム&ローションなど幅広いパーソナルケア製品の製造に広く使用されているパーソナルケア分野の大幅な需要増につながっています。これは、脂肪族炭化水素の有機化学品市場の成長を担う主要な要因の一つとして機能する可能性があります。さらに、イタリア、日本などの国々における老人人口の増加が、脂肪族炭化水素ベースのアンチエイジングクリームの需要を促進しています。このような要因により、パーソナルケア&化粧品用途の有機化学製品の売上が増加し、市場の成長が促進されると予想されます。
さらに、可処分所得の増加とファッション意識の高まりが相まって、ケトン類が繊維セクターの溶剤として広く使用されている繊維セクターが大きな需要を目の当たりにすることにつながっています。この要因は、ケトン系有機化学品市場の成長をもたらす主要な促進要因の1つとして作用する可能性があります。さらに、幅広い消費財に対する需要の高まりは、先進経済諸国と新興経済諸国の両方で急速な工業化につながっており、有機アルデヒドはさまざまな工業用化学薬品、染料、溶剤の製造に使用されています。このことが、予測期間中のアルデヒド需要を促進する可能性があります。
有機化学品の最大の利点のひとつは、その大部分が植物、動物、石炭、石油、木材などの天然資源から製造できることです。これらは世界中のほぼすべての地域で容易に入手できます。このため、有機化学品の入手が容易になっています。さらに、企業の社会的責任(CSR)活動の増加や、無害な化学物質を使用する意識の高まりなどの要因が、いくつかの最終用途部門の間で有機化学物質の人気を急上昇させています。このことが、予測期間中の有機化学品の需要を促進する可能性があります。
しかし、アルミニウム鋳造には、金属の溶解、溶融金属の金型キャビティへの移送、溶融金属の凝固など、いくつかの工程が含まれます。これらの工程は比較的大量の熱エネルギーを必要とします。さらに、プロセス全体は、高温のアプリケーションで動作するように製造されたさまざまな高度な装置で構成されています。これらの要因がアルミニウム鋳造を高価なプロセスにしており、その結果、投資の可能性が低いメーカーがアルミニウム鋳造市場に参入するのを抑制する可能性があります。したがって、アルミニウム鋳物の生産に関連する高い投資コストは、予測期間中の市場成長を妨げる可能性があります。
これとは逆に、有機化学品産業は技術主導型であるため、研究開発への支出が莫大であり、これがバリューチェーンにおいて重要な役割を果たしています。革新的な用途に関するこうした研究開発投資や生産コストの削減は、業界プレーヤーに多くの機会をもたらすと期待されています。インドのような新興経済諸国における製造業の奨励を目的とした政府の取り組みは、有機化学品市場開拓の新たな機会を開くと予想されます。
目次
第1章 イントロダクション
第2章 エグゼクティブサマリー
第3章 市場概要
- 市場の定義と範囲
- 主な調査結果
- 影響要因
- 主な投資機会
- ポーターのファイブフォース分析
- 供給企業の交渉力
- 買い手の交渉力
- 代替品の脅威
- 新規参入業者の脅威
- 競合の激しさ
- 市場力学
- 促進要因
- 飲食品業界における有機化学製品の採用増加
- 製薬業界からの旺盛な需要
- 建築分野における塗料・コーティング需要の増加
- 天然原料
- 阻害要因
- 有機化学物質のコスト高
- 機会
- プレーヤーの統合
- 技術主導の研究開発活動の活発化
- 促進要因
- COVID-19市場への影響分析
- 主要規制分析
- 特許情勢
- 価格分析
- 規制ガイドライン
- バリューチェーン分析
第4章 有機化学品市場:製品別
- 概要
- 市場規模と予測
- 酸
- 主要市場動向、成長要因、機会
- 市場規模・予測:地域別
- 市場シェア分析:国別
- 酸、有機化学品市場:タイプ別
- 酢酸の市場規模・予測:地域別
- 酢酸の市場規模・予測:国別
- 乳酸の市場規模・予測:地域別
- 乳酸の市場規模・予測:国別
- クエン酸の市場規模・予測:地域別
- クエン酸の市場規模・予測:国別
- その他の市場規模・予測:地域別
- その他の市場規模・予測:国別
- アルコールとエーテル
- 主要市場動向、成長要因、機会
- 市場規模・予測:地域別
- 市場シェア分析:国別
- アミンとアミド
- 主な市場動向、成長要因、機会
- 市場規模・予測:地域別
- 市場シェア分析:国別
- アルデヒドとケトン
- 主な市場動向、成長要因、機会
- 市場規模・予測:地域別
- 市場シェア分析:国別
- その他
- 主な市場動向、成長要因、機会
- 市場規模・予測:地域別
- 市場シェア分析:国別
第5章 有機化学品市場:最終用途産業別
- 概要
- 市場規模と予測
- 医薬品
- 主要市場動向、成長要因、機会
- 市場規模・予測:地域別
- 市場シェア分析:国別
- 農薬
- 主要市場動向、成長要因、機会
- 市場規模・予測:地域別
- 市場シェア分析:国別
- パーソナルケアと化粧品
- 主な市場動向、成長要因、機会
- 市場規模・予測:地域別
- 市場シェア分析:国別
- 飲食品
- 主な市場動向、成長要因、機会
- 市場規模・予測:地域別
- 市場シェア分析:国別
- その他
- 主な市場動向、成長要因、機会
- 市場規模・予測:地域別
- 市場シェア分析:国別
第6章 有機化学品市場:地域別
- 概要
- 市場規模・予測:地域別
- 北米
- 主要動向と機会
- 市場規模・予測:製品別
- 北米の酸、有機化学品市場:タイプ別
- 市場規模・予測:最終用途産業別
- 市場規模・予測:国別
- 米国
- 主要市場動向、成長要因、機会
- 市場規模・予測:製品別
- 米国の酸、有機化学品市場:タイプ別
- 市場規模・予測:最終用途産業別
- カナダ
- 主要市場動向、成長要因、機会
- 市場規模・予測:製品別
- カナダの酸、有機化学品市場:タイプ別
- 市場規模・予測:最終用途産業別
- メキシコ
- 主要市場動向、成長要因、機会
- 市場規模・予測:製品別
- メキシコの酸、有機化学品市場:タイプ別
- 市場規模・予測:最終用途産業別
- 欧州
- 主要動向と機会
- 市場規模・予測:製品別
- 欧州酸、有機化学品市場:タイプ別
- 市場規模・予測:最終用途産業別
- 市場規模・予測:国別
- ドイツ
- 主要市場動向、成長要因、機会
- 市場規模・予測:製品別
- ドイツの酸、有機化学品市場:タイプ別
- 市場規模・予測:最終用途産業別
- 英国
- 主要市場動向、成長要因、機会
- 市場規模・予測:製品別
- 英国の酸、有機化学品市場:タイプ別
- 市場規模・予測:最終用途産業別
- フランス
- 主要市場動向、成長要因、機会
- 市場規模・予測:製品別
- フランスの酸、有機化学品市場:タイプ別
- 市場規模・予測:最終用途産業別
- スペイン
- 主要市場動向、成長要因、機会
- 市場規模・予測:製品別
- スペインの酸、有機化学品市場:タイプ別
- 市場規模・予測:最終用途産業別
- イタリア
- 主要市場動向、成長要因、機会
- 市場規模・予測:製品別
- イタリアの酸、有機化学品市場:タイプ別
- 市場規模・予測:最終用途産業別
- その他欧州
- 主要市場動向、成長要因、機会
- 市場規模・予測:製品別
- その他欧州の酸、有機化学品市場:タイプ別
- 市場規模・予測:最終用途産業別
- アジア太平洋
- 主要動向と機会
- 市場規模・予測:製品別
- アジア太平洋の酸、有機化学品市場:タイプ別
- 市場規模・予測:最終用途産業別
- 市場規模・予測:国別
- 中国
- 主要市場動向、成長要因、機会
- 市場規模・予測:製品別
- 中国の酸、有機化学品市場:タイプ別
- 市場規模・予測:最終用途産業別
- インド
- 主要市場動向、成長要因、機会
- 市場規模・予測:製品別
- インドの酸、有機化学品市場:タイプ別
- 市場規模・予測:最終用途産業別
- 日本
- 主要市場動向、成長要因、機会
- 市場規模・予測:製品別
- 日本の酸、有機化学品市場:タイプ別
- 市場規模・予測:最終用途産業別
- 韓国
- 主要市場動向、成長要因、機会
- 市場規模・予測:製品別
- 韓国の酸、有機化学品市場:タイプ別
- 市場規模・予測:最終用途産業別
- オーストラリア
- 主要市場動向、成長要因、機会
- 市場規模・予測:製品別
- オーストラリア酸、有機化学品市場:タイプ別
- 市場規模・予測:最終用途産業別
- その他アジア太平洋地域
- 主要市場動向、成長要因、機会
- 市場規模・予測:製品別
- その他アジア太平洋地域の酸、有機化学品市場:タイプ別
- 市場規模・予測:最終用途産業別
- ラテンアメリカ・中東・アフリカ
- 主要動向と機会
- 市場規模・予測:製品別
- LAMEAの酸、有機化学品市場:タイプ別
- 市場規模・予測:最終用途産業別
- 市場規模・予測:国別
- ブラジル
- 主要市場動向、成長要因、機会
- 市場規模・予測:製品別
- ブラジルの酸、有機化学品市場:タイプ別
- 市場規模・予測:最終用途産業別
- サウジアラビア
- 主要市場動向、成長要因、機会
- 市場規模・予測:製品別
- サウジアラビアの酸、有機化学品市場:タイプ別
- 市場規模・予測:最終用途産業別
- 南アフリカ共和国
- 主要市場動向、成長要因、機会
- 市場規模・予測:製品別
- 南アフリカの酸、有機化学品市場:タイプ別
- 市場規模・予測:最終用途産業別
- その他の地域
- 主要市場動向、成長要因、機会
- 市場規模・予測:製品別
- LAMEAのその他の地域の酸、有機化学品市場:タイプ別
- 市場規模・予測:最終用途産業別
第7章 競合情勢
- イントロダクション
- 主要成功戦略
- 主要10社の製品マッピング
- 競合ダッシュボード
- 競合ヒートマップ
- トップ企業のポジショニング、2022年
第8章 企業プロファイル
- TCI America
- BASF SE
- Dow
- akzonobel
- Cargill
- vinati organics limited
- Hindustan Organic Chemicals Limited
- Royal Dutch Shell plc
- neogen chemicals limited
- CHEMPLAST SANMAR LIMITED
LIST OF TABLES
- TABLE 01. GLOBAL ORGANIC CHEMICALS MARKET, BY PRODUCT, 2022-2032 ($MILLION)
- TABLE 02. GLOBAL ORGANIC CHEMICALS MARKET, BY PRODUCT, 2022-2032 (KILOTON)
- TABLE 03. ORGANIC CHEMICALS MARKET FOR ACIDS, BY REGION, 2022-2032 ($MILLION)
- TABLE 04. ORGANIC CHEMICALS MARKET FOR ACIDS, BY REGION, 2022-2032 (KILOTON)
- TABLE 05. GLOBAL ACIDS ORGANIC CHEMICALS MARKET, BY TYPE, 2022-2032 ($MILLION)
- TABLE 06. GLOBAL ACIDS ORGANIC CHEMICALS MARKET, BY TYPE, 2022-2032 (KILOTON)
- TABLE 07. ORGANIC CHEMICALS MARKET FOR ACETIC ACID, BY REGION, 2022-2032 ($MILLION)
- TABLE 08. ORGANIC CHEMICALS MARKET FOR ACETIC ACID, BY REGION, 2022-2032 (KILOTON)
- TABLE 09. ORGANIC CHEMICALS MARKET FOR LACTIC ACID, BY REGION, 2022-2032 ($MILLION)
- TABLE 10. ORGANIC CHEMICALS MARKET FOR LACTIC ACID, BY REGION, 2022-2032 (KILOTON)
- TABLE 11. ORGANIC CHEMICALS MARKET FOR CITRIC ACID, BY REGION, 2022-2032 ($MILLION)
- TABLE 12. ORGANIC CHEMICALS MARKET FOR CITRIC ACID, BY REGION, 2022-2032 (KILOTON)
- TABLE 13. ORGANIC CHEMICALS MARKET FOR OTHERS, BY REGION, 2022-2032 ($MILLION)
- TABLE 14. ORGANIC CHEMICALS MARKET FOR OTHERS, BY REGION, 2022-2032 (KILOTON)
- TABLE 15. ORGANIC CHEMICALS MARKET FOR ALCOHOLS AND ETHERS, BY REGION, 2022-2032 ($MILLION)
- TABLE 16. ORGANIC CHEMICALS MARKET FOR ALCOHOLS AND ETHERS, BY REGION, 2022-2032 (KILOTON)
- TABLE 17. ORGANIC CHEMICALS MARKET FOR AMINES AND AMIDES, BY REGION, 2022-2032 ($MILLION)
- TABLE 18. ORGANIC CHEMICALS MARKET FOR AMINES AND AMIDES, BY REGION, 2022-2032 (KILOTON)
- TABLE 19. ORGANIC CHEMICALS MARKET FOR ALDEHYDES AND KETONES, BY REGION, 2022-2032 ($MILLION)
- TABLE 20. ORGANIC CHEMICALS MARKET FOR ALDEHYDES AND KETONES, BY REGION, 2022-2032 (KILOTON)
- TABLE 21. ORGANIC CHEMICALS MARKET FOR OTHERS, BY REGION, 2022-2032 ($MILLION)
- TABLE 22. ORGANIC CHEMICALS MARKET FOR OTHERS, BY REGION, 2022-2032 (KILOTON)
- TABLE 23. GLOBAL ORGANIC CHEMICALS MARKET, BY END USE INDUSTRY, 2022-2032 ($MILLION)
- TABLE 24. GLOBAL ORGANIC CHEMICALS MARKET, BY END USE INDUSTRY, 2022-2032 (KILOTON)
- TABLE 25. ORGANIC CHEMICALS MARKET FOR PHARMACEUTICALS, BY REGION, 2022-2032 ($MILLION)
- TABLE 26. ORGANIC CHEMICALS MARKET FOR PHARMACEUTICALS, BY REGION, 2022-2032 (KILOTON)
- TABLE 27. ORGANIC CHEMICALS MARKET FOR AGROCHEMICALS, BY REGION, 2022-2032 ($MILLION)
- TABLE 28. ORGANIC CHEMICALS MARKET FOR AGROCHEMICALS, BY REGION, 2022-2032 (KILOTON)
- TABLE 29. ORGANIC CHEMICALS MARKET FOR PERSONAL CARE AND COSMETICS, BY REGION, 2022-2032 ($MILLION)
- TABLE 30. ORGANIC CHEMICALS MARKET FOR PERSONAL CARE AND COSMETICS, BY REGION, 2022-2032 (KILOTON)
- TABLE 31. ORGANIC CHEMICALS MARKET FOR FOOD AND BEVERAGES, BY REGION, 2022-2032 ($MILLION)
- TABLE 32. ORGANIC CHEMICALS MARKET FOR FOOD AND BEVERAGES, BY REGION, 2022-2032 (KILOTON)
- TABLE 33. ORGANIC CHEMICALS MARKET FOR OTHERS, BY REGION, 2022-2032 ($MILLION)
- TABLE 34. ORGANIC CHEMICALS MARKET FOR OTHERS, BY REGION, 2022-2032 (KILOTON)
- TABLE 35. ORGANIC CHEMICALS MARKET, BY REGION, 2022-2032 ($MILLION)
- TABLE 36. ORGANIC CHEMICALS MARKET, BY REGION, 2022-2032 (KILOTON)
- TABLE 37. NORTH AMERICA ORGANIC CHEMICALS MARKET, BY PRODUCT, 2022-2032 ($MILLION)
- TABLE 38. NORTH AMERICA ORGANIC CHEMICALS MARKET, BY PRODUCT, 2022-2032 (KILOTON)
- TABLE 39. NORTH AMERICA ACIDS ORGANIC CHEMICALS MARKET, BY TYPE, 2022-2032 ($MILLION)
- TABLE 40. NORTH AMERICA ACIDS ORGANIC CHEMICALS MARKET, BY TYPE, 2022-2032 (KILOTON)
- TABLE 41. NORTH AMERICA ORGANIC CHEMICALS MARKET, BY END USE INDUSTRY, 2022-2032 ($MILLION)
- TABLE 42. NORTH AMERICA ORGANIC CHEMICALS MARKET, BY END USE INDUSTRY, 2022-2032 (KILOTON)
- TABLE 43. NORTH AMERICA ORGANIC CHEMICALS MARKET, BY COUNTRY, 2022-2032 ($MILLION)
- TABLE 44. NORTH AMERICA ORGANIC CHEMICALS MARKET, BY COUNTRY, 2022-2032 (KILOTON)
- TABLE 45. U.S. ORGANIC CHEMICALS MARKET, BY PRODUCT, 2022-2032 ($MILLION)
- TABLE 46. U.S. ORGANIC CHEMICALS MARKET, BY PRODUCT, 2022-2032 (KILOTON)
- TABLE 47. U.S. ACIDS ORGANIC CHEMICALS MARKET, BY TYPE, 2022-2032 ($MILLION)
- TABLE 48. U.S. ACIDS ORGANIC CHEMICALS MARKET, BY TYPE, 2022-2032 (KILOTON)
- TABLE 49. U.S. ORGANIC CHEMICALS MARKET, BY END USE INDUSTRY, 2022-2032 ($MILLION)
- TABLE 50. U.S. ORGANIC CHEMICALS MARKET, BY END USE INDUSTRY, 2022-2032 (KILOTON)
- TABLE 51. CANADA ORGANIC CHEMICALS MARKET, BY PRODUCT, 2022-2032 ($MILLION)
- TABLE 52. CANADA ORGANIC CHEMICALS MARKET, BY PRODUCT, 2022-2032 (KILOTON)
- TABLE 53. CANADA ACIDS ORGANIC CHEMICALS MARKET, BY TYPE, 2022-2032 ($MILLION)
- TABLE 54. CANADA ACIDS ORGANIC CHEMICALS MARKET, BY TYPE, 2022-2032 (KILOTON)
- TABLE 55. CANADA ORGANIC CHEMICALS MARKET, BY END USE INDUSTRY, 2022-2032 ($MILLION)
- TABLE 56. CANADA ORGANIC CHEMICALS MARKET, BY END USE INDUSTRY, 2022-2032 (KILOTON)
- TABLE 57. MEXICO ORGANIC CHEMICALS MARKET, BY PRODUCT, 2022-2032 ($MILLION)
- TABLE 58. MEXICO ORGANIC CHEMICALS MARKET, BY PRODUCT, 2022-2032 (KILOTON)
- TABLE 59. MEXICO ACIDS ORGANIC CHEMICALS MARKET, BY TYPE, 2022-2032 ($MILLION)
- TABLE 60. MEXICO ACIDS ORGANIC CHEMICALS MARKET, BY TYPE, 2022-2032 (KILOTON)
- TABLE 61. MEXICO ORGANIC CHEMICALS MARKET, BY END USE INDUSTRY, 2022-2032 ($MILLION)
- TABLE 62. MEXICO ORGANIC CHEMICALS MARKET, BY END USE INDUSTRY, 2022-2032 (KILOTON)
- TABLE 63. EUROPE ORGANIC CHEMICALS MARKET, BY PRODUCT, 2022-2032 ($MILLION)
- TABLE 64. EUROPE ORGANIC CHEMICALS MARKET, BY PRODUCT, 2022-2032 (KILOTON)
- TABLE 65. EUROPE ACIDS ORGANIC CHEMICALS MARKET, BY TYPE, 2022-2032 ($MILLION)
- TABLE 66. EUROPE ACIDS ORGANIC CHEMICALS MARKET, BY TYPE, 2022-2032 (KILOTON)
- TABLE 67. EUROPE ORGANIC CHEMICALS MARKET, BY END USE INDUSTRY, 2022-2032 ($MILLION)
- TABLE 68. EUROPE ORGANIC CHEMICALS MARKET, BY END USE INDUSTRY, 2022-2032 (KILOTON)
- TABLE 69. EUROPE ORGANIC CHEMICALS MARKET, BY COUNTRY, 2022-2032 ($MILLION)
- TABLE 70. EUROPE ORGANIC CHEMICALS MARKET, BY COUNTRY, 2022-2032 (KILOTON)
- TABLE 71. GERMANY ORGANIC CHEMICALS MARKET, BY PRODUCT, 2022-2032 ($MILLION)
- TABLE 72. GERMANY ORGANIC CHEMICALS MARKET, BY PRODUCT, 2022-2032 (KILOTON)
- TABLE 73. GERMANY ACIDS ORGANIC CHEMICALS MARKET, BY TYPE, 2022-2032 ($MILLION)
- TABLE 74. GERMANY ACIDS ORGANIC CHEMICALS MARKET, BY TYPE, 2022-2032 (KILOTON)
- TABLE 75. GERMANY ORGANIC CHEMICALS MARKET, BY END USE INDUSTRY, 2022-2032 ($MILLION)
- TABLE 76. GERMANY ORGANIC CHEMICALS MARKET, BY END USE INDUSTRY, 2022-2032 (KILOTON)
- TABLE 77. UK ORGANIC CHEMICALS MARKET, BY PRODUCT, 2022-2032 ($MILLION)
- TABLE 78. UK ORGANIC CHEMICALS MARKET, BY PRODUCT, 2022-2032 (KILOTON)
- TABLE 79. UK ACIDS ORGANIC CHEMICALS MARKET, BY TYPE, 2022-2032 ($MILLION)
- TABLE 80. UK ACIDS ORGANIC CHEMICALS MARKET, BY TYPE, 2022-2032 (KILOTON)
- TABLE 81. UK ORGANIC CHEMICALS MARKET, BY END USE INDUSTRY, 2022-2032 ($MILLION)
- TABLE 82. UK ORGANIC CHEMICALS MARKET, BY END USE INDUSTRY, 2022-2032 (KILOTON)
- TABLE 83. FRANCE ORGANIC CHEMICALS MARKET, BY PRODUCT, 2022-2032 ($MILLION)
- TABLE 84. FRANCE ORGANIC CHEMICALS MARKET, BY PRODUCT, 2022-2032 (KILOTON)
- TABLE 85. FRANCE ACIDS ORGANIC CHEMICALS MARKET, BY TYPE, 2022-2032 ($MILLION)
- TABLE 86. FRANCE ACIDS ORGANIC CHEMICALS MARKET, BY TYPE, 2022-2032 (KILOTON)
- TABLE 87. FRANCE ORGANIC CHEMICALS MARKET, BY END USE INDUSTRY, 2022-2032 ($MILLION)
- TABLE 88. FRANCE ORGANIC CHEMICALS MARKET, BY END USE INDUSTRY, 2022-2032 (KILOTON)
- TABLE 89. SPAIN ORGANIC CHEMICALS MARKET, BY PRODUCT, 2022-2032 ($MILLION)
- TABLE 90. SPAIN ORGANIC CHEMICALS MARKET, BY PRODUCT, 2022-2032 (KILOTON)
- TABLE 91. SPAIN ACIDS ORGANIC CHEMICALS MARKET, BY TYPE, 2022-2032 ($MILLION)
- TABLE 92. SPAIN ACIDS ORGANIC CHEMICALS MARKET, BY TYPE, 2022-2032 (KILOTON)
- TABLE 93. SPAIN ORGANIC CHEMICALS MARKET, BY END USE INDUSTRY, 2022-2032 ($MILLION)
- TABLE 94. SPAIN ORGANIC CHEMICALS MARKET, BY END USE INDUSTRY, 2022-2032 (KILOTON)
- TABLE 95. ITALY ORGANIC CHEMICALS MARKET, BY PRODUCT, 2022-2032 ($MILLION)
- TABLE 96. ITALY ORGANIC CHEMICALS MARKET, BY PRODUCT, 2022-2032 (KILOTON)
- TABLE 97. ITALY ACIDS ORGANIC CHEMICALS MARKET, BY TYPE, 2022-2032 ($MILLION)
- TABLE 98. ITALY ACIDS ORGANIC CHEMICALS MARKET, BY TYPE, 2022-2032 (KILOTON)
- TABLE 99. ITALY ORGANIC CHEMICALS MARKET, BY END USE INDUSTRY, 2022-2032 ($MILLION)
- TABLE 100. ITALY ORGANIC CHEMICALS MARKET, BY END USE INDUSTRY, 2022-2032 (KILOTON)
- TABLE 101. REST OF EUROPE ORGANIC CHEMICALS MARKET, BY PRODUCT, 2022-2032 ($MILLION)
- TABLE 102. REST OF EUROPE ORGANIC CHEMICALS MARKET, BY PRODUCT, 2022-2032 (KILOTON)
- TABLE 103. REST OF EUROPE ACIDS ORGANIC CHEMICALS MARKET, BY TYPE, 2022-2032 ($MILLION)
- TABLE 104. REST OF EUROPE ACIDS ORGANIC CHEMICALS MARKET, BY TYPE, 2022-2032 (KILOTON)
- TABLE 105. REST OF EUROPE ORGANIC CHEMICALS MARKET, BY END USE INDUSTRY, 2022-2032 ($MILLION)
- TABLE 106. REST OF EUROPE ORGANIC CHEMICALS MARKET, BY END USE INDUSTRY, 2022-2032 (KILOTON)
- TABLE 107. ASIA-PACIFIC ORGANIC CHEMICALS MARKET, BY PRODUCT, 2022-2032 ($MILLION)
- TABLE 108. ASIA-PACIFIC ORGANIC CHEMICALS MARKET, BY PRODUCT, 2022-2032 (KILOTON)
- TABLE 109. ASIA-PACIFIC ACIDS ORGANIC CHEMICALS MARKET, BY TYPE, 2022-2032 ($MILLION)
- TABLE 110. ASIA-PACIFIC ACIDS ORGANIC CHEMICALS MARKET, BY TYPE, 2022-2032 (KILOTON)
- TABLE 111. ASIA-PACIFIC ORGANIC CHEMICALS MARKET, BY END USE INDUSTRY, 2022-2032 ($MILLION)
- TABLE 112. ASIA-PACIFIC ORGANIC CHEMICALS MARKET, BY END USE INDUSTRY, 2022-2032 (KILOTON)
- TABLE 113. ASIA-PACIFIC ORGANIC CHEMICALS MARKET, BY COUNTRY, 2022-2032 ($MILLION)
- TABLE 114. ASIA-PACIFIC ORGANIC CHEMICALS MARKET, BY COUNTRY, 2022-2032 (KILOTON)
- TABLE 115. CHINA ORGANIC CHEMICALS MARKET, BY PRODUCT, 2022-2032 ($MILLION)
- TABLE 116. CHINA ORGANIC CHEMICALS MARKET, BY PRODUCT, 2022-2032 (KILOTON)
- TABLE 117. CHINA ACIDS ORGANIC CHEMICALS MARKET, BY TYPE, 2022-2032 ($MILLION)
- TABLE 118. CHINA ACIDS ORGANIC CHEMICALS MARKET, BY TYPE, 2022-2032 (KILOTON)
- TABLE 119. CHINA ORGANIC CHEMICALS MARKET, BY END USE INDUSTRY, 2022-2032 ($MILLION)
- TABLE 120. CHINA ORGANIC CHEMICALS MARKET, BY END USE INDUSTRY, 2022-2032 (KILOTON)
- TABLE 121. INDIA ORGANIC CHEMICALS MARKET, BY PRODUCT, 2022-2032 ($MILLION)
- TABLE 122. INDIA ORGANIC CHEMICALS MARKET, BY PRODUCT, 2022-2032 (KILOTON)
- TABLE 123. INDIA ACIDS ORGANIC CHEMICALS MARKET, BY TYPE, 2022-2032 ($MILLION)
- TABLE 124. INDIA ACIDS ORGANIC CHEMICALS MARKET, BY TYPE, 2022-2032 (KILOTON)
- TABLE 125. INDIA ORGANIC CHEMICALS MARKET, BY END USE INDUSTRY, 2022-2032 ($MILLION)
- TABLE 126. INDIA ORGANIC CHEMICALS MARKET, BY END USE INDUSTRY, 2022-2032 (KILOTON)
- TABLE 127. JAPAN ORGANIC CHEMICALS MARKET, BY PRODUCT, 2022-2032 ($MILLION)
- TABLE 128. JAPAN ORGANIC CHEMICALS MARKET, BY PRODUCT, 2022-2032 (KILOTON)
- TABLE 129. JAPAN ACIDS ORGANIC CHEMICALS MARKET, BY TYPE, 2022-2032 ($MILLION)
- TABLE 130. JAPAN ACIDS ORGANIC CHEMICALS MARKET, BY TYPE, 2022-2032 (KILOTON)
- TABLE 131. JAPAN ORGANIC CHEMICALS MARKET, BY END USE INDUSTRY, 2022-2032 ($MILLION)
- TABLE 132. JAPAN ORGANIC CHEMICALS MARKET, BY END USE INDUSTRY, 2022-2032 (KILOTON)
- TABLE 133. SOUTH KOREA ORGANIC CHEMICALS MARKET, BY PRODUCT, 2022-2032 ($MILLION)
- TABLE 134. SOUTH KOREA ORGANIC CHEMICALS MARKET, BY PRODUCT, 2022-2032 (KILOTON)
- TABLE 135. SOUTH KOREA ACIDS ORGANIC CHEMICALS MARKET, BY TYPE, 2022-2032 ($MILLION)
- TABLE 136. SOUTH KOREA ACIDS ORGANIC CHEMICALS MARKET, BY TYPE, 2022-2032 (KILOTON)
- TABLE 137. SOUTH KOREA ORGANIC CHEMICALS MARKET, BY END USE INDUSTRY, 2022-2032 ($MILLION)
- TABLE 138. SOUTH KOREA ORGANIC CHEMICALS MARKET, BY END USE INDUSTRY, 2022-2032 (KILOTON)
- TABLE 139. AUSTRALIA ORGANIC CHEMICALS MARKET, BY PRODUCT, 2022-2032 ($MILLION)
- TABLE 140. AUSTRALIA ORGANIC CHEMICALS MARKET, BY PRODUCT, 2022-2032 (KILOTON)
- TABLE 141. AUSTRALIA ACIDS ORGANIC CHEMICALS MARKET, BY TYPE, 2022-2032 ($MILLION)
- TABLE 142. AUSTRALIA ACIDS ORGANIC CHEMICALS MARKET, BY TYPE, 2022-2032 (KILOTON)
- TABLE 143. AUSTRALIA ORGANIC CHEMICALS MARKET, BY END USE INDUSTRY, 2022-2032 ($MILLION)
- TABLE 144. AUSTRALIA ORGANIC CHEMICALS MARKET, BY END USE INDUSTRY, 2022-2032 (KILOTON)
- TABLE 145. REST OF ASIA-PACIFIC ORGANIC CHEMICALS MARKET, BY PRODUCT, 2022-2032 ($MILLION)
- TABLE 146. REST OF ASIA-PACIFIC ORGANIC CHEMICALS MARKET, BY PRODUCT, 2022-2032 (KILOTON)
- TABLE 147. REST OF ASIA-PACIFIC ACIDS ORGANIC CHEMICALS MARKET, BY TYPE, 2022-2032 ($MILLION)
- TABLE 148. REST OF ASIA-PACIFIC ACIDS ORGANIC CHEMICALS MARKET, BY TYPE, 2022-2032 (KILOTON)
- TABLE 149. REST OF ASIA-PACIFIC ORGANIC CHEMICALS MARKET, BY END USE INDUSTRY, 2022-2032 ($MILLION)
- TABLE 150. REST OF ASIA-PACIFIC ORGANIC CHEMICALS MARKET, BY END USE INDUSTRY, 2022-2032 (KILOTON)
- TABLE 151. LAMEA ORGANIC CHEMICALS MARKET, BY PRODUCT, 2022-2032 ($MILLION)
- TABLE 152. LAMEA ORGANIC CHEMICALS MARKET, BY PRODUCT, 2022-2032 (KILOTON)
- TABLE 153. LAMEA ACIDS ORGANIC CHEMICALS MARKET, BY TYPE, 2022-2032 ($MILLION)
- TABLE 154. LAMEA ACIDS ORGANIC CHEMICALS MARKET, BY TYPE, 2022-2032 (KILOTON)
- TABLE 155. LAMEA ORGANIC CHEMICALS MARKET, BY END USE INDUSTRY, 2022-2032 ($MILLION)
- TABLE 156. LAMEA ORGANIC CHEMICALS MARKET, BY END USE INDUSTRY, 2022-2032 (KILOTON)
- TABLE 157. LAMEA ORGANIC CHEMICALS MARKET, BY COUNTRY, 2022-2032 ($MILLION)
- TABLE 158. LAMEA ORGANIC CHEMICALS MARKET, BY COUNTRY, 2022-2032 (KILOTON)
- TABLE 159. BRAZIL ORGANIC CHEMICALS MARKET, BY PRODUCT, 2022-2032 ($MILLION)
- TABLE 160. BRAZIL ORGANIC CHEMICALS MARKET, BY PRODUCT, 2022-2032 (KILOTON)
- TABLE 161. BRAZIL ACIDS ORGANIC CHEMICALS MARKET, BY TYPE, 2022-2032 ($MILLION)
- TABLE 162. BRAZIL ACIDS ORGANIC CHEMICALS MARKET, BY TYPE, 2022-2032 (KILOTON)
- TABLE 163. BRAZIL ORGANIC CHEMICALS MARKET, BY END USE INDUSTRY, 2022-2032 ($MILLION)
- TABLE 164. BRAZIL ORGANIC CHEMICALS MARKET, BY END USE INDUSTRY, 2022-2032 (KILOTON)
- TABLE 165. SAUDI ARABIA ORGANIC CHEMICALS MARKET, BY PRODUCT, 2022-2032 ($MILLION)
- TABLE 166. SAUDI ARABIA ORGANIC CHEMICALS MARKET, BY PRODUCT, 2022-2032 (KILOTON)
- TABLE 167. SAUDI ARABIA ACIDS ORGANIC CHEMICALS MARKET, BY TYPE, 2022-2032 ($MILLION)
- TABLE 168. SAUDI ARABIA ACIDS ORGANIC CHEMICALS MARKET, BY TYPE, 2022-2032 (KILOTON)
- TABLE 169. SAUDI ARABIA ORGANIC CHEMICALS MARKET, BY END USE INDUSTRY, 2022-2032 ($MILLION)
- TABLE 170. SAUDI ARABIA ORGANIC CHEMICALS MARKET, BY END USE INDUSTRY, 2022-2032 (KILOTON)
- TABLE 171. SOUTH AFRICA ORGANIC CHEMICALS MARKET, BY PRODUCT, 2022-2032 ($MILLION)
- TABLE 172. SOUTH AFRICA ORGANIC CHEMICALS MARKET, BY PRODUCT, 2022-2032 (KILOTON)
- TABLE 173. SOUTH AFRICA ACIDS ORGANIC CHEMICALS MARKET, BY TYPE, 2022-2032 ($MILLION)
- TABLE 174. SOUTH AFRICA ACIDS ORGANIC CHEMICALS MARKET, BY TYPE, 2022-2032 (KILOTON)
- TABLE 175. SOUTH AFRICA ORGANIC CHEMICALS MARKET, BY END USE INDUSTRY, 2022-2032 ($MILLION)
- TABLE 176. SOUTH AFRICA ORGANIC CHEMICALS MARKET, BY END USE INDUSTRY, 2022-2032 (KILOTON)
- TABLE 177. REST OF LAMEA ORGANIC CHEMICALS MARKET, BY PRODUCT, 2022-2032 ($MILLION)
- TABLE 178. REST OF LAMEA ORGANIC CHEMICALS MARKET, BY PRODUCT, 2022-2032 (KILOTON)
- TABLE 179. REST OF LAMEA ACIDS ORGANIC CHEMICALS MARKET, BY TYPE, 2022-2032 ($MILLION)
- TABLE 180. REST OF LAMEA ACIDS ORGANIC CHEMICALS MARKET, BY TYPE, 2022-2032 (KILOTON)
- TABLE 181. REST OF LAMEA ORGANIC CHEMICALS MARKET, BY END USE INDUSTRY, 2022-2032 ($MILLION)
- TABLE 182. REST OF LAMEA ORGANIC CHEMICALS MARKET, BY END USE INDUSTRY, 2022-2032 (KILOTON)
- TABLE 183. TCI AMERICA: KEY EXECUTIVES
- TABLE 184. TCI AMERICA: COMPANY SNAPSHOT
- TABLE 185. TCI AMERICA: PRODUCT SEGMENTS
- TABLE 186. TCI AMERICA: PRODUCT PORTFOLIO
- TABLE 187. BASF SE: KEY EXECUTIVES
- TABLE 188. BASF SE: COMPANY SNAPSHOT
- TABLE 189. BASF SE: PRODUCT SEGMENTS
- TABLE 190. BASF SE: PRODUCT PORTFOLIO
- TABLE 191. DOW: KEY EXECUTIVES
- TABLE 192. DOW: COMPANY SNAPSHOT
- TABLE 193. DOW: PRODUCT SEGMENTS
- TABLE 194. DOW: PRODUCT PORTFOLIO
- TABLE 195. AKZONOBEL: KEY EXECUTIVES
- TABLE 196. AKZONOBEL: COMPANY SNAPSHOT
- TABLE 197. AKZONOBEL: PRODUCT SEGMENTS
- TABLE 198. AKZONOBEL: PRODUCT PORTFOLIO
- TABLE 199. CARGILL: KEY EXECUTIVES
- TABLE 200. CARGILL: COMPANY SNAPSHOT
- TABLE 201. CARGILL: PRODUCT SEGMENTS
- TABLE 202. CARGILL: PRODUCT PORTFOLIO
- TABLE 203. VINATI ORGANICS LIMITED: KEY EXECUTIVES
- TABLE 204. VINATI ORGANICS LIMITED: COMPANY SNAPSHOT
- TABLE 205. VINATI ORGANICS LIMITED: PRODUCT SEGMENTS
- TABLE 206. VINATI ORGANICS LIMITED: PRODUCT PORTFOLIO
- TABLE 207. HINDUSTAN ORGANIC CHEMICALS LIMITED: KEY EXECUTIVES
- TABLE 208. HINDUSTAN ORGANIC CHEMICALS LIMITED: COMPANY SNAPSHOT
- TABLE 209. HINDUSTAN ORGANIC CHEMICALS LIMITED: PRODUCT SEGMENTS
- TABLE 210. HINDUSTAN ORGANIC CHEMICALS LIMITED: PRODUCT PORTFOLIO
- TABLE 211. ROYAL DUTCH SHELL PLC: KEY EXECUTIVES
- TABLE 212. ROYAL DUTCH SHELL PLC: COMPANY SNAPSHOT
- TABLE 213. ROYAL DUTCH SHELL PLC: PRODUCT SEGMENTS
- TABLE 214. ROYAL DUTCH SHELL PLC: PRODUCT PORTFOLIO
- TABLE 215. NEOGEN CHEMICALS LIMITED: KEY EXECUTIVES
- TABLE 216. NEOGEN CHEMICALS LIMITED: COMPANY SNAPSHOT
- TABLE 217. NEOGEN CHEMICALS LIMITED: PRODUCT SEGMENTS
- TABLE 218. NEOGEN CHEMICALS LIMITED: PRODUCT PORTFOLIO
- TABLE 219. CHEMPLAST SANMAR LIMITED: KEY EXECUTIVES
- TABLE 220. CHEMPLAST SANMAR LIMITED: COMPANY SNAPSHOT
- TABLE 221. CHEMPLAST SANMAR LIMITED: PRODUCT SEGMENTS
- TABLE 222. CHEMPLAST SANMAR LIMITED: PRODUCT PORTFOLIO
LIST OF FIGURES
- FIGURE 01. ORGANIC CHEMICALS MARKET, 2022-2032
- FIGURE 02. SEGMENTATION OF ORGANIC CHEMICALS MARKET, 2022-2032
- FIGURE 03. TOP INVESTMENT POCKETS IN ORGANIC CHEMICALS MARKET (2023-2032)
- FIGURE 04. LOW BARGAINING POWER OF SUPPLIERS
- FIGURE 05. LOW BARGAINING POWER OF BUYERS
- FIGURE 06. LOW THREAT OF SUBSTITUTES
- FIGURE 07. LOW THREAT OF NEW ENTRANTS
- FIGURE 08. LOW INTENSITY OF RIVALRY
- FIGURE 09. DRIVERS, RESTRAINTS AND OPPORTUNITIES: GLOBALORGANIC CHEMICALS MARKET
- FIGURE 10. IMPACT OF KEY REGULATION: ORGANIC CHEMICALS MARKET
- FIGURE 11. PATENT ANALYSIS BY COMPANY
- FIGURE 12. PATENT ANALYSIS BY COUNTRY
- FIGURE 13. PRICING ANALYSIS: ORGANIC CHEMICALS MARKET 2022 AND 2032
- FIGURE 14. REGULATORY GUIDELINES: ORGANIC CHEMICALS MARKET
- FIGURE 15. VALUE CHAIN ANALYSIS: ORGANIC CHEMICALS MARKET
- FIGURE 16. ORGANIC CHEMICALS MARKET, BY PRODUCT, 2022(%)
- FIGURE 17. COMPARATIVE SHARE ANALYSIS OF ORGANIC CHEMICALS MARKET FOR ACIDS, BY COUNTRY 2022 AND 2032(%)
- FIGURE 18. COMPARATIVE SHARE ANALYSIS OF ORGANIC CHEMICALS MARKET FOR ALCOHOLS AND ETHERS, BY COUNTRY 2022 AND 2032(%)
- FIGURE 19. COMPARATIVE SHARE ANALYSIS OF ORGANIC CHEMICALS MARKET FOR AMINES AND AMIDES, BY COUNTRY 2022 AND 2032(%)
- FIGURE 20. COMPARATIVE SHARE ANALYSIS OF ORGANIC CHEMICALS MARKET FOR ALDEHYDES AND KETONES, BY COUNTRY 2022 AND 2032(%)
- FIGURE 21. COMPARATIVE SHARE ANALYSIS OF ORGANIC CHEMICALS MARKET FOR OTHERS, BY COUNTRY 2022 AND 2032(%)
- FIGURE 22. ORGANIC CHEMICALS MARKET, BY END USE INDUSTRY, 2022(%)
- FIGURE 23. COMPARATIVE SHARE ANALYSIS OF ORGANIC CHEMICALS MARKET FOR PHARMACEUTICALS, BY COUNTRY 2022 AND 2032(%)
- FIGURE 24. COMPARATIVE SHARE ANALYSIS OF ORGANIC CHEMICALS MARKET FOR AGROCHEMICALS, BY COUNTRY 2022 AND 2032(%)
- FIGURE 25. COMPARATIVE SHARE ANALYSIS OF ORGANIC CHEMICALS MARKET FOR PERSONAL CARE AND COSMETICS, BY COUNTRY 2022 AND 2032(%)
- FIGURE 26. COMPARATIVE SHARE ANALYSIS OF ORGANIC CHEMICALS MARKET FOR FOOD AND BEVERAGES, BY COUNTRY 2022 AND 2032(%)
- FIGURE 27. COMPARATIVE SHARE ANALYSIS OF ORGANIC CHEMICALS MARKET FOR OTHERS, BY COUNTRY 2022 AND 2032(%)
- FIGURE 28. ORGANIC CHEMICALS MARKET BY REGION, 2022
- FIGURE 29. U.S. ORGANIC CHEMICALS MARKET, 2022-2032 ($MILLION)
- FIGURE 30. CANADA ORGANIC CHEMICALS MARKET, 2022-2032 ($MILLION)
- FIGURE 31. MEXICO ORGANIC CHEMICALS MARKET, 2022-2032 ($MILLION)
- FIGURE 32. GERMANY ORGANIC CHEMICALS MARKET, 2022-2032 ($MILLION)
- FIGURE 33. UK ORGANIC CHEMICALS MARKET, 2022-2032 ($MILLION)
- FIGURE 34. FRANCE ORGANIC CHEMICALS MARKET, 2022-2032 ($MILLION)
- FIGURE 35. SPAIN ORGANIC CHEMICALS MARKET, 2022-2032 ($MILLION)
- FIGURE 36. ITALY ORGANIC CHEMICALS MARKET, 2022-2032 ($MILLION)
- FIGURE 37. REST OF EUROPE ORGANIC CHEMICALS MARKET, 2022-2032 ($MILLION)
- FIGURE 38. CHINA ORGANIC CHEMICALS MARKET, 2022-2032 ($MILLION)
- FIGURE 39. INDIA ORGANIC CHEMICALS MARKET, 2022-2032 ($MILLION)
- FIGURE 40. JAPAN ORGANIC CHEMICALS MARKET, 2022-2032 ($MILLION)
- FIGURE 41. SOUTH KOREA ORGANIC CHEMICALS MARKET, 2022-2032 ($MILLION)
- FIGURE 42. AUSTRALIA ORGANIC CHEMICALS MARKET, 2022-2032 ($MILLION)
- FIGURE 43. REST OF ASIA-PACIFIC ORGANIC CHEMICALS MARKET, 2022-2032 ($MILLION)
- FIGURE 44. BRAZIL ORGANIC CHEMICALS MARKET, 2022-2032 ($MILLION)
- FIGURE 45. SAUDI ARABIA ORGANIC CHEMICALS MARKET, 2022-2032 ($MILLION)
- FIGURE 46. SOUTH AFRICA ORGANIC CHEMICALS MARKET, 2022-2032 ($MILLION)
- FIGURE 47. REST OF LAMEA ORGANIC CHEMICALS MARKET, 2022-2032 ($MILLION)
- FIGURE 48. TOP WINNING STRATEGIES, BY YEAR
- FIGURE 49. TOP WINNING STRATEGIES, BY DEVELOPMENT
- FIGURE 50. TOP WINNING STRATEGIES, BY COMPANY
- FIGURE 51. PRODUCT MAPPING OF TOP 10 PLAYERS
- FIGURE 52. COMPETITIVE DASHBOARD
- FIGURE 53. COMPETITIVE HEATMAP: ORGANIC CHEMICALS MARKET
- FIGURE 54. TOP PLAYER POSITIONING, 2022
- FIGURE 55. BASF SE: NET SALES, 2020-2022 ($MILLION)
- FIGURE 56. BASF SE: REVENUE SHARE BY SEGMENT, 2022 (%)
- FIGURE 57. BASF SE: REVENUE SHARE BY REGION, 2022 (%)
- FIGURE 58. DOW: NET SALES, 2020-2022 ($MILLION)
- FIGURE 59. DOW: RESEARCH & DEVELOPMENT EXPENDITURE, 2020-2022 ($MILLION)
- FIGURE 60. DOW: REVENUE SHARE BY SEGMENT, 2022 (%)
- FIGURE 61. DOW: REVENUE SHARE BY REGION, 2022 (%)
- FIGURE 62. AKZONOBEL: NET REVENUE, 2020-2022 ($MILLION)
- FIGURE 63. VINATI ORGANICS LIMITED: NET REVENUE, 2020-2022 ($MILLION)
- FIGURE 64. HINDUSTAN ORGANIC CHEMICALS LIMITED: NET REVENUE, 2020-2022 ($MILLION)
- FIGURE 65. ROYAL DUTCH SHELL PLC: NET REVENUE, 2019-2021 ($MILLION)
- FIGURE 66. ROYAL DUTCH SHELL PLC: REVENUE SHARE BY SEGMENT, 2021 (%)
- FIGURE 67. ROYAL DUTCH SHELL PLC: REVENUE SHARE BY REGION, 2021 (%)
- FIGURE 68. NEOGEN CHEMICALS LIMITED: NET REVENUE, 2020-2022 ($MILLION)
- FIGURE 69. NEOGEN CHEMICALS LIMITED: REVENUE SHARE BY REGION, 2022 (%)
- FIGURE 70. CHEMPLAST SANMAR LIMITED: NET REVENUE, 2020-2022 ($MILLION)
- FIGURE 71. CHEMPLAST SANMAR LIMITED: REVENUE SHARE BY SEGMENT, 2022 (%)
The organic chemicals market valued for $153.2 billion in 2022 and is estimated to reach $286.0 billion by 2032, exhibiting a CAGR of 6.5% from 2023 to 2032.
Organic chemical or compound is a special category of compound that contains carbon-hydrogen bonds. Carbon shows a unique property called catenation that enables it to form numerous organic compounds with different carbon hydrogen bonds and its derivatives. These chemicals can be obtained naturally or can also be produced by artificial processes as well. Organic chemicals are classified into flavoring agents, aromatic agents, & various alcohols, and are widely used in industries such as food & beverages, pharmaceuticals, cosmetics, and fertilizers.
The rise in awareness for self-grooming activities have led the personal care sector to witness a significant increase in demand where aliphatic hydrocarbons are widely used for producing a wide range of personal care products such as baby oil, baby shampoos, hair conditions, sunscreens, creams & lotions, and others. This may act as one the key drivers responsible for the growth of the organic chemicals market for aliphatic hydrocarbons. Furthermore, increase in geriatric population in countries such as Italy, Japan, and others have fostered the demand for aliphatic hydrocarbon-based anti-ageing creams. This factor is anticipated to increase the sales of organic chemicals for personal care & cosmetics applications; thus, boosting the market growth.
Furthermore, the increase in disposable income coupled with rise in fashion consciousness has led the textile sector to witness a significant demand where ketones are widely used as solvents in textile sector. This factor may act as one of the key drivers responsible for the growth of the organic chemicals market for ketones type. Furthermore, rise in demand for a wide range of consumer goods has led to rapid industrialization in both developed and developing economies where organic aldehydes are used in manufacturing various industrial chemicals, dyes, and solvents. This may fuel the demand for aldehydes during the forecast period.
One of the greatest advantages of organic chemicals is that majority of it can be manufactured from natural sources such as plants, animals, coal, petroleum, and wood. These are easily available in almost every region across the globe. This factor has eased the availability of organic chemicals. Moreover, factor such as rise in corporate social responsibility (CSR) activities coupled with growth in awareness for using non-toxic chemicals have surged the popularity of organic chemicals among several end-use sectors. This may fuel the demand for organic chemicals during the forecast period.
However, aluminum casting involves several processes such as melting of metal, transferring the molten metal to mold cavity, and solidification of molten metal. These processes require a relatively large amount of heat energy. Furthermore, the overall process consists of different sophisticated equipment that are fabricated to work at high temperature application. These factors make aluminum casting an expensive process which in turn may restrain manufacturers with less investment potential to enter into aluminum casting market. Thus, high investment costs associated with the production of aluminum castings may hamper the market growth during the forecast period.
On the contrary, since the organic chemical industry is technology-driven, there is huge spending on R&D and this plays a crucial role in the value chain. These R&D investments regarding innovative applications as well as a reduction in production costs are expected to bring numerous opportunities for the industry players. The government initiatives with an aim to encourage the manufacturing industry in emerging economies such as India are anticipated to open new opportunities for organic chemicals market development.
The organic chemicals market is segmented on the basis of product, application, and region. On the basis of product, the market is categorized into acids, alcohols & ethers, amines & amides, aldehydes & ketones, and others. On the basis of end-use industry, it is divided into pharmaceuticals, agrochemicals, personal care & cosmetics, food & beverages, and others. Region-wise, the market is studied across North America, Europe, Asia-Pacific, and LAMEA.
The global organic chemicals market profiles leading players that include: Akzonobel, BASF SE, Cargill, CHEMPLAST SANMAR LIMITED, Dow, Hindustan Organic Chemicals Limited, Neogen Chemicals Limited, Royal Dutch Shell plc, TCI America, Vinati organics Limited. The global organic chemicals market report provides in-depth competitive analysis as well as profiles of these major players.
Key Benefits For Stakeholders
- This report provides a quantitative analysis of the market segments, current trends, estimations, and dynamics of the organic chemicals market analysis from 2022 to 2032 to identify the prevailing organic chemicals market opportunities.
- The market research is offered along with information related to key drivers, restraints, and opportunities.
- Porter's five forces analysis highlights the potency of buyers and suppliers to enable stakeholders make profit-oriented business decisions and strengthen their supplier-buyer network.
- In-depth analysis of the organic chemicals market segmentation assists to determine the prevailing market opportunities.
- Major countries in each region are mapped according to their revenue contribution to the global market.
- Market player positioning facilitates benchmarking and provides a clear understanding of the present position of the market players.
- The report includes the analysis of the regional as well as global organic chemicals market trends, key players, market segments, application areas, and market growth strategies.
Key Market Segments
By Product
- Acids
- Type
- Acetic Acid
- Lactic Acid
- Citric Acid
- Others
- Alcohols and Ethers
- Amines and Amides
- Aldehydes and Ketones
- Others
By End Use Industry
- Agrochemicals
- Personal Care and Cosmetics
- Food and Beverages
- Others
- Pharmaceuticals
By Region
- North America
- U.S.
- Canada
- Mexico
- Europe
- Germany
- UK
- France
- Spain
- Italy
- Rest of Europe
- Asia-Pacific
- China
- India
- Japan
- South Korea
- Australia
- Rest of Asia-Pacific
- LAMEA
- Brazil
- Saudi Arabia
- South Africa
- Rest of LAMEA
Key Market Players:
- akzonobel
- BASF SE
- Cargill
- CHEMPLAST SANMAR LIMITED
- Dow
- Hindustan Organic Chemicals Limited
- neogen chemicals limited
- Royal Dutch Shell plc
- TCI America
- vinati organics limited
TABLE OF CONTENTS
CHAPTER 1: INTRODUCTION
- 1.1. Report description
- 1.2. Key market segments
- 1.3. Key benefits to the stakeholders
- 1.4. Research Methodology
- 1.4.1. Primary research
- 1.4.2. Secondary research
- 1.4.3. Analyst tools and models
CHAPTER 2: EXECUTIVE SUMMARY
- 2.1. CXO Perspective
CHAPTER 3: MARKET OVERVIEW
- 3.1. Market definition and scope
- 3.2. Key findings
- 3.2.1. Top impacting factors
- 3.2.2. Top investment pockets
- 3.3. Porter's five forces analysis
- 3.3.1. Bargaining power of suppliers
- 3.3.2. Bargaining power of buyers
- 3.3.3. Threat of substitutes
- 3.3.4. Threat of new entrants
- 3.3.5. Intensity of rivalry
- 3.4. Market dynamics
- 3.4.1. Drivers
- 3.4.1.1. Increasing adoption of organic chemicals in food & beverage industry
- 3.4.1.2. Robust demand from the pharmaceutical sector
- 3.4.1.3. Rise in demand for paints & coatings from architecture sector
- 3.4.1.4. Natural raw material sources
- 3.4.1. Drivers
- 3.4.2. Restraints
- 3.4.2.1. High costs of organic chemicals
- 3.4.3. Opportunities
- 3.4.3.1. Consolidation of players
- 3.4.3.2. Rise in technology-driven R&D activities
- 3.5. COVID-19 Impact Analysis on the market
- 3.6. Key Regulation Analysis
- 3.7. Patent Landscape
- 3.8. Pricing Analysis
- 3.9. Regulatory Guidelines
- 3.10. Value Chain Analysis
CHAPTER 4: ORGANIC CHEMICALS MARKET, BY PRODUCT
- 4.1. Overview
- 4.1.1. Market size and forecast
- 4.2. Acids
- 4.2.1. Key market trends, growth factors and opportunities
- 4.2.2. Market size and forecast, by region
- 4.2.3. Market share analysis by country
- 4.2.4. Acids Organic Chemicals Market by Type
- 4.2.4.1. Acetic Acid Market size and forecast, by region
- 4.2.4.2. Acetic Acid Market size and forecast, by country
- 4.2.4.3. Lactic Acid Market size and forecast, by region
- 4.2.4.4. Lactic Acid Market size and forecast, by country
- 4.2.4.5. Citric Acid Market size and forecast, by region
- 4.2.4.6. Citric Acid Market size and forecast, by country
- 4.2.4.7. Others Market size and forecast, by region
- 4.2.4.8. Others Market size and forecast, by country
- 4.3. Alcohols and Ethers
- 4.3.1. Key market trends, growth factors and opportunities
- 4.3.2. Market size and forecast, by region
- 4.3.3. Market share analysis by country
- 4.4. Amines and Amides
- 4.4.1. Key market trends, growth factors and opportunities
- 4.4.2. Market size and forecast, by region
- 4.4.3. Market share analysis by country
- 4.5. Aldehydes and Ketones
- 4.5.1. Key market trends, growth factors and opportunities
- 4.5.2. Market size and forecast, by region
- 4.5.3. Market share analysis by country
- 4.6. Others
- 4.6.1. Key market trends, growth factors and opportunities
- 4.6.2. Market size and forecast, by region
- 4.6.3. Market share analysis by country
CHAPTER 5: ORGANIC CHEMICALS MARKET, BY END USE INDUSTRY
- 5.1. Overview
- 5.1.1. Market size and forecast
- 5.2. Pharmaceuticals
- 5.2.1. Key market trends, growth factors and opportunities
- 5.2.2. Market size and forecast, by region
- 5.2.3. Market share analysis by country
- 5.3. Agrochemicals
- 5.3.1. Key market trends, growth factors and opportunities
- 5.3.2. Market size and forecast, by region
- 5.3.3. Market share analysis by country
- 5.4. Personal Care and Cosmetics
- 5.4.1. Key market trends, growth factors and opportunities
- 5.4.2. Market size and forecast, by region
- 5.4.3. Market share analysis by country
- 5.5. Food and Beverages
- 5.5.1. Key market trends, growth factors and opportunities
- 5.5.2. Market size and forecast, by region
- 5.5.3. Market share analysis by country
- 5.6. Others
- 5.6.1. Key market trends, growth factors and opportunities
- 5.6.2. Market size and forecast, by region
- 5.6.3. Market share analysis by country
CHAPTER 6: ORGANIC CHEMICALS MARKET, BY REGION
- 6.1. Overview
- 6.1.1. Market size and forecast By Region
- 6.2. North America
- 6.2.1. Key trends and opportunities
- 6.2.2. Market size and forecast, by Product
- 6.2.2.1. North America Acids Organic Chemicals Market by Type
- 6.2.3. Market size and forecast, by End Use Industry
- 6.2.4. Market size and forecast, by country
- 6.2.4.1. U.S.
- 6.2.4.1.1. Key market trends, growth factors and opportunities
- 6.2.4.1.2. Market size and forecast, by Product
- 6.2.4.1.2.1. U.S. Acids Organic Chemicals Market by Type
- 6.2.4.1.3. Market size and forecast, by End Use Industry
- 6.2.4.2. Canada
- 6.2.4.2.1. Key market trends, growth factors and opportunities
- 6.2.4.2.2. Market size and forecast, by Product
- 6.2.4.2.2.1. Canada Acids Organic Chemicals Market by Type
- 6.2.4.2.3. Market size and forecast, by End Use Industry
- 6.2.4.3. Mexico
- 6.2.4.3.1. Key market trends, growth factors and opportunities
- 6.2.4.3.2. Market size and forecast, by Product
- 6.2.4.3.2.1. Mexico Acids Organic Chemicals Market by Type
- 6.2.4.3.3. Market size and forecast, by End Use Industry
- 6.3. Europe
- 6.3.1. Key trends and opportunities
- 6.3.2. Market size and forecast, by Product
- 6.3.2.1. Europe Acids Organic Chemicals Market by Type
- 6.3.3. Market size and forecast, by End Use Industry
- 6.3.4. Market size and forecast, by country
- 6.3.4.1. Germany
- 6.3.4.1.1. Key market trends, growth factors and opportunities
- 6.3.4.1.2. Market size and forecast, by Product
- 6.3.4.1.2.1. Germany Acids Organic Chemicals Market by Type
- 6.3.4.1.3. Market size and forecast, by End Use Industry
- 6.3.4.2. UK
- 6.3.4.2.1. Key market trends, growth factors and opportunities
- 6.3.4.2.2. Market size and forecast, by Product
- 6.3.4.2.2.1. UK Acids Organic Chemicals Market by Type
- 6.3.4.2.3. Market size and forecast, by End Use Industry
- 6.3.4.3. France
- 6.3.4.3.1. Key market trends, growth factors and opportunities
- 6.3.4.3.2. Market size and forecast, by Product
- 6.3.4.3.2.1. France Acids Organic Chemicals Market by Type
- 6.3.4.3.3. Market size and forecast, by End Use Industry
- 6.3.4.4. Spain
- 6.3.4.4.1. Key market trends, growth factors and opportunities
- 6.3.4.4.2. Market size and forecast, by Product
- 6.3.4.4.2.1. Spain Acids Organic Chemicals Market by Type
- 6.3.4.4.3. Market size and forecast, by End Use Industry
- 6.3.4.5. Italy
- 6.3.4.5.1. Key market trends, growth factors and opportunities
- 6.3.4.5.2. Market size and forecast, by Product
- 6.3.4.5.2.1. Italy Acids Organic Chemicals Market by Type
- 6.3.4.5.3. Market size and forecast, by End Use Industry
- 6.3.4.6. Rest of Europe
- 6.3.4.6.1. Key market trends, growth factors and opportunities
- 6.3.4.6.2. Market size and forecast, by Product
- 6.3.4.6.2.1. Rest of Europe Acids Organic Chemicals Market by Type
- 6.3.4.6.3. Market size and forecast, by End Use Industry
- 6.4. Asia-Pacific
- 6.4.1. Key trends and opportunities
- 6.4.2. Market size and forecast, by Product
- 6.4.2.1. Asia-Pacific Acids Organic Chemicals Market by Type
- 6.4.3. Market size and forecast, by End Use Industry
- 6.4.4. Market size and forecast, by country
- 6.4.4.1. China
- 6.4.4.1.1. Key market trends, growth factors and opportunities
- 6.4.4.1.2. Market size and forecast, by Product
- 6.4.4.1.2.1. China Acids Organic Chemicals Market by Type
- 6.4.4.1.3. Market size and forecast, by End Use Industry
- 6.4.4.2. India
- 6.4.4.2.1. Key market trends, growth factors and opportunities
- 6.4.4.2.2. Market size and forecast, by Product
- 6.4.4.2.2.1. India Acids Organic Chemicals Market by Type
- 6.4.4.2.3. Market size and forecast, by End Use Industry
- 6.4.4.3. Japan
- 6.4.4.3.1. Key market trends, growth factors and opportunities
- 6.4.4.3.2. Market size and forecast, by Product
- 6.4.4.3.2.1. Japan Acids Organic Chemicals Market by Type
- 6.4.4.3.3. Market size and forecast, by End Use Industry
- 6.4.4.4. South Korea
- 6.4.4.4.1. Key market trends, growth factors and opportunities
- 6.4.4.4.2. Market size and forecast, by Product
- 6.4.4.4.2.1. South Korea Acids Organic Chemicals Market by Type
- 6.4.4.4.3. Market size and forecast, by End Use Industry
- 6.4.4.5. Australia
- 6.4.4.5.1. Key market trends, growth factors and opportunities
- 6.4.4.5.2. Market size and forecast, by Product
- 6.4.4.5.2.1. Australia Acids Organic Chemicals Market by Type
- 6.4.4.5.3. Market size and forecast, by End Use Industry
- 6.4.4.6. Rest of Asia-Pacific
- 6.4.4.6.1. Key market trends, growth factors and opportunities
- 6.4.4.6.2. Market size and forecast, by Product
- 6.4.4.6.2.1. Rest of Asia-Pacific Acids Organic Chemicals Market by Type
- 6.4.4.6.3. Market size and forecast, by End Use Industry
- 6.5. LAMEA
- 6.5.1. Key trends and opportunities
- 6.5.2. Market size and forecast, by Product
- 6.5.2.1. LAMEA Acids Organic Chemicals Market by Type
- 6.5.3. Market size and forecast, by End Use Industry
- 6.5.4. Market size and forecast, by country
- 6.5.4.1. Brazil
- 6.5.4.1.1. Key market trends, growth factors and opportunities
- 6.5.4.1.2. Market size and forecast, by Product
- 6.5.4.1.2.1. Brazil Acids Organic Chemicals Market by Type
- 6.5.4.1.3. Market size and forecast, by End Use Industry
- 6.5.4.2. Saudi Arabia
- 6.5.4.2.1. Key market trends, growth factors and opportunities
- 6.5.4.2.2. Market size and forecast, by Product
- 6.5.4.2.2.1. Saudi Arabia Acids Organic Chemicals Market by Type
- 6.5.4.2.3. Market size and forecast, by End Use Industry
- 6.5.4.3. South Africa
- 6.5.4.3.1. Key market trends, growth factors and opportunities
- 6.5.4.3.2. Market size and forecast, by Product
- 6.5.4.3.2.1. South Africa Acids Organic Chemicals Market by Type
- 6.5.4.3.3. Market size and forecast, by End Use Industry
- 6.5.4.4. Rest of LAMEA
- 6.5.4.4.1. Key market trends, growth factors and opportunities
- 6.5.4.4.2. Market size and forecast, by Product
- 6.5.4.4.2.1. Rest of LAMEA Acids Organic Chemicals Market by Type
- 6.5.4.4.3. Market size and forecast, by End Use Industry
CHAPTER 7: COMPETITIVE LANDSCAPE
- 7.1. Introduction
- 7.2. Top winning strategies
- 7.3. Product Mapping of Top 10 Player
- 7.4. Competitive Dashboard
- 7.5. Competitive Heatmap
- 7.6. Top player positioning, 2022
CHAPTER 8: COMPANY PROFILES
- 8.1. TCI America
- 8.1.1. Company overview
- 8.1.2. Key Executives
- 8.1.3. Company snapshot
- 8.1.4. Operating business segments
- 8.1.5. Product portfolio
- 8.2. BASF SE
- 8.2.1. Company overview
- 8.2.2. Key Executives
- 8.2.3. Company snapshot
- 8.2.4. Operating business segments
- 8.2.5. Product portfolio
- 8.2.6. Business performance
- 8.3. Dow
- 8.3.1. Company overview
- 8.3.2. Key Executives
- 8.3.3. Company snapshot
- 8.3.4. Operating business segments
- 8.3.5. Product portfolio
- 8.3.6. Business performance
- 8.4. akzonobel
- 8.4.1. Company overview
- 8.4.2. Key Executives
- 8.4.3. Company snapshot
- 8.4.4. Operating business segments
- 8.4.5. Product portfolio
- 8.4.6. Business performance
- 8.5. Cargill
- 8.5.1. Company overview
- 8.5.2. Key Executives
- 8.5.3. Company snapshot
- 8.5.4. Operating business segments
- 8.5.5. Product portfolio
- 8.6. vinati organics limited
- 8.6.1. Company overview
- 8.6.2. Key Executives
- 8.6.3. Company snapshot
- 8.6.4. Operating business segments
- 8.6.5. Product portfolio
- 8.6.6. Business performance
- 8.7. Hindustan Organic Chemicals Limited
- 8.7.1. Company overview
- 8.7.2. Key Executives
- 8.7.3. Company snapshot
- 8.7.4. Operating business segments
- 8.7.5. Product portfolio
- 8.7.6. Business performance
- 8.8. Royal Dutch Shell plc
- 8.8.1. Company overview
- 8.8.2. Key Executives
- 8.8.3. Company snapshot
- 8.8.4. Operating business segments
- 8.8.5. Product portfolio
- 8.8.6. Business performance
- 8.9. neogen chemicals limited
- 8.9.1. Company overview
- 8.9.2. Key Executives
- 8.9.3. Company snapshot
- 8.9.4. Operating business segments
- 8.9.5. Product portfolio
- 8.9.6. Business performance
- 8.10. CHEMPLAST SANMAR LIMITED
- 8.10.1. Company overview
- 8.10.2. Key Executives
- 8.10.3. Company snapshot
- 8.10.4. Operating business segments
- 8.10.5. Product portfolio
- 8.10.6. Business performance