 |
市場調査レポート
商品コード
1298309
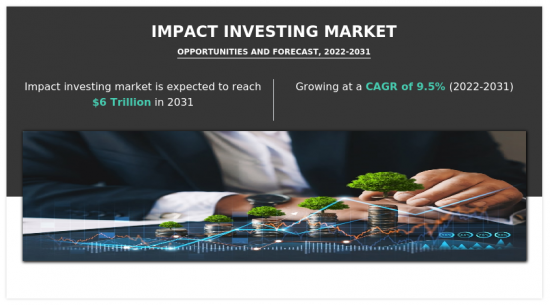
インパクト投資市場:セクター別、投資家別:世界の機会分析と産業予測、2021年~2031年Impact Investing Market By Sector (Education, Agriculture, Healthcare, Energy, Housing, Others), By Investor (Individual Investors, Institutional Investors, Others): Global Opportunity Analysis and Industry Forecast, 2021-2031 |
||||||

| インパクト投資市場:セクター別、投資家別:世界の機会分析と産業予測、2021年~2031年 |
|
出版日: 2023年03月01日
発行: Allied Market Research
ページ情報: 英文 338 Pages
納期: 2~3営業日
|
- 全表示
- 概要
- 図表
- 目次
インパクト投資とは、投資家の金銭的利益とともに、社会または環境にプラスの効果をもたらすことを目的とした投資戦略です。
こうした投資は、貧困、気候変動、教育、ヘルスケアといった社会的・環境的課題への取り組みに注力する企業やファンドへの株式投資や債券投資など、さまざまな形態をとることができます。インパクト投資の主な目的は、測定可能で持続可能な社会的・環境的変化をもたらすと同時に、投資家に金銭的リターンをもたらすことです。インパクト投資は、投資家が自らの価値観と財務目標のバランスを取り、差し迫った社会・環境問題に対処しようとする中で、近年勢いを増しています。
富の不平等、貧困、ヘルスケアや教育へのアクセスといった社会的な懸念が人気を集めており、社会的・環境的課題に取り組む必要性に対する意識の高まりが、インパクト投資市場の主要な促進要因となっています。さらに、財務的リターンと社会的・環境的インパクトの両方を求める投資家からの需要の高まりや、インパクト投資を促進するための政府の支援や政策も、インパクト投資市場の主な促進要因となっています。しかし、インパクト投資と社会的責任投資(SRI)や環境・社会・ガバナンス(ESG)投資といった他の用語との混同が市場に悪影響を及ぼす可能性があるため、投資家や一般消費者の間でインパクト投資に対する理解が限られていることが、市場の成長を妨げる大きな要因となっています。さらに、財務的リターンと社会的・環境的インパクトの両方を達成する上での課題も、市場成長の大きな抑制要因となっています。これとは逆に、社会的・環境的課題に対処するためのインパクト・インベスター、政府、その他の利害関係者間の協力は、市場の成長に大きな有利な機会を提供すると予測されます。
目次
第1章 イントロダクション
第2章 エグゼクティブサマリー
第3章 市場概要
- 市場の定義と範囲
- 主な調査結果
- 影響要因
- 主な投資機会
- ポーターのファイブフォース分析
- 供給企業の交渉力
- 買い手の交渉力
- 代替品の脅威
- 新規参入業者の脅威
- 競合の激しさ
- 市場力学
- 促進要因
- 財務的リターンと社会的・環境的インパクトの両方を求める投資家からの需要の急増
- 社会的・環境的課題に取り組む必要性に対する意識の高まり
- インパクト投資を促進する政府の支援と政策
- 阻害要因
- 財務的リターンと社会的・環境的インパクトの両方を達成する上での課題
- 投資家や一般市民のインパクト投資に対する理解が限定的であること
- 機会
- 機関投資家や富裕層からのインパクト投資商品に対する需要の高まり
- 社会的・環境的課題に対処するためのインパクト投資家、政府、その他の利害関係者の連携
- 促進要因
- COVID-19:市場における影響分析
第4章 インパクト投資市場:セクター別
- 概要
- 市場規模と予測
- 教育
- 主な市場動向、成長要因、機会
- 市場規模・予測:地域別
- 市場シェア分析:国別
- 農業
- 主要市場動向、成長要因、機会
- 市場規模・予測:地域別
- 市場シェア分析:国別
- ヘルスケア
- 主要市場動向、成長要因、機会
- 市場規模・予測:地域別
- 市場シェア分析:国別
- エネルギー
- 主要市場動向、成長要因、機会
- 市場規模・予測:地域別
- 市場シェア分析:国別
- 住宅
- 主な市場動向、成長要因、機会
- 市場規模・予測:地域別
- 市場シェア分析:国別
- その他
- 主な市場動向、成長要因、機会
- 市場規模・予測:地域別
- 市場シェア分析:国別
第5章 インパクト投資市場:投資家別
- 概要
- 市場規模および予測
- 個人投資家
- 主な市場動向、成長要因、機会
- 市場規模・予測:地域別
- 市場シェア分析:国別
- 機関投資家
- 主な市場動向、成長要因、機会
- 市場規模・予測:地域別
- 市場シェア分析:国別
- その他
- 主な市場動向、成長要因、機会
- 市場規模・予測:地域別
- 市場シェア分析:国別
第6章 インパクト投資市場:地域別
- 概要
- 市場規模・予測:地域別
- 北米
- 主な動向と機会
- 市場規模・予測:セクター別
- 市場規模・予測:投資家別
- 市場規模・予測:国別
- 米国
- 主な市場動向、成長要因、機会
- 市場規模・予測:セクター別
- 市場規模・予測:投資家別
- カナダ
- 主要市場動向、成長要因、機会
- 市場規模・予測:分野別
- 市場規模・予測:投資家別
- 欧州
- 主要動向と機会
- 市場規模・予測:分野別
- 市場規模・予測:投資家別
- 市場規模・予測:国別
- 英国
- 主要市場動向、成長要因、機会
- 市場規模・予測:セクター別
- 市場規模・予測:投資家別
- ドイツ
- 主要市場動向、成長要因、機会
- 市場規模・予測:セクター別
- 市場規模・予測:投資家別
- フランス
- 主要市場動向、成長要因、機会
- 市場規模・予測:セクター別
- 市場規模・予測:投資家別
- イタリア
- 主要市場動向、成長要因、機会
- 市場規模・予測:セクター別
- 市場規模・予測:投資家別
- スペイン
- 主要市場動向、成長要因、機会
- 市場規模・予測:セクター別
- 市場規模・予測:投資家別
- その他欧州
- 主要市場動向、成長要因、機会
- 市場規模・予測:セクター別
- 市場規模・予測:投資家別
- アジア太平洋地域
- 主要動向と機会
- 市場規模・予測:セクター別
- 市場規模・予測:投資家別
- 市場規模・予測:国別
- 中国
- 主要市場動向、成長要因、機会
- 市場規模・予測:分野別
- 市場規模・予測:投資家別
- 日本
- 主要市場動向、成長要因、機会
- 市場規模・予測:分野別
- 市場規模・予測:投資家別
- インド
- 主要市場動向、成長要因、機会
- 市場規模・予測:セクター別
- 市場規模・予測:投資家別
- オーストラリア
- 主要市場動向、成長要因、機会
- 市場規模・予測:セクター別
- 市場規模・予測:投資家別
- 韓国
- 主要市場動向、成長要因、機会
- 市場規模・予測:セクター別
- 市場規模・予測:投資家別
- その他アジア太平洋地域
- 主要市場動向、成長要因、機会
- 市場規模・予測:セクター別
- 市場規模・予測:投資家別
- ラテンアメリカ・中東・アフリカ
- 主要動向と機会
- 市場規模・予測:セクター別
- 市場規模・予測:投資家別
- 市場規模・予測:国別
- ラテンアメリカ
- 主要市場動向、成長要因、機会
- 市場規模・予測:セクター別
- 市場規模・予測:投資家別
- 中東
- 主要市場動向、成長要因、機会
- 市場規模・予測:セクター別
- 市場規模・予測:投資家別
- アフリカ
- 主要市場動向、成長要因、機会
- 市場規模・予測:セクター別
- 市場規模・予測:投資家別
第7章 競合情勢
- イントロダクション
- 主要成功戦略
- 主要10社の製品マッピング
- 競合ダッシュボード
- 競合ヒートマップ
- トップ企業のポジショニング(2021年)
第8章 企業プロファイル
- Morgan Stanley
- Leapfrog investments
- Omidyar network
- Bridges fund management ltd.
- Vital Capital
- Blueorchard finance ltd
- Manulife Investment Management.
- Reinvestment fund
- Goldman Sachs
- Bain capital
LIST OF TABLES
- TABLE 01. GLOBAL IMPACT INVESTING MARKET, BY SECTOR, 2021-2031 ($BILLION)
- TABLE 02. IMPACT INVESTING MARKET FOR EDUCATION, BY REGION, 2021-2031 ($BILLION)
- TABLE 03. IMPACT INVESTING MARKET FOR AGRICULTURE, BY REGION, 2021-2031 ($BILLION)
- TABLE 04. IMPACT INVESTING MARKET FOR HEALTHCARE, BY REGION, 2021-2031 ($BILLION)
- TABLE 05. IMPACT INVESTING MARKET FOR ENERGY, BY REGION, 2021-2031 ($BILLION)
- TABLE 06. IMPACT INVESTING MARKET FOR HOUSING, BY REGION, 2021-2031 ($BILLION)
- TABLE 07. IMPACT INVESTING MARKET FOR OTHERS, BY REGION, 2021-2031 ($BILLION)
- TABLE 08. GLOBAL IMPACT INVESTING MARKET, BY INVESTOR, 2021-2031 ($BILLION)
- TABLE 09. IMPACT INVESTING MARKET FOR INDIVIDUAL INVESTORS, BY REGION, 2021-2031 ($BILLION)
- TABLE 10. IMPACT INVESTING MARKET FOR INSTITUTIONAL INVESTORS, BY REGION, 2021-2031 ($BILLION)
- TABLE 11. IMPACT INVESTING MARKET FOR OTHERS, BY REGION, 2021-2031 ($BILLION)
- TABLE 12. IMPACT INVESTING MARKET, BY REGION, 2021-2031 ($BILLION)
- TABLE 13. NORTH AMERICA IMPACT INVESTING MARKET, BY SECTOR, 2021-2031 ($BILLION)
- TABLE 14. NORTH AMERICA IMPACT INVESTING MARKET, BY INVESTOR, 2021-2031 ($BILLION)
- TABLE 15. NORTH AMERICA IMPACT INVESTING MARKET, BY COUNTRY, 2021-2031 ($BILLION)
- TABLE 16. U.S. IMPACT INVESTING MARKET, BY SECTOR, 2021-2031 ($BILLION)
- TABLE 17. U.S. IMPACT INVESTING MARKET, BY INVESTOR, 2021-2031 ($BILLION)
- TABLE 18. CANADA IMPACT INVESTING MARKET, BY SECTOR, 2021-2031 ($BILLION)
- TABLE 19. CANADA IMPACT INVESTING MARKET, BY INVESTOR, 2021-2031 ($BILLION)
- TABLE 20. EUROPE IMPACT INVESTING MARKET, BY SECTOR, 2021-2031 ($BILLION)
- TABLE 21. EUROPE IMPACT INVESTING MARKET, BY INVESTOR, 2021-2031 ($BILLION)
- TABLE 22. EUROPE IMPACT INVESTING MARKET, BY COUNTRY, 2021-2031 ($BILLION)
- TABLE 23. UK IMPACT INVESTING MARKET, BY SECTOR, 2021-2031 ($BILLION)
- TABLE 24. UK IMPACT INVESTING MARKET, BY INVESTOR, 2021-2031 ($BILLION)
- TABLE 25. GERMANY IMPACT INVESTING MARKET, BY SECTOR, 2021-2031 ($BILLION)
- TABLE 26. GERMANY IMPACT INVESTING MARKET, BY INVESTOR, 2021-2031 ($BILLION)
- TABLE 27. FRANCE IMPACT INVESTING MARKET, BY SECTOR, 2021-2031 ($BILLION)
- TABLE 28. FRANCE IMPACT INVESTING MARKET, BY INVESTOR, 2021-2031 ($BILLION)
- TABLE 29. ITALY IMPACT INVESTING MARKET, BY SECTOR, 2021-2031 ($BILLION)
- TABLE 30. ITALY IMPACT INVESTING MARKET, BY INVESTOR, 2021-2031 ($BILLION)
- TABLE 31. SPAIN IMPACT INVESTING MARKET, BY SECTOR, 2021-2031 ($BILLION)
- TABLE 32. SPAIN IMPACT INVESTING MARKET, BY INVESTOR, 2021-2031 ($BILLION)
- TABLE 33. REST OF EUROPE IMPACT INVESTING MARKET, BY SECTOR, 2021-2031 ($BILLION)
- TABLE 34. REST OF EUROPE IMPACT INVESTING MARKET, BY INVESTOR, 2021-2031 ($BILLION)
- TABLE 35. ASIA-PACIFIC IMPACT INVESTING MARKET, BY SECTOR, 2021-2031 ($BILLION)
- TABLE 36. ASIA-PACIFIC IMPACT INVESTING MARKET, BY INVESTOR, 2021-2031 ($BILLION)
- TABLE 37. ASIA-PACIFIC IMPACT INVESTING MARKET, BY COUNTRY, 2021-2031 ($BILLION)
- TABLE 38. CHINA IMPACT INVESTING MARKET, BY SECTOR, 2021-2031 ($BILLION)
- TABLE 39. CHINA IMPACT INVESTING MARKET, BY INVESTOR, 2021-2031 ($BILLION)
- TABLE 40. JAPAN IMPACT INVESTING MARKET, BY SECTOR, 2021-2031 ($BILLION)
- TABLE 41. JAPAN IMPACT INVESTING MARKET, BY INVESTOR, 2021-2031 ($BILLION)
- TABLE 42. INDIA IMPACT INVESTING MARKET, BY SECTOR, 2021-2031 ($BILLION)
- TABLE 43. INDIA IMPACT INVESTING MARKET, BY INVESTOR, 2021-2031 ($BILLION)
- TABLE 44. AUSTRALIA IMPACT INVESTING MARKET, BY SECTOR, 2021-2031 ($BILLION)
- TABLE 45. AUSTRALIA IMPACT INVESTING MARKET, BY INVESTOR, 2021-2031 ($BILLION)
- TABLE 46. SOUTH KOREA IMPACT INVESTING MARKET, BY SECTOR, 2021-2031 ($BILLION)
- TABLE 47. SOUTH KOREA IMPACT INVESTING MARKET, BY INVESTOR, 2021-2031 ($BILLION)
- TABLE 48. REST OF ASIA-PACIFIC IMPACT INVESTING MARKET, BY SECTOR, 2021-2031 ($BILLION)
- TABLE 49. REST OF ASIA-PACIFIC IMPACT INVESTING MARKET, BY INVESTOR, 2021-2031 ($BILLION)
- TABLE 50. LAMEA IMPACT INVESTING MARKET, BY SECTOR, 2021-2031 ($BILLION)
- TABLE 51. LAMEA IMPACT INVESTING MARKET, BY INVESTOR, 2021-2031 ($BILLION)
- TABLE 52. LAMEA IMPACT INVESTING MARKET, BY COUNTRY, 2021-2031 ($BILLION)
- TABLE 53. LATIN AMERICA IMPACT INVESTING MARKET, BY SECTOR, 2021-2031 ($BILLION)
- TABLE 54. LATIN AMERICA IMPACT INVESTING MARKET, BY INVESTOR, 2021-2031 ($BILLION)
- TABLE 55. MIDDLE EAST IMPACT INVESTING MARKET, BY SECTOR, 2021-2031 ($BILLION)
- TABLE 56. MIDDLE EAST IMPACT INVESTING MARKET, BY INVESTOR, 2021-2031 ($BILLION)
- TABLE 57. AFRICA IMPACT INVESTING MARKET, BY SECTOR, 2021-2031 ($BILLION)
- TABLE 58. AFRICA IMPACT INVESTING MARKET, BY INVESTOR, 2021-2031 ($BILLION)
- TABLE 59. MORGAN STANLEY: KEY EXECUTIVES
- TABLE 60. MORGAN STANLEY: COMPANY SNAPSHOT
- TABLE 61. MORGAN STANLEY: SERVICE SEGMENTS
- TABLE 62. MORGAN STANLEY: PRODUCT PORTFOLIO
- TABLE 63. MORGAN STANLEY: KEY STRATERGIES
- TABLE 64. LEAPFROG INVESTMENTS: KEY EXECUTIVES
- TABLE 65. LEAPFROG INVESTMENTS: COMPANY SNAPSHOT
- TABLE 66. LEAPFROG INVESTMENTS: SERVICE SEGMENTS
- TABLE 67. LEAPFROG INVESTMENTS: PRODUCT PORTFOLIO
- TABLE 68. LEAPFROG INVESTMENTS: KEY STRATERGIES
- TABLE 69. OMIDYAR NETWORK: KEY EXECUTIVES
- TABLE 70. OMIDYAR NETWORK: COMPANY SNAPSHOT
- TABLE 71. OMIDYAR NETWORK: SERVICE SEGMENTS
- TABLE 72. OMIDYAR NETWORK: PRODUCT PORTFOLIO
- TABLE 73. BRIDGES FUND MANAGEMENT LTD.: KEY EXECUTIVES
- TABLE 74. BRIDGES FUND MANAGEMENT LTD.: COMPANY SNAPSHOT
- TABLE 75. BRIDGES FUND MANAGEMENT LTD.: SERVICE SEGMENTS
- TABLE 76. BRIDGES FUND MANAGEMENT LTD.: PRODUCT PORTFOLIO
- TABLE 77. VITAL CAPITAL: KEY EXECUTIVES
- TABLE 78. VITAL CAPITAL: COMPANY SNAPSHOT
- TABLE 79. VITAL CAPITAL: SERVICE SEGMENTS
- TABLE 80. VITAL CAPITAL: PRODUCT PORTFOLIO
- TABLE 81. VITAL CAPITAL: KEY STRATERGIES
- TABLE 82. BLUEORCHARD FINANCE LTD: KEY EXECUTIVES
- TABLE 83. BLUEORCHARD FINANCE LTD: COMPANY SNAPSHOT
- TABLE 84. BLUEORCHARD FINANCE LTD: SERVICE SEGMENTS
- TABLE 85. BLUEORCHARD FINANCE LTD: PRODUCT PORTFOLIO
- TABLE 86. BLUEORCHARD FINANCE LTD: KEY STRATERGIES
- TABLE 87. MANULIFE INVESTMENT MANAGEMENT.: KEY EXECUTIVES
- TABLE 88. MANULIFE INVESTMENT MANAGEMENT.: COMPANY SNAPSHOT
- TABLE 89. MANULIFE INVESTMENT MANAGEMENT.: SERVICE SEGMENTS
- TABLE 90. MANULIFE INVESTMENT MANAGEMENT.: PRODUCT PORTFOLIO
- TABLE 91. MANULIFE INVESTMENT MANAGEMENT.: KEY STRATERGIES
- TABLE 92. REINVESTMENT FUND: KEY EXECUTIVES
- TABLE 93. REINVESTMENT FUND: COMPANY SNAPSHOT
- TABLE 94. REINVESTMENT FUND: SERVICE SEGMENTS
- TABLE 95. REINVESTMENT FUND: PRODUCT PORTFOLIO
- TABLE 96. GOLDMAN SACHS: KEY EXECUTIVES
- TABLE 97. GOLDMAN SACHS: COMPANY SNAPSHOT
- TABLE 98. GOLDMAN SACHS: SERVICE SEGMENTS
- TABLE 99. GOLDMAN SACHS: PRODUCT PORTFOLIO
- TABLE 100. BAIN CAPITAL: KEY EXECUTIVES
- TABLE 101. BAIN CAPITAL: COMPANY SNAPSHOT
- TABLE 102. BAIN CAPITAL: SERVICE SEGMENTS
- TABLE 103. BAIN CAPITAL: PRODUCT PORTFOLIO
LIST OF FIGURES
- FIGURE 01. IMPACT INVESTING MARKET, 2021-2031
- FIGURE 02. SEGMENTATION OF IMPACT INVESTING MARKET, 2021-2031
- FIGURE 03. TOP INVESTMENT POCKETS IN IMPACT INVESTING MARKET (2022-2031)
- FIGURE 04. MODERATE TO HIGH BARGAINING POWER OF SUPPLIERS
- FIGURE 05. HIGH TO MODERATE BARGAINING POWER OF BUYERS
- FIGURE 06. MODERTAE TO HIGH THREAT OF SUBSTITUTES
- FIGURE 07. HIGH TO MODERATE THREAT OF NEW ENTRANTS
- FIGURE 08. HIGH TO MODERATE INTENSITY OF RIVALRY
- FIGURE 09. DRIVERS, RESTRAINTS AND OPPORTUNITIES: GLOBALIMPACT INVESTING MARKET
- FIGURE 10. IMPACT INVESTING MARKET, BY SECTOR, 2021(%)
- FIGURE 11. COMPARATIVE SHARE ANALYSIS OF IMPACT INVESTING MARKET FOR EDUCATION, BY COUNTRY 2021 AND 2031(%)
- FIGURE 12. COMPARATIVE SHARE ANALYSIS OF IMPACT INVESTING MARKET FOR AGRICULTURE, BY COUNTRY 2021 AND 2031(%)
- FIGURE 13. COMPARATIVE SHARE ANALYSIS OF IMPACT INVESTING MARKET FOR HEALTHCARE, BY COUNTRY 2021 AND 2031(%)
- FIGURE 14. COMPARATIVE SHARE ANALYSIS OF IMPACT INVESTING MARKET FOR ENERGY, BY COUNTRY 2021 AND 2031(%)
- FIGURE 15. COMPARATIVE SHARE ANALYSIS OF IMPACT INVESTING MARKET FOR HOUSING, BY COUNTRY 2021 AND 2031(%)
- FIGURE 16. COMPARATIVE SHARE ANALYSIS OF IMPACT INVESTING MARKET FOR OTHERS, BY COUNTRY 2021 AND 2031(%)
- FIGURE 17. IMPACT INVESTING MARKET, BY INVESTOR, 2021(%)
- FIGURE 18. COMPARATIVE SHARE ANALYSIS OF IMPACT INVESTING MARKET FOR INDIVIDUAL INVESTORS, BY COUNTRY 2021 AND 2031(%)
- FIGURE 19. COMPARATIVE SHARE ANALYSIS OF IMPACT INVESTING MARKET FOR INSTITUTIONAL INVESTORS, BY COUNTRY 2021 AND 2031(%)
- FIGURE 20. COMPARATIVE SHARE ANALYSIS OF IMPACT INVESTING MARKET FOR OTHERS, BY COUNTRY 2021 AND 2031(%)
- FIGURE 21. IMPACT INVESTING MARKET BY REGION, 2021
- FIGURE 22. U.S. IMPACT INVESTING MARKET, 2021-2031 ($BILLION)
- FIGURE 23. CANADA IMPACT INVESTING MARKET, 2021-2031 ($BILLION)
- FIGURE 24. UK IMPACT INVESTING MARKET, 2021-2031 ($BILLION)
- FIGURE 25. GERMANY IMPACT INVESTING MARKET, 2021-2031 ($BILLION)
- FIGURE 26. FRANCE IMPACT INVESTING MARKET, 2021-2031 ($BILLION)
- FIGURE 27. ITALY IMPACT INVESTING MARKET, 2021-2031 ($BILLION)
- FIGURE 28. SPAIN IMPACT INVESTING MARKET, 2021-2031 ($BILLION)
- FIGURE 29. REST OF EUROPE IMPACT INVESTING MARKET, 2021-2031 ($BILLION)
- FIGURE 30. CHINA IMPACT INVESTING MARKET, 2021-2031 ($BILLION)
- FIGURE 31. JAPAN IMPACT INVESTING MARKET, 2021-2031 ($BILLION)
- FIGURE 32. INDIA IMPACT INVESTING MARKET, 2021-2031 ($BILLION)
- FIGURE 33. AUSTRALIA IMPACT INVESTING MARKET, 2021-2031 ($BILLION)
- FIGURE 34. SOUTH KOREA IMPACT INVESTING MARKET, 2021-2031 ($BILLION)
- FIGURE 35. REST OF ASIA-PACIFIC IMPACT INVESTING MARKET, 2021-2031 ($BILLION)
- FIGURE 36. LATIN AMERICA IMPACT INVESTING MARKET, 2021-2031 ($BILLION)
- FIGURE 37. MIDDLE EAST IMPACT INVESTING MARKET, 2021-2031 ($BILLION)
- FIGURE 38. AFRICA IMPACT INVESTING MARKET, 2021-2031 ($BILLION)
- FIGURE 39. TOP WINNING STRATEGIES, BY YEAR
- FIGURE 40. TOP WINNING STRATEGIES, BY DEVELOPMENT
- FIGURE 41. TOP WINNING STRATEGIES, BY COMPANY
- FIGURE 42. PRODUCT MAPPING OF TOP 10 PLAYERS
- FIGURE 43. COMPETITIVE DASHBOARD
- FIGURE 44. COMPETITIVE HEATMAP: IMPACT INVESTING MARKET
- FIGURE 45. TOP PLAYER POSITIONING, 2021
- FIGURE 46. MORGAN STANLEY: NET REVENUE, 2019-2021 ($MILLION)
- FIGURE 47. MORGAN STANLEY: REVENUE SHARE BY SEGMENT, 2021 (%)
- FIGURE 48. MORGAN STANLEY: REVENUE SHARE BY REGION, 2020 (%)
- FIGURE 49. OMIDYAR NETWORK: NET REVENUE, 2019-2021 ($MILLION)
- FIGURE 50. MANULIFE INVESTMENT MANAGEMENT.: NET REVENUE, 2019-2021 ($MILLION)
- FIGURE 51. MANULIFE INVESTMENT MANAGEMENT.: REVENUE SHARE BY SEGMENT, 2021 (%)
- FIGURE 52. MANULIFE INVESTMENT MANAGEMENT.: REVENUE SHARE BY REGION, 2021 (%)
- FIGURE 53. REINVESTMENT FUND: NET REVENUE, 2019-2021 ($MILLION)
- FIGURE 54. GOLDMAN SACHS: NET REVENUE, 2019-2021 ($MILLION)
- FIGURE 55. GOLDMAN SACHS: REVENUE SHARE BY SEGMENT, 2021 (%)
- FIGURE 56. GOLDMAN SACHS: REVENUE SHARE BY REGION, 2021 (%)
Impact investing is an investment strategy that aims to have positive social or environmental effect along with financial gains for the investor. These investments can take various forms, such as equity or debt investments in companies or funds that focus on addressing social or environmental challenges, such as poverty, climate change, education, or healthcare. The primary objective of impact investment is to create measurable and sustainable positive social or environmental change, while also achieving a financial return for investors. Impact investing has gained momentum in recent years as investors seek to balance their financial goals with their values and address pressing social and environmental issues.
Increase in awareness of the need to address social and environmental challenges is a major driving factor for the impact investing market as societal concerns including wealth inequality, poverty, and access to healthcare and education are gaining popularity. Furthermore, rise in demand from investors seeking both financial returns and social or environmental impact and government support and policies to promote impact investing are major driving factors for the impact investing market. However, limited understanding of impact investing among investors and the general public is a major factor hampering the growth of the market as confusion between impact investing and other terms such as socially responsible investing (SRI) or environmental, social, and governance (ESG) investing can lead to negative impact on the market. Furthermore, challenges in achieving both financial returns and social or environmental impact is a major restraining factor for the market growth. On the contrary, collaboration between impact investors, government, and other stakeholders to address social and environmental challenges is projected to provide major lucrative opportunities for the growth of the market.
The global impact investing market is segmented on the basis of sector, investor, and region. On the basis of sector, it is divided into education, agriculture, healthcare, energy, housing and others. On the basis of investor, it is classified into individual investors, institutional investors and others. On the basis of region, it is analyzed across North America, Europe, Asia-Pacific, and LAMEA.
The report analyzes the profiles of key players operating in the impact investing market such as Morgan Stanley, Leapfrog Investments, Omidyar Network, Bridges Fund Management Ltd., Vital Capital, blueorchard finance ltd, Manulife Investment Management., Reinvestment Fund, Goldman Sachs and Bain Capital. These players have adopted various strategies to increase their market penetration and strengthen their position in the impact investing market.
Key benefits for stakeholders
- The study provides in-depth analysis of the global impact investing market along with the current & future trends to illustrate the imminent investment pockets.
- Information about key drivers, restrains, & opportunities and their impact analysis on the global impact investing market size are provided in the report.
- Porter's five forces analysis illustrates the potency of buyers and suppliers operating in the industry.
- The quantitative analysis of the global impact investing market from 2022 to 2031 is provided to determine the market potential.
- .
Key Market Segments
By Sector
- Education
- Agriculture
- Healthcare
- Energy
- Housing
- Others
By Investor
- Individual Investors
- Institutional Investors
- Others
By Region
- North America
- U.S.
- Canada
- Europe
- UK
- Germany
- France
- Italy
- Spain
- Rest of Europe
- Asia-Pacific
- China
- Japan
- India
- Australia
- South Korea
- Rest of Asia-Pacific
- LAMEA
- Latin America
- Middle East
- Africa
Key Market Players:
- Goldman Sachs
- Morgan Stanley
- Blueorchard finance ltd
- Bridges fund management ltd.
- Vital Capital
- Reinvestment fund
- Manulife Investment Management.
- Bain capital
- Leapfrog investments
- Omidyar network
TABLE OF CONTENTS
CHAPTER 1: INTRODUCTION
- 1.1. Report description
- 1.2. Key market segments
- 1.3. Key benefits to the stakeholders
- 1.4. Research Methodology
- 1.4.1. Primary research
- 1.4.2. Secondary research
- 1.4.3. Analyst tools and models
CHAPTER 2: EXECUTIVE SUMMARY
- 2.1. CXO Perspective
CHAPTER 3: MARKET OVERVIEW
- 3.1. Market definition and scope
- 3.2. Key findings
- 3.2.1. Top impacting factors
- 3.2.2. Top investment pockets
- 3.3. Porter's five forces analysis
- 3.3.1. Bargaining power of suppliers
- 3.3.2. Bargaining power of buyers
- 3.3.3. Threat of substitutes
- 3.3.4. Threat of new entrants
- 3.3.5. Intensity of rivalry
- 3.4. Market dynamics
- 3.4.1. Drivers
- 3.4.1.1. Surge in demand from investors seeking both financial returns and social or environmental impact
- 3.4.1.2. Increase in awareness of the need to address social and environmental challenges
- 3.4.1.3. Government support and policies to promote impact investing
- 3.4.1. Drivers
- 3.4.2. Restraints
- 3.4.2.1. Challenges in achieving both financial returns and social or environmental impact
- 3.4.2.2. Limited understanding of impact investing among investors and the general public
- 3.4.3. Opportunities
- 3.4.3.1. Rise in demand for impact investment products from institutional investors and high-net-worth individuals
- 3.4.3.2. Collaboration between impact investors, government, and other stakeholders to address social and environmental challenges
- 3.5. COVID-19 Impact Analysis on the market
CHAPTER 4: IMPACT INVESTING MARKET, BY SECTOR
- 4.1. Overview
- 4.1.1. Market size and forecast
- 4.2. Education
- 4.2.1. Key market trends, growth factors and opportunities
- 4.2.2. Market size and forecast, by region
- 4.2.3. Market share analysis by country
- 4.3. Agriculture
- 4.3.1. Key market trends, growth factors and opportunities
- 4.3.2. Market size and forecast, by region
- 4.3.3. Market share analysis by country
- 4.4. Healthcare
- 4.4.1. Key market trends, growth factors and opportunities
- 4.4.2. Market size and forecast, by region
- 4.4.3. Market share analysis by country
- 4.5. Energy
- 4.5.1. Key market trends, growth factors and opportunities
- 4.5.2. Market size and forecast, by region
- 4.5.3. Market share analysis by country
- 4.6. Housing
- 4.6.1. Key market trends, growth factors and opportunities
- 4.6.2. Market size and forecast, by region
- 4.6.3. Market share analysis by country
- 4.7. Others
- 4.7.1. Key market trends, growth factors and opportunities
- 4.7.2. Market size and forecast, by region
- 4.7.3. Market share analysis by country
CHAPTER 5: IMPACT INVESTING MARKET, BY INVESTOR
- 5.1. Overview
- 5.1.1. Market size and forecast
- 5.2. Individual Investors
- 5.2.1. Key market trends, growth factors and opportunities
- 5.2.2. Market size and forecast, by region
- 5.2.3. Market share analysis by country
- 5.3. Institutional Investors
- 5.3.1. Key market trends, growth factors and opportunities
- 5.3.2. Market size and forecast, by region
- 5.3.3. Market share analysis by country
- 5.4. Others
- 5.4.1. Key market trends, growth factors and opportunities
- 5.4.2. Market size and forecast, by region
- 5.4.3. Market share analysis by country
CHAPTER 6: IMPACT INVESTING MARKET, BY REGION
- 6.1. Overview
- 6.1.1. Market size and forecast By Region
- 6.2. North America
- 6.2.1. Key trends and opportunities
- 6.2.2. Market size and forecast, by Sector
- 6.2.3. Market size and forecast, by Investor
- 6.2.4. Market size and forecast, by country
- 6.2.4.1. U.S.
- 6.2.4.1.1. Key market trends, growth factors and opportunities
- 6.2.4.1.2. Market size and forecast, by Sector
- 6.2.4.1.3. Market size and forecast, by Investor
- 6.2.4.2. Canada
- 6.2.4.2.1. Key market trends, growth factors and opportunities
- 6.2.4.2.2. Market size and forecast, by Sector
- 6.2.4.2.3. Market size and forecast, by Investor
- 6.3. Europe
- 6.3.1. Key trends and opportunities
- 6.3.2. Market size and forecast, by Sector
- 6.3.3. Market size and forecast, by Investor
- 6.3.4. Market size and forecast, by country
- 6.3.4.1. UK
- 6.3.4.1.1. Key market trends, growth factors and opportunities
- 6.3.4.1.2. Market size and forecast, by Sector
- 6.3.4.1.3. Market size and forecast, by Investor
- 6.3.4.2. Germany
- 6.3.4.2.1. Key market trends, growth factors and opportunities
- 6.3.4.2.2. Market size and forecast, by Sector
- 6.3.4.2.3. Market size and forecast, by Investor
- 6.3.4.3. France
- 6.3.4.3.1. Key market trends, growth factors and opportunities
- 6.3.4.3.2. Market size and forecast, by Sector
- 6.3.4.3.3. Market size and forecast, by Investor
- 6.3.4.4. Italy
- 6.3.4.4.1. Key market trends, growth factors and opportunities
- 6.3.4.4.2. Market size and forecast, by Sector
- 6.3.4.4.3. Market size and forecast, by Investor
- 6.3.4.5. Spain
- 6.3.4.5.1. Key market trends, growth factors and opportunities
- 6.3.4.5.2. Market size and forecast, by Sector
- 6.3.4.5.3. Market size and forecast, by Investor
- 6.3.4.6. Rest of Europe
- 6.3.4.6.1. Key market trends, growth factors and opportunities
- 6.3.4.6.2. Market size and forecast, by Sector
- 6.3.4.6.3. Market size and forecast, by Investor
- 6.4. Asia-Pacific
- 6.4.1. Key trends and opportunities
- 6.4.2. Market size and forecast, by Sector
- 6.4.3. Market size and forecast, by Investor
- 6.4.4. Market size and forecast, by country
- 6.4.4.1. China
- 6.4.4.1.1. Key market trends, growth factors and opportunities
- 6.4.4.1.2. Market size and forecast, by Sector
- 6.4.4.1.3. Market size and forecast, by Investor
- 6.4.4.2. Japan
- 6.4.4.2.1. Key market trends, growth factors and opportunities
- 6.4.4.2.2. Market size and forecast, by Sector
- 6.4.4.2.3. Market size and forecast, by Investor
- 6.4.4.3. India
- 6.4.4.3.1. Key market trends, growth factors and opportunities
- 6.4.4.3.2. Market size and forecast, by Sector
- 6.4.4.3.3. Market size and forecast, by Investor
- 6.4.4.4. Australia
- 6.4.4.4.1. Key market trends, growth factors and opportunities
- 6.4.4.4.2. Market size and forecast, by Sector
- 6.4.4.4.3. Market size and forecast, by Investor
- 6.4.4.5. South Korea
- 6.4.4.5.1. Key market trends, growth factors and opportunities
- 6.4.4.5.2. Market size and forecast, by Sector
- 6.4.4.5.3. Market size and forecast, by Investor
- 6.4.4.6. Rest of Asia-Pacific
- 6.4.4.6.1. Key market trends, growth factors and opportunities
- 6.4.4.6.2. Market size and forecast, by Sector
- 6.4.4.6.3. Market size and forecast, by Investor
- 6.5. LAMEA
- 6.5.1. Key trends and opportunities
- 6.5.2. Market size and forecast, by Sector
- 6.5.3. Market size and forecast, by Investor
- 6.5.4. Market size and forecast, by country
- 6.5.4.1. Latin America
- 6.5.4.1.1. Key market trends, growth factors and opportunities
- 6.5.4.1.2. Market size and forecast, by Sector
- 6.5.4.1.3. Market size and forecast, by Investor
- 6.5.4.2. Middle East
- 6.5.4.2.1. Key market trends, growth factors and opportunities
- 6.5.4.2.2. Market size and forecast, by Sector
- 6.5.4.2.3. Market size and forecast, by Investor
- 6.5.4.3. Africa
- 6.5.4.3.1. Key market trends, growth factors and opportunities
- 6.5.4.3.2. Market size and forecast, by Sector
- 6.5.4.3.3. Market size and forecast, by Investor
CHAPTER 7: COMPETITIVE LANDSCAPE
- 7.1. Introduction
- 7.2. Top winning strategies
- 7.3. Product Mapping of Top 10 Player
- 7.4. Competitive Dashboard
- 7.5. Competitive Heatmap
- 7.6. Top player positioning, 2021
CHAPTER 8: COMPANY PROFILES
- 8.1. Morgan Stanley
- 8.1.1. Company overview
- 8.1.2. Key Executives
- 8.1.3. Company snapshot
- 8.1.4. Operating business segments
- 8.1.5. Product portfolio
- 8.1.6. Business performance
- 8.1.7. Key strategic moves and developments
- 8.2. Leapfrog investments
- 8.2.1. Company overview
- 8.2.2. Key Executives
- 8.2.3. Company snapshot
- 8.2.4. Operating business segments
- 8.2.5. Product portfolio
- 8.2.6. Key strategic moves and developments
- 8.3. Omidyar network
- 8.3.1. Company overview
- 8.3.2. Key Executives
- 8.3.3. Company snapshot
- 8.3.4. Operating business segments
- 8.3.5. Product portfolio
- 8.3.6. Business performance
- 8.4. Bridges fund management ltd.
- 8.4.1. Company overview
- 8.4.2. Key Executives
- 8.4.3. Company snapshot
- 8.4.4. Operating business segments
- 8.4.5. Product portfolio
- 8.5. Vital Capital
- 8.5.1. Company overview
- 8.5.2. Key Executives
- 8.5.3. Company snapshot
- 8.5.4. Operating business segments
- 8.5.5. Product portfolio
- 8.5.6. Key strategic moves and developments
- 8.6. Blueorchard finance ltd
- 8.6.1. Company overview
- 8.6.2. Key Executives
- 8.6.3. Company snapshot
- 8.6.4. Operating business segments
- 8.6.5. Product portfolio
- 8.6.6. Key strategic moves and developments
- 8.7. Manulife Investment Management.
- 8.7.1. Company overview
- 8.7.2. Key Executives
- 8.7.3. Company snapshot
- 8.7.4. Operating business segments
- 8.7.5. Product portfolio
- 8.7.6. Business performance
- 8.7.7. Key strategic moves and developments
- 8.8. Reinvestment fund
- 8.8.1. Company overview
- 8.8.2. Key Executives
- 8.8.3. Company snapshot
- 8.8.4. Operating business segments
- 8.8.5. Product portfolio
- 8.8.6. Business performance
- 8.9. Goldman Sachs
- 8.9.1. Company overview
- 8.9.2. Key Executives
- 8.9.3. Company snapshot
- 8.9.4. Operating business segments
- 8.9.5. Product portfolio
- 8.9.6. Business performance
- 8.10. Bain capital
- 8.10.1. Company overview
- 8.10.2. Key Executives
- 8.10.3. Company snapshot
- 8.10.4. Operating business segments
- 8.10.5. Product portfolio