 |
市場調査レポート
商品コード
1298212
ベアメタルクラウド市場:サービスタイプ別、企業規模別(大企業、中小企業)、業界別:2021年~2031年の世界機会分析と産業予測Bare Metal Cloud Market By Service Type, By Enterprise Size (Large Enterprises, Small and Medium Enterprise ), By Industry Vertical : Global Opportunity Analysis and Industry Forecast, 2021-2031 |
||||||

| ベアメタルクラウド市場:サービスタイプ別、企業規模別(大企業、中小企業)、業界別:2021年~2031年の世界機会分析と産業予測 |
|
出版日: 2023年03月01日
発行: Allied Market Research
ページ情報: 英文 355 Pages
納期: 2~3営業日
|
- 全表示
- 概要
- 図表
- 目次
ベアメタルクラウドは、より厳重なセキュリティを提供します。
ベアメタルサーバーを導入する組織は、仮想化レイヤーを制御し、クラウドのセキュリティニーズに合わせて構成することができます。ベアメタル・インフラストラクチャでは、仮想化されたベアメタル・サーバ・インフラストラクチャを使用する場合と比較して、ユーザはデータやオペレーティング・システムをより高度に制御できます。さらに、ベアメタルクラウドサーバーは、OSライセンスやハイパーバイザーライセンスを支払う必要がないため、一般的にコストが低くなります。また、ベアメタルクラウドのユーザーは、専用のハードウェアを持つのではなく、他のベアメタルユーザーと物理サーバーを共有するため、サーバーインフラや帯域幅の要件も軽減されます。
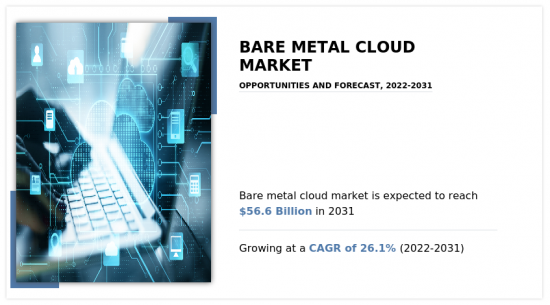
ベアメタルクラウドの利用拡大とBFSI分野での利用拡大が市場の成長を後押ししています。また、ベアメタルクラウドのコスト効率の良さが市場の成長を後押ししています。しかし、軽量ハイパーバイザーへの再注目とベアメタルクラウドのマイナス面が、この市場の成長を制限しています。逆に、新興技術への投資は爆発的に増加しており、予測期間中の市場拡大に多くの機会を提供すると予想されます。
目次
第1章 イントロダクション
第2章 エグゼクティブサマリー
第3章 市場概要
- 市場の定義と範囲
- 主な調査結果
- 影響要因
- 主な投資ポケット
- ポーターのファイブフォース分析
- 供給企業の交渉力
- 買い手の交渉力
- 代替品の脅威
- 新規参入業者の脅威
- 競合の激しさ
- 市場力学
- 促進要因
- ベアメタルクラウドの利用拡大
- BFSI分野での利用拡大
- 抑制要因
- 軽量ハイパーバイザーへの再注目
- ベアメタルクラウドのマイナス面
- 機会
- 新興テクノロジーへの投資が爆発的に増加
- 促進要因
- COVID-19の市場への影響分析
第4章 ベアメタルクラウド市場:サービスタイプ別
- 概要
- 市場規模と予測
- ネットワークサービス
- 主な市場動向、成長要因、成長機会
- 市場規模・予測:地域別
- 市場シェア分析:国別
- コンピュートサービス
- 主な市場動向、成長要因、機会
- 市場規模・予測:地域別
- 市場シェア分析:国別
- データベースサービス
- 主な市場動向、成長要因、機会
- 市場規模・予測:地域別
- 市場シェア分析:国別
- セキュリティサービス
- 主要市場動向、成長要因、機会
- 市場規模・予測:地域別
- 市場シェア分析:国別
- ストレージサービス
- 主要市場動向、成長要因、機会
- 市場規模・予測:地域別
- 市場シェア分析:国別
第5章 ベアメタルクラウド市場:企業規模別
- 概要
- 市場規模および予測
- 大企業
- 主な市場動向、成長要因、成長機会
- 市場規模・予測:地域別
- 市場シェア分析:国別
- 中小企業
- 主な市場動向、成長要因、機会
- 市場規模・予測:地域別
- 市場シェア分析:国別
第6章 ベアメタルクラウド市場:業界別
- 概要
- 市場規模と予測
- BFSI市場
- 主要市場動向、成長要因、成長機会
- 市場規模・予測:地域別
- 市場シェア分析:国別
- IT・通信
- 主な市場動向、成長要因、機会
- 市場規模・予測:地域別
- 市場シェア分析:国別
- 小売・消費財
- 主な市場動向、成長要因、機会
- 市場規模・予測:地域別
- 市場シェア分析:国別
- ヘルスケアとライフサイエンス
- 主要市場動向、成長要因、機会
- 市場規模・予測:地域別
- 市場シェア分析:国別
- 製造業
- 主要市場動向、成長要因、機会
- 市場規模・予測:地域別
- 市場シェア分析:国別
- 官公庁
- 主要市場動向、成長要因、機会
- 市場規模・予測:地域別
- 市場シェア分析:国別
- その他
- 主な市場動向、成長要因、機会
- 市場規模・予測:地域別
- 市場シェア分析:国別
第7章 ベアメタルクラウド市場:地域別
- 概要
- 市場規模・予測: 地域別
- 北米
- 主要動向とビジネスチャンス
- 市場規模・予測:サービスタイプ別
- 市場規模・予測:企業規模別
- 市場規模・予測:業界別
- 市場規模・予測:国別
- 米国
- 主要市場動向、成長要因、成長機会
- 市場規模・予測:サービスタイプ別
- 市場規模・予測:企業規模別
- 市場規模・予測:業界別
- カナダ
- 主要市場動向、成長要因、機会
- 市場規模・予測:サービスタイプ別
- 市場規模・予測:企業規模別
- 市場規模・予測:業界別
- 欧州
- 主要動向と機会
- 市場規模・予測:サービスタイプ別
- 市場規模・予測:企業規模別
- 市場規模・予測:業界別
- 市場規模・予測:国別
- 英国
- 主要市場動向、成長要因、成長機会
- 市場規模・予測:サービスタイプ別
- 市場規模・予測:企業規模別
- 市場規模・予測:業界別
- ドイツ
- 主要市場動向、成長要因、機会
- 市場規模・予測:サービスタイプ別
- 市場規模・予測:企業規模別
- 市場規模・予測:業界別
- フランス
- 主要市場動向、成長要因、機会
- 市場規模・予測:サービスタイプ別
- 市場規模・予測:企業規模別
- 市場規模・予測:業界別
- イタリア
- 主要市場動向、成長要因、機会
- 市場規模・予測:サービスタイプ別
- 市場規模・予測:企業規模別
- 市場規模・予測:業界別
- スペイン
- 主要市場動向、成長要因、機会
- 市場規模・予測:サービスタイプ別
- 市場規模・予測:企業規模別
- 市場規模・予測:業界別
- その他欧州
- 主要市場動向、成長要因、機会
- 市場規模・予測:サービスタイプ別
- 市場規模・予測:企業規模別
- 市場規模・予測:業界別
- アジア太平洋地域
- 主要動向と機会
- 市場規模・予測:サービスタイプ別
- 市場規模・予測:企業規模別
- 市場規模・予測:業界別
- 市場規模・予測:国別
- 中国
- 主要市場動向、成長要因、成長機会
- 市場規模・予測:サービスタイプ別
- 市場規模・予測:企業規模別
- 市場規模・予測:業界別
- インド
- 主な市場動向、成長要因、機会
- 市場規模・予測:サービスタイプ別
- 市場規模・予測:企業規模別
- 市場規模・予測:業界別
- 日本
- 主な市場動向、成長要因、機会
- 市場規模・予測:サービスタイプ別
- 市場規模・予測:企業規模別
- 市場規模・予測:業界別
- オーストラリア
- 主な市場動向、成長要因、機会
- 市場規模・予測:サービスタイプ別
- 市場規模・予測:企業規模別
- 市場規模・予測:業界別
- 韓国
- 主要市場動向、成長要因、機会
- 市場規模・予測:サービスタイプ別
- 市場規模・予測:企業規模別
- 市場規模・予測:業界別
- その他アジア太平洋地域
- 主な市場動向、成長要因、機会
- 市場規模・予測:サービスタイプ別
- 市場規模・予測:企業規模別
- 市場規模・予測:業界別
- ラテンアメリカ・中東・アフリカ
- 主要動向と機会
- 市場規模・予測:サービスタイプ別
- 市場規模・予測:企業規模別
- 市場規模・予測:業界別
- 市場規模・予測:国別
- ラテンアメリカ
- 主要市場動向、成長要因、成長機会
- 市場規模・予測:サービスタイプ別
- 市場規模・予測:企業規模別
- 市場規模・予測:業界別
- 中東
- 主要市場動向、成長要因、機会
- 市場規模・予測:サービスタイプ別
- 市場規模・予測:企業規模別
- 市場規模・予測:業界別
- アフリカ
- 主要市場動向、成長要因、機会
- 市場規模・予測:サービスタイプ別
- 市場規模・予測:企業規模別
- 市場規模・予測:業界別
第8章 競合情勢
- イントロダクション
- 主要成功戦略
- 主要10社の製品マッピング
- 競合ダッシュボード
- 競合ヒートマップ
- 主要企業のポジショニング、2021年
第9章 企業プロファイル
- International Business Machines Corporation
- Oracle Corporation
- LUMEN TECHNOLOGIES
- Internap Holding LLC
- Amazon Web Services, Inc.
- Dell Technologies Inc.
- Google LLC
- Microsoft Corporation
- RACKSPACE TECHNOLOGY
- Alibaba Cloud
LIST OF TABLES
- TABLE 01. GLOBAL BARE METAL CLOUD MARKET, BY SERVICE TYPE, 2021-2031 ($MILLION)
- TABLE 02. BARE METAL CLOUD MARKET FOR NETWORKING SERVICES, BY REGION, 2021-2031 ($MILLION)
- TABLE 03. BARE METAL CLOUD MARKET FOR COMPUTE SERVICES, BY REGION, 2021-2031 ($MILLION)
- TABLE 04. BARE METAL CLOUD MARKET FOR DATABASE SERVICES, BY REGION, 2021-2031 ($MILLION)
- TABLE 05. BARE METAL CLOUD MARKET FOR SECURITY SERVICES, BY REGION, 2021-2031 ($MILLION)
- TABLE 06. BARE METAL CLOUD MARKET FOR STORAGE SERVICES, BY REGION, 2021-2031 ($MILLION)
- TABLE 07. GLOBAL BARE METAL CLOUD MARKET, BY ENTERPRISE SIZE, 2021-2031 ($MILLION)
- TABLE 08. BARE METAL CLOUD MARKET FOR LARGE ENTERPRISES, BY REGION, 2021-2031 ($MILLION)
- TABLE 09. BARE METAL CLOUD MARKET FOR SMALL AND MEDIUM ENTERPRISE (SMES), BY REGION, 2021-2031 ($MILLION)
- TABLE 10. GLOBAL BARE METAL CLOUD MARKET, BY INDUSTRY VERTICAL, 2021-2031 ($MILLION)
- TABLE 11. BARE METAL CLOUD MARKET FOR BFSI, BY REGION, 2021-2031 ($MILLION)
- TABLE 12. BARE METAL CLOUD MARKET FOR IT AND TELECOM, BY REGION, 2021-2031 ($MILLION)
- TABLE 13. BARE METAL CLOUD MARKET FOR RETAIL AND CONSUMER GOODS, BY REGION, 2021-2031 ($MILLION)
- TABLE 14. BARE METAL CLOUD MARKET FOR HEALTHCARE AND LIFE SCIENCES, BY REGION, 2021-2031 ($MILLION)
- TABLE 15. BARE METAL CLOUD MARKET FOR MANUFACTURING, BY REGION, 2021-2031 ($MILLION)
- TABLE 16. BARE METAL CLOUD MARKET FOR GOVERNMENT, BY REGION, 2021-2031 ($MILLION)
- TABLE 17. BARE METAL CLOUD MARKET FOR OTHERS, BY REGION, 2021-2031 ($MILLION)
- TABLE 18. BARE METAL CLOUD MARKET, BY REGION, 2021-2031 ($MILLION)
- TABLE 19. NORTH AMERICA BARE METAL CLOUD MARKET, BY SERVICE TYPE, 2021-2031 ($MILLION)
- TABLE 20. NORTH AMERICA BARE METAL CLOUD MARKET, BY ENTERPRISE SIZE, 2021-2031 ($MILLION)
- TABLE 21. NORTH AMERICA BARE METAL CLOUD MARKET, BY INDUSTRY VERTICAL, 2021-2031 ($MILLION)
- TABLE 22. NORTH AMERICA BARE METAL CLOUD MARKET, BY COUNTRY, 2021-2031 ($MILLION)
- TABLE 23. U.S. BARE METAL CLOUD MARKET, BY SERVICE TYPE, 2021-2031 ($MILLION)
- TABLE 24. U.S. BARE METAL CLOUD MARKET, BY ENTERPRISE SIZE, 2021-2031 ($MILLION)
- TABLE 25. U.S. BARE METAL CLOUD MARKET, BY INDUSTRY VERTICAL, 2021-2031 ($MILLION)
- TABLE 26. CANADA BARE METAL CLOUD MARKET, BY SERVICE TYPE, 2021-2031 ($MILLION)
- TABLE 27. CANADA BARE METAL CLOUD MARKET, BY ENTERPRISE SIZE, 2021-2031 ($MILLION)
- TABLE 28. CANADA BARE METAL CLOUD MARKET, BY INDUSTRY VERTICAL, 2021-2031 ($MILLION)
- TABLE 29. EUROPE BARE METAL CLOUD MARKET, BY SERVICE TYPE, 2021-2031 ($MILLION)
- TABLE 30. EUROPE BARE METAL CLOUD MARKET, BY ENTERPRISE SIZE, 2021-2031 ($MILLION)
- TABLE 31. EUROPE BARE METAL CLOUD MARKET, BY INDUSTRY VERTICAL, 2021-2031 ($MILLION)
- TABLE 32. EUROPE BARE METAL CLOUD MARKET, BY COUNTRY, 2021-2031 ($MILLION)
- TABLE 33. UK BARE METAL CLOUD MARKET, BY SERVICE TYPE, 2021-2031 ($MILLION)
- TABLE 34. UK BARE METAL CLOUD MARKET, BY ENTERPRISE SIZE, 2021-2031 ($MILLION)
- TABLE 35. UK BARE METAL CLOUD MARKET, BY INDUSTRY VERTICAL, 2021-2031 ($MILLION)
- TABLE 36. GERMANY BARE METAL CLOUD MARKET, BY SERVICE TYPE, 2021-2031 ($MILLION)
- TABLE 37. GERMANY BARE METAL CLOUD MARKET, BY ENTERPRISE SIZE, 2021-2031 ($MILLION)
- TABLE 38. GERMANY BARE METAL CLOUD MARKET, BY INDUSTRY VERTICAL, 2021-2031 ($MILLION)
- TABLE 39. FRANCE BARE METAL CLOUD MARKET, BY SERVICE TYPE, 2021-2031 ($MILLION)
- TABLE 40. FRANCE BARE METAL CLOUD MARKET, BY ENTERPRISE SIZE, 2021-2031 ($MILLION)
- TABLE 41. FRANCE BARE METAL CLOUD MARKET, BY INDUSTRY VERTICAL, 2021-2031 ($MILLION)
- TABLE 42. ITALY BARE METAL CLOUD MARKET, BY SERVICE TYPE, 2021-2031 ($MILLION)
- TABLE 43. ITALY BARE METAL CLOUD MARKET, BY ENTERPRISE SIZE, 2021-2031 ($MILLION)
- TABLE 44. ITALY BARE METAL CLOUD MARKET, BY INDUSTRY VERTICAL, 2021-2031 ($MILLION)
- TABLE 45. SPAIN BARE METAL CLOUD MARKET, BY SERVICE TYPE, 2021-2031 ($MILLION)
- TABLE 46. SPAIN BARE METAL CLOUD MARKET, BY ENTERPRISE SIZE, 2021-2031 ($MILLION)
- TABLE 47. SPAIN BARE METAL CLOUD MARKET, BY INDUSTRY VERTICAL, 2021-2031 ($MILLION)
- TABLE 48. REST OF EUROPE BARE METAL CLOUD MARKET, BY SERVICE TYPE, 2021-2031 ($MILLION)
- TABLE 49. REST OF EUROPE BARE METAL CLOUD MARKET, BY ENTERPRISE SIZE, 2021-2031 ($MILLION)
- TABLE 50. REST OF EUROPE BARE METAL CLOUD MARKET, BY INDUSTRY VERTICAL, 2021-2031 ($MILLION)
- TABLE 51. ASIA-PACIFIC BARE METAL CLOUD MARKET, BY SERVICE TYPE, 2021-2031 ($MILLION)
- TABLE 52. ASIA-PACIFIC BARE METAL CLOUD MARKET, BY ENTERPRISE SIZE, 2021-2031 ($MILLION)
- TABLE 53. ASIA-PACIFIC BARE METAL CLOUD MARKET, BY INDUSTRY VERTICAL, 2021-2031 ($MILLION)
- TABLE 54. ASIA-PACIFIC BARE METAL CLOUD MARKET, BY COUNTRY, 2021-2031 ($MILLION)
- TABLE 55. CHINA BARE METAL CLOUD MARKET, BY SERVICE TYPE, 2021-2031 ($MILLION)
- TABLE 56. CHINA BARE METAL CLOUD MARKET, BY ENTERPRISE SIZE, 2021-2031 ($MILLION)
- TABLE 57. CHINA BARE METAL CLOUD MARKET, BY INDUSTRY VERTICAL, 2021-2031 ($MILLION)
- TABLE 58. INDIA BARE METAL CLOUD MARKET, BY SERVICE TYPE, 2021-2031 ($MILLION)
- TABLE 59. INDIA BARE METAL CLOUD MARKET, BY ENTERPRISE SIZE, 2021-2031 ($MILLION)
- TABLE 60. INDIA BARE METAL CLOUD MARKET, BY INDUSTRY VERTICAL, 2021-2031 ($MILLION)
- TABLE 61. JAPAN BARE METAL CLOUD MARKET, BY SERVICE TYPE, 2021-2031 ($MILLION)
- TABLE 62. JAPAN BARE METAL CLOUD MARKET, BY ENTERPRISE SIZE, 2021-2031 ($MILLION)
- TABLE 63. JAPAN BARE METAL CLOUD MARKET, BY INDUSTRY VERTICAL, 2021-2031 ($MILLION)
- TABLE 64. AUSTRALIA BARE METAL CLOUD MARKET, BY SERVICE TYPE, 2021-2031 ($MILLION)
- TABLE 65. AUSTRALIA BARE METAL CLOUD MARKET, BY ENTERPRISE SIZE, 2021-2031 ($MILLION)
- TABLE 66. AUSTRALIA BARE METAL CLOUD MARKET, BY INDUSTRY VERTICAL, 2021-2031 ($MILLION)
- TABLE 67. SOUTH KOREA BARE METAL CLOUD MARKET, BY SERVICE TYPE, 2021-2031 ($MILLION)
- TABLE 68. SOUTH KOREA BARE METAL CLOUD MARKET, BY ENTERPRISE SIZE, 2021-2031 ($MILLION)
- TABLE 69. SOUTH KOREA BARE METAL CLOUD MARKET, BY INDUSTRY VERTICAL, 2021-2031 ($MILLION)
- TABLE 70. REST OF ASIA-PACIFIC BARE METAL CLOUD MARKET, BY SERVICE TYPE, 2021-2031 ($MILLION)
- TABLE 71. REST OF ASIA-PACIFIC BARE METAL CLOUD MARKET, BY ENTERPRISE SIZE, 2021-2031 ($MILLION)
- TABLE 72. REST OF ASIA-PACIFIC BARE METAL CLOUD MARKET, BY INDUSTRY VERTICAL, 2021-2031 ($MILLION)
- TABLE 73. LAMEA BARE METAL CLOUD MARKET, BY SERVICE TYPE, 2021-2031 ($MILLION)
- TABLE 74. LAMEA BARE METAL CLOUD MARKET, BY ENTERPRISE SIZE, 2021-2031 ($MILLION)
- TABLE 75. LAMEA BARE METAL CLOUD MARKET, BY INDUSTRY VERTICAL, 2021-2031 ($MILLION)
- TABLE 76. LAMEA BARE METAL CLOUD MARKET, BY COUNTRY, 2021-2031 ($MILLION)
- TABLE 77. LATIN AMERICA BARE METAL CLOUD MARKET, BY SERVICE TYPE, 2021-2031 ($MILLION)
- TABLE 78. LATIN AMERICA BARE METAL CLOUD MARKET, BY ENTERPRISE SIZE, 2021-2031 ($MILLION)
- TABLE 79. LATIN AMERICA BARE METAL CLOUD MARKET, BY INDUSTRY VERTICAL, 2021-2031 ($MILLION)
- TABLE 80. MIDDLE EAST BARE METAL CLOUD MARKET, BY SERVICE TYPE, 2021-2031 ($MILLION)
- TABLE 81. MIDDLE EAST BARE METAL CLOUD MARKET, BY ENTERPRISE SIZE, 2021-2031 ($MILLION)
- TABLE 82. MIDDLE EAST BARE METAL CLOUD MARKET, BY INDUSTRY VERTICAL, 2021-2031 ($MILLION)
- TABLE 83. AFRICA BARE METAL CLOUD MARKET, BY SERVICE TYPE, 2021-2031 ($MILLION)
- TABLE 84. AFRICA BARE METAL CLOUD MARKET, BY ENTERPRISE SIZE, 2021-2031 ($MILLION)
- TABLE 85. AFRICA BARE METAL CLOUD MARKET, BY INDUSTRY VERTICAL, 2021-2031 ($MILLION)
- TABLE 86. INTERNATIONAL BUSINESS MACHINES CORPORATION: KEY EXECUTIVES
- TABLE 87. INTERNATIONAL BUSINESS MACHINES CORPORATION: COMPANY SNAPSHOT
- TABLE 88. INTERNATIONAL BUSINESS MACHINES CORPORATION: SERVICE SEGMENTS
- TABLE 89. INTERNATIONAL BUSINESS MACHINES CORPORATION: PRODUCT PORTFOLIO
- TABLE 90. INTERNATIONAL BUSINESS MACHINES CORPORATION: KEY STRATERGIES
- TABLE 91. ORACLE CORPORATION: KEY EXECUTIVES
- TABLE 92. ORACLE CORPORATION: COMPANY SNAPSHOT
- TABLE 93. ORACLE CORPORATION: SERVICE SEGMENTS
- TABLE 94. ORACLE CORPORATION: PRODUCT PORTFOLIO
- TABLE 95. ORACLE CORPORATION: KEY STRATERGIES
- TABLE 96. LUMEN TECHNOLOGIES: KEY EXECUTIVES
- TABLE 97. LUMEN TECHNOLOGIES: COMPANY SNAPSHOT
- TABLE 98. LUMEN TECHNOLOGIES: SERVICE SEGMENTS
- TABLE 99. LUMEN TECHNOLOGIES: PRODUCT PORTFOLIO
- TABLE 100. LUMEN TECHNOLOGIES: KEY STRATERGIES
- TABLE 101. INTERNAP HOLDING LLC: KEY EXECUTIVES
- TABLE 102. INTERNAP HOLDING LLC: COMPANY SNAPSHOT
- TABLE 103. INTERNAP HOLDING LLC: SERVICE SEGMENTS
- TABLE 104. INTERNAP HOLDING LLC: PRODUCT PORTFOLIO
- TABLE 105. INTERNAP HOLDING LLC: KEY STRATERGIES
- TABLE 106. AMAZON WEB SERVICES, INC.: KEY EXECUTIVES
- TABLE 107. AMAZON WEB SERVICES, INC.: COMPANY SNAPSHOT
- TABLE 108. AMAZON WEB SERVICES, INC.: SERVICE SEGMENTS
- TABLE 109. AMAZON WEB SERVICES, INC.: PRODUCT PORTFOLIO
- TABLE 110. AMAZON WEB SERVICES, INC.: KEY STRATERGIES
- TABLE 111. DELL TECHNOLOGIES INC.: KEY EXECUTIVES
- TABLE 112. DELL TECHNOLOGIES INC.: COMPANY SNAPSHOT
- TABLE 113. DELL TECHNOLOGIES INC.: PRODUCT SEGMENTS
- TABLE 114. DELL TECHNOLOGIES INC.: PRODUCT PORTFOLIO
- TABLE 115. DELL TECHNOLOGIES INC.: KEY STRATERGIES
- TABLE 116. GOOGLE LLC: KEY EXECUTIVES
- TABLE 117. GOOGLE LLC: COMPANY SNAPSHOT
- TABLE 118. GOOGLE LLC: SERVICE SEGMENTS
- TABLE 119. GOOGLE LLC: PRODUCT PORTFOLIO
- TABLE 120. GOOGLE LLC: KEY STRATERGIES
- TABLE 121. MICROSOFT CORPORATION: KEY EXECUTIVES
- TABLE 122. MICROSOFT CORPORATION: COMPANY SNAPSHOT
- TABLE 123. MICROSOFT CORPORATION: SERVICE SEGMENTS
- TABLE 124. MICROSOFT CORPORATION: PRODUCT PORTFOLIO
- TABLE 125. MICROSOFT CORPORATION: KEY STRATERGIES
- TABLE 126. RACKSPACE TECHNOLOGY: KEY EXECUTIVES
- TABLE 127. RACKSPACE TECHNOLOGY: COMPANY SNAPSHOT
- TABLE 128. RACKSPACE TECHNOLOGY: SERVICE SEGMENTS
- TABLE 129. RACKSPACE TECHNOLOGY: PRODUCT PORTFOLIO
- TABLE 130. RACKSPACE TECHNOLOGY: KEY STRATERGIES
- TABLE 131. ALIBABA CLOUD: KEY EXECUTIVES
- TABLE 132. ALIBABA CLOUD: COMPANY SNAPSHOT
- TABLE 133. ALIBABA CLOUD: SERVICE SEGMENTS
- TABLE 134. ALIBABA CLOUD: PRODUCT PORTFOLIO
- TABLE 135. ALIBABA CLOUD: KEY STRATERGIES
LIST OF FIGURES
- FIGURE 01. BARE METAL CLOUD MARKET, 2021-2031
- FIGURE 02. SEGMENTATION OF BARE METAL CLOUD MARKET, 2021-2031
- FIGURE 03. TOP INVESTMENT POCKETS IN BARE METAL CLOUD MARKET (2022-2031)
- FIGURE 04. LOW BARGAINING POWER OF SUPPLIERS
- FIGURE 05. LOW BARGAINING POWER OF BUYERS
- FIGURE 06. LOW THREAT OF SUBSTITUTES
- FIGURE 07. LOW THREAT OF NEW ENTRANTS
- FIGURE 08. LOW INTENSITY OF RIVALRY
- FIGURE 09. DRIVERS, RESTRAINTS AND OPPORTUNITIES: GLOBALBARE METAL CLOUD MARKET
- FIGURE 10. BARE METAL CLOUD MARKET, BY SERVICE TYPE, 2021(%)
- FIGURE 11. COMPARATIVE SHARE ANALYSIS OF BARE METAL CLOUD MARKET FOR NETWORKING SERVICES, BY COUNTRY 2021 AND 2031(%)
- FIGURE 12. COMPARATIVE SHARE ANALYSIS OF BARE METAL CLOUD MARKET FOR COMPUTE SERVICES, BY COUNTRY 2021 AND 2031(%)
- FIGURE 13. COMPARATIVE SHARE ANALYSIS OF BARE METAL CLOUD MARKET FOR DATABASE SERVICES, BY COUNTRY 2021 AND 2031(%)
- FIGURE 14. COMPARATIVE SHARE ANALYSIS OF BARE METAL CLOUD MARKET FOR SECURITY SERVICES, BY COUNTRY 2021 AND 2031(%)
- FIGURE 15. COMPARATIVE SHARE ANALYSIS OF BARE METAL CLOUD MARKET FOR STORAGE SERVICES, BY COUNTRY 2021 AND 2031(%)
- FIGURE 16. BARE METAL CLOUD MARKET, BY ENTERPRISE SIZE, 2021(%)
- FIGURE 17. COMPARATIVE SHARE ANALYSIS OF BARE METAL CLOUD MARKET FOR LARGE ENTERPRISES, BY COUNTRY 2021 AND 2031(%)
- FIGURE 18. COMPARATIVE SHARE ANALYSIS OF BARE METAL CLOUD MARKET FOR SMALL AND MEDIUM ENTERPRISE (SMES), BY COUNTRY 2021 AND 2031(%)
- FIGURE 19. BARE METAL CLOUD MARKET, BY INDUSTRY VERTICAL, 2021(%)
- FIGURE 20. COMPARATIVE SHARE ANALYSIS OF BARE METAL CLOUD MARKET FOR BFSI, BY COUNTRY 2021 AND 2031(%)
- FIGURE 21. COMPARATIVE SHARE ANALYSIS OF BARE METAL CLOUD MARKET FOR IT AND TELECOM, BY COUNTRY 2021 AND 2031(%)
- FIGURE 22. COMPARATIVE SHARE ANALYSIS OF BARE METAL CLOUD MARKET FOR RETAIL AND CONSUMER GOODS, BY COUNTRY 2021 AND 2031(%)
- FIGURE 23. COMPARATIVE SHARE ANALYSIS OF BARE METAL CLOUD MARKET FOR HEALTHCARE AND LIFE SCIENCES, BY COUNTRY 2021 AND 2031(%)
- FIGURE 24. COMPARATIVE SHARE ANALYSIS OF BARE METAL CLOUD MARKET FOR MANUFACTURING, BY COUNTRY 2021 AND 2031(%)
- FIGURE 25. COMPARATIVE SHARE ANALYSIS OF BARE METAL CLOUD MARKET FOR GOVERNMENT, BY COUNTRY 2021 AND 2031(%)
- FIGURE 26. COMPARATIVE SHARE ANALYSIS OF BARE METAL CLOUD MARKET FOR OTHERS, BY COUNTRY 2021 AND 2031(%)
- FIGURE 27. BARE METAL CLOUD MARKET BY REGION, 2021
- FIGURE 28. U.S. BARE METAL CLOUD MARKET, 2021-2031 ($MILLION)
- FIGURE 29. CANADA BARE METAL CLOUD MARKET, 2021-2031 ($MILLION)
- FIGURE 30. UK BARE METAL CLOUD MARKET, 2021-2031 ($MILLION)
- FIGURE 31. GERMANY BARE METAL CLOUD MARKET, 2021-2031 ($MILLION)
- FIGURE 32. FRANCE BARE METAL CLOUD MARKET, 2021-2031 ($MILLION)
- FIGURE 33. ITALY BARE METAL CLOUD MARKET, 2021-2031 ($MILLION)
- FIGURE 34. SPAIN BARE METAL CLOUD MARKET, 2021-2031 ($MILLION)
- FIGURE 35. REST OF EUROPE BARE METAL CLOUD MARKET, 2021-2031 ($MILLION)
- FIGURE 36. CHINA BARE METAL CLOUD MARKET, 2021-2031 ($MILLION)
- FIGURE 37. INDIA BARE METAL CLOUD MARKET, 2021-2031 ($MILLION)
- FIGURE 38. JAPAN BARE METAL CLOUD MARKET, 2021-2031 ($MILLION)
- FIGURE 39. AUSTRALIA BARE METAL CLOUD MARKET, 2021-2031 ($MILLION)
- FIGURE 40. SOUTH KOREA BARE METAL CLOUD MARKET, 2021-2031 ($MILLION)
- FIGURE 41. REST OF ASIA-PACIFIC BARE METAL CLOUD MARKET, 2021-2031 ($MILLION)
- FIGURE 42. LATIN AMERICA BARE METAL CLOUD MARKET, 2021-2031 ($MILLION)
- FIGURE 43. MIDDLE EAST BARE METAL CLOUD MARKET, 2021-2031 ($MILLION)
- FIGURE 44. AFRICA BARE METAL CLOUD MARKET, 2021-2031 ($MILLION)
- FIGURE 45. TOP WINNING STRATEGIES, BY YEAR
- FIGURE 46. TOP WINNING STRATEGIES, BY DEVELOPMENT
- FIGURE 47. TOP WINNING STRATEGIES, BY COMPANY
- FIGURE 48. PRODUCT MAPPING OF TOP 10 PLAYERS
- FIGURE 49. COMPETITIVE DASHBOARD
- FIGURE 50. COMPETITIVE HEATMAP: BARE METAL CLOUD MARKET
- FIGURE 51. TOP PLAYER POSITIONING, 2021
- FIGURE 52. IBM CORPORATION: NET REVENUE, 2020-2022 ($MILLION)
- FIGURE 53. IBM CORPORATION: REVENUE SHARE BY SEGMENT, 2022 (%)
- FIGURE 54. IBM CORPORATION: REVENUE SHARE BY REGION, 2021 (%)
- FIGURE 55. ORACLE CORPORATION: NET REVENUE, 2020-2022 ($MILLION)
- FIGURE 56. ORACLE CORPORATION: RESEARCH & DEVELOPMENT EXPENDITURE, 2020-2022 ($MILLION)
- FIGURE 57. ORACLE CORPORATION: REVENUE SHARE BY SEGMENT, 2022 (%)
- FIGURE 58. ORACLE CORPORATION: REVENUE SHARE BY REGION, 2022 (%)
- FIGURE 59. LUMEN TECHNOLOGIES: NET REVENUE, 2019-2021 ($MILLION)
- FIGURE 60. AMAZON WEB SERVICES, INC.: NET REVENUE, 2019-2021 ($MILLION)
- FIGURE 61. AMAZON WEB SERVICES, INC.: REVENUE SHARE BY SEGMENT, 2021 (%)
- FIGURE 62. AMAZON WEB SERVICES, INC.: REVENUE SHARE BY REGION, 2021 (%)
- FIGURE 63. DELL TECHNOLOGIES INC.: NET REVENUE, 2020-2022 ($MILLION)
- FIGURE 64. DELL TECHNOLOGIES INC.: RESEARCH & DEVELOPMENT EXPENDITURE, 2020-2022
- FIGURE 65. DELL TECHNOLOGIES INC.: REVENUE SHARE BY SEGMENT, 2022 (%)
- FIGURE 66. DELL TECHNOLOGIES INC.: REVENUE SHARE BY REGION, 2022 (%)
- FIGURE 67. GOOGLE LLC: NET REVENUE, 2019-2021 ($MILLION)
- FIGURE 68. GOOGLE LLC: REVENUE SHARE BY SEGMENT, 2021 (%)
- FIGURE 69. GOOGLE LLC: REVENUE SHARE BY REGION, 2021 (%)
- FIGURE 70. MICROSOFT CORPORATION: NET REVENUE, 2020-2022 ($BILLION)
- FIGURE 71. MICROSOFT CORPORATION: RESEARCH & DEVELOPMENT EXPENDITURE, 2020-2022 ($BILLION)
- FIGURE 72. MICROSOFT CORPORATION: REVENUE SHARE BY SEGMENT, 2022 (%)
- FIGURE 73. MICROSOFT CORPORATION: REVENUE SHARE BY REGION, 2022 (%)
- FIGURE 74. RACKSPACE TECHNOLOGY: NET REVENUE, 2019-2021 ($MILLION)
- FIGURE 75. RACKSPACE TECHNOLOGY: REVENUE SHARE BY SEGMENT, 2021 (%)
- FIGURE 76. RACKSPACE TECHNOLOGY: REVENUE SHARE BY REGION, 2021 (%)
- FIGURE 77. ALIBABA CLOUD: NET REVENUE, 2019-2021 ($MILLION)
- FIGURE 78. ALIBABA CLOUD: REVENUE SHARE BY SEGMENT, 2021 (%)
The bare metal cloud offers higher tighter security. An organization that deploys bare metal servers controls the virtualization layer and can configure to meet its cloud security needs. With bare-metal infrastructures, users have a much greater degree of control over their data and operating systems compared to using a virtualized bare-metal server infrastructure. In addition, bare metal cloud servers are generally less expensive as there's no need to pay for OS licensing or hypervisor licensing. Server infrastructure and bandwidth requirements are also reduced because bare metal cloud users share physical servers with other bare metal users rather than having their own dedicated hardware.
Intensifying Utilization of Bare Metal Cloud and expanding application in the BFSI sector are driving the growth of the market. In addition, the cost-efficient benefits of bare metal cloud are fueling the growth of market. However, the renewed attention in lightweight hypervisors and negative aspects of bare metal cloud limit the growth of this market. Conversely, investment in emerging technologies Is exploding that is anticipated to provide numerous opportunities for the expansion of the market during the forecast period.
The global bare metal cloud market is segmented on the basis of service type, enterprise size, industry vertical and region. Based on service type, it is segregated into compute services, networking services, security services, database services, and storage services. Based on enterprise size, it is bifurcated into large enterprises and small and medium enterprises (SMEs). Based on industry vertical, it is divided into BFSI, IT & telecom, retail & consumer goods, government, healthcare and life science, manufacturing, and others. Based on region, it is analyzed across North America, Europe, Asia-Pacific, and LAMEA.
The global bare metal cloud industry is dominated by key players such as International Business Machine Corporation, Amazon Web Services, Inc., Oracle Corporation, Microsoft Corporation, Dell Technologies Inc., Google LLC, Rackspace Technology, Alibaba Cloud, Lumen Technologies, and Internap Holding LLC. These players have adopted various strategies to increase their market penetration and strengthen their position in the bare metal cloud industry.
Key Benefits For Stakeholders
- This report provides a quantitative analysis of the market segments, current trends, estimations, and dynamics of the bare metal cloud market analysis from 2021 to 2031 to identify the prevailing bare metal cloud market opportunities.
- The market research is offered along with information related to key drivers, restraints, and opportunities.
- Porter's five forces analysis highlights the potency of buyers and suppliers to enable stakeholders make profit-oriented business decisions and strengthen their supplier-buyer network.
- In-depth analysis of the bare metal cloud market segmentation assists to determine the prevailing market opportunities.
- Major countries in each region are mapped according to their revenue contribution to the global market.
- Market player positioning facilitates benchmarking and provides a clear understanding of the present position of the market players.
- The report includes the analysis of the regional as well as global bare metal cloud market trends, key players, market segments, application areas, and market growth strategies.
Key Market Segments
By Service Type
- Networking Services
- Compute Services
- Database Services
- Security Services
- Storage Services
By Enterprise Size
- Large Enterprises
- Small and Medium Enterprise (SMEs)
By Industry Vertical
- BFSI
- IT and Telecom
- Retail and Consumer Goods
- Healthcare and Life Sciences
- Manufacturing
- Government
- Others
By Region
- North America
- U.S.
- Canada
- Europe
- UK
- Germany
- France
- Italy
- Spain
- Rest of Europe
- Asia-Pacific
- China
- India
- Japan
- Australia
- South Korea
- Rest of Asia-Pacific
- LAMEA
- Latin America
- Middle East
- Africa
Key Market Players:
- RACKSPACE TECHNOLOGY
- LUMEN TECHNOLOGIES
- Internap Holding LLC
- Dell Technologies Inc.
- Amazon Web Services, Inc.
- Google LLC
- International Business Machines Corporation
- Oracle Corporation
- Microsoft Corporation
- Alibaba Cloud
TABLE OF CONTENTS
CHAPTER 1: INTRODUCTION
- 1.1. Report description
- 1.2. Key market segments
- 1.3. Key benefits to the stakeholders
- 1.4. Research Methodology
- 1.4.1. Primary research
- 1.4.2. Secondary research
- 1.4.3. Analyst tools and models
CHAPTER 2: EXECUTIVE SUMMARY
- 2.1. CXO Perspective
CHAPTER 3: MARKET OVERVIEW
- 3.1. Market definition and scope
- 3.2. Key findings
- 3.2.1. Top impacting factors
- 3.2.2. Top investment pockets
- 3.3. Porter's five forces analysis
- 3.3.1. Bargaining power of suppliers
- 3.3.2. Bargaining power of buyers
- 3.3.3. Threat of substitutes
- 3.3.4. Threat of new entrants
- 3.3.5. Intensity of rivalry
- 3.4. Market dynamics
- 3.4.1. Drivers
- 3.4.1.1. Intensifying Utilization of Bare Metal Cloud
- 3.4.1.2. Expanding application in the BFSI sector
- 3.4.1. Drivers
- 3.4.2. Restraints
- 3.4.2.1. Renewed Attention in Lightweight Hypervisors
- 3.4.2.2. Negative aspects of Bare Metal Cloud
- 3.4.3. Opportunities
- 3.4.3.1. Investment In Emerging Technologies Is Exploding
- 3.5. COVID-19 Impact Analysis on the market
CHAPTER 4: BARE METAL CLOUD MARKET, BY SERVICE TYPE
- 4.1. Overview
- 4.1.1. Market size and forecast
- 4.2. Networking Services
- 4.2.1. Key market trends, growth factors and opportunities
- 4.2.2. Market size and forecast, by region
- 4.2.3. Market share analysis by country
- 4.3. Compute Services
- 4.3.1. Key market trends, growth factors and opportunities
- 4.3.2. Market size and forecast, by region
- 4.3.3. Market share analysis by country
- 4.4. Database Services
- 4.4.1. Key market trends, growth factors and opportunities
- 4.4.2. Market size and forecast, by region
- 4.4.3. Market share analysis by country
- 4.5. Security Services
- 4.5.1. Key market trends, growth factors and opportunities
- 4.5.2. Market size and forecast, by region
- 4.5.3. Market share analysis by country
- 4.6. Storage Services
- 4.6.1. Key market trends, growth factors and opportunities
- 4.6.2. Market size and forecast, by region
- 4.6.3. Market share analysis by country
CHAPTER 5: BARE METAL CLOUD MARKET, BY ENTERPRISE SIZE
- 5.1. Overview
- 5.1.1. Market size and forecast
- 5.2. Large Enterprises
- 5.2.1. Key market trends, growth factors and opportunities
- 5.2.2. Market size and forecast, by region
- 5.2.3. Market share analysis by country
- 5.3. Small and Medium Enterprise (SMEs)
- 5.3.1. Key market trends, growth factors and opportunities
- 5.3.2. Market size and forecast, by region
- 5.3.3. Market share analysis by country
CHAPTER 6: BARE METAL CLOUD MARKET, BY INDUSTRY VERTICAL
- 6.1. Overview
- 6.1.1. Market size and forecast
- 6.2. BFSI
- 6.2.1. Key market trends, growth factors and opportunities
- 6.2.2. Market size and forecast, by region
- 6.2.3. Market share analysis by country
- 6.3. IT and Telecom
- 6.3.1. Key market trends, growth factors and opportunities
- 6.3.2. Market size and forecast, by region
- 6.3.3. Market share analysis by country
- 6.4. Retail and Consumer Goods
- 6.4.1. Key market trends, growth factors and opportunities
- 6.4.2. Market size and forecast, by region
- 6.4.3. Market share analysis by country
- 6.5. Healthcare and Life Sciences
- 6.5.1. Key market trends, growth factors and opportunities
- 6.5.2. Market size and forecast, by region
- 6.5.3. Market share analysis by country
- 6.6. Manufacturing
- 6.6.1. Key market trends, growth factors and opportunities
- 6.6.2. Market size and forecast, by region
- 6.6.3. Market share analysis by country
- 6.7. Government
- 6.7.1. Key market trends, growth factors and opportunities
- 6.7.2. Market size and forecast, by region
- 6.7.3. Market share analysis by country
- 6.8. Others
- 6.8.1. Key market trends, growth factors and opportunities
- 6.8.2. Market size and forecast, by region
- 6.8.3. Market share analysis by country
CHAPTER 7: BARE METAL CLOUD MARKET, BY REGION
- 7.1. Overview
- 7.1.1. Market size and forecast By Region
- 7.2. North America
- 7.2.1. Key trends and opportunities
- 7.2.2. Market size and forecast, by Service Type
- 7.2.3. Market size and forecast, by Enterprise Size
- 7.2.4. Market size and forecast, by Industry Vertical
- 7.2.5. Market size and forecast, by country
- 7.2.5.1. U.S.
- 7.2.5.1.1. Key market trends, growth factors and opportunities
- 7.2.5.1.2. Market size and forecast, by Service Type
- 7.2.5.1.3. Market size and forecast, by Enterprise Size
- 7.2.5.1.4. Market size and forecast, by Industry Vertical
- 7.2.5.2. Canada
- 7.2.5.2.1. Key market trends, growth factors and opportunities
- 7.2.5.2.2. Market size and forecast, by Service Type
- 7.2.5.2.3. Market size and forecast, by Enterprise Size
- 7.2.5.2.4. Market size and forecast, by Industry Vertical
- 7.3. Europe
- 7.3.1. Key trends and opportunities
- 7.3.2. Market size and forecast, by Service Type
- 7.3.3. Market size and forecast, by Enterprise Size
- 7.3.4. Market size and forecast, by Industry Vertical
- 7.3.5. Market size and forecast, by country
- 7.3.5.1. UK
- 7.3.5.1.1. Key market trends, growth factors and opportunities
- 7.3.5.1.2. Market size and forecast, by Service Type
- 7.3.5.1.3. Market size and forecast, by Enterprise Size
- 7.3.5.1.4. Market size and forecast, by Industry Vertical
- 7.3.5.2. Germany
- 7.3.5.2.1. Key market trends, growth factors and opportunities
- 7.3.5.2.2. Market size and forecast, by Service Type
- 7.3.5.2.3. Market size and forecast, by Enterprise Size
- 7.3.5.2.4. Market size and forecast, by Industry Vertical
- 7.3.5.3. France
- 7.3.5.3.1. Key market trends, growth factors and opportunities
- 7.3.5.3.2. Market size and forecast, by Service Type
- 7.3.5.3.3. Market size and forecast, by Enterprise Size
- 7.3.5.3.4. Market size and forecast, by Industry Vertical
- 7.3.5.4. Italy
- 7.3.5.4.1. Key market trends, growth factors and opportunities
- 7.3.5.4.2. Market size and forecast, by Service Type
- 7.3.5.4.3. Market size and forecast, by Enterprise Size
- 7.3.5.4.4. Market size and forecast, by Industry Vertical
- 7.3.5.5. Spain
- 7.3.5.5.1. Key market trends, growth factors and opportunities
- 7.3.5.5.2. Market size and forecast, by Service Type
- 7.3.5.5.3. Market size and forecast, by Enterprise Size
- 7.3.5.5.4. Market size and forecast, by Industry Vertical
- 7.3.5.6. Rest of Europe
- 7.3.5.6.1. Key market trends, growth factors and opportunities
- 7.3.5.6.2. Market size and forecast, by Service Type
- 7.3.5.6.3. Market size and forecast, by Enterprise Size
- 7.3.5.6.4. Market size and forecast, by Industry Vertical
- 7.4. Asia-Pacific
- 7.4.1. Key trends and opportunities
- 7.4.2. Market size and forecast, by Service Type
- 7.4.3. Market size and forecast, by Enterprise Size
- 7.4.4. Market size and forecast, by Industry Vertical
- 7.4.5. Market size and forecast, by country
- 7.4.5.1. China
- 7.4.5.1.1. Key market trends, growth factors and opportunities
- 7.4.5.1.2. Market size and forecast, by Service Type
- 7.4.5.1.3. Market size and forecast, by Enterprise Size
- 7.4.5.1.4. Market size and forecast, by Industry Vertical
- 7.4.5.2. India
- 7.4.5.2.1. Key market trends, growth factors and opportunities
- 7.4.5.2.2. Market size and forecast, by Service Type
- 7.4.5.2.3. Market size and forecast, by Enterprise Size
- 7.4.5.2.4. Market size and forecast, by Industry Vertical
- 7.4.5.3. Japan
- 7.4.5.3.1. Key market trends, growth factors and opportunities
- 7.4.5.3.2. Market size and forecast, by Service Type
- 7.4.5.3.3. Market size and forecast, by Enterprise Size
- 7.4.5.3.4. Market size and forecast, by Industry Vertical
- 7.4.5.4. Australia
- 7.4.5.4.1. Key market trends, growth factors and opportunities
- 7.4.5.4.2. Market size and forecast, by Service Type
- 7.4.5.4.3. Market size and forecast, by Enterprise Size
- 7.4.5.4.4. Market size and forecast, by Industry Vertical
- 7.4.5.5. South Korea
- 7.4.5.5.1. Key market trends, growth factors and opportunities
- 7.4.5.5.2. Market size and forecast, by Service Type
- 7.4.5.5.3. Market size and forecast, by Enterprise Size
- 7.4.5.5.4. Market size and forecast, by Industry Vertical
- 7.4.5.6. Rest of Asia-Pacific
- 7.4.5.6.1. Key market trends, growth factors and opportunities
- 7.4.5.6.2. Market size and forecast, by Service Type
- 7.4.5.6.3. Market size and forecast, by Enterprise Size
- 7.4.5.6.4. Market size and forecast, by Industry Vertical
- 7.5. LAMEA
- 7.5.1. Key trends and opportunities
- 7.5.2. Market size and forecast, by Service Type
- 7.5.3. Market size and forecast, by Enterprise Size
- 7.5.4. Market size and forecast, by Industry Vertical
- 7.5.5. Market size and forecast, by country
- 7.5.5.1. Latin America
- 7.5.5.1.1. Key market trends, growth factors and opportunities
- 7.5.5.1.2. Market size and forecast, by Service Type
- 7.5.5.1.3. Market size and forecast, by Enterprise Size
- 7.5.5.1.4. Market size and forecast, by Industry Vertical
- 7.5.5.2. Middle East
- 7.5.5.2.1. Key market trends, growth factors and opportunities
- 7.5.5.2.2. Market size and forecast, by Service Type
- 7.5.5.2.3. Market size and forecast, by Enterprise Size
- 7.5.5.2.4. Market size and forecast, by Industry Vertical
- 7.5.5.3. Africa
- 7.5.5.3.1. Key market trends, growth factors and opportunities
- 7.5.5.3.2. Market size and forecast, by Service Type
- 7.5.5.3.3. Market size and forecast, by Enterprise Size
- 7.5.5.3.4. Market size and forecast, by Industry Vertical
CHAPTER 8: COMPETITIVE LANDSCAPE
- 8.1. Introduction
- 8.2. Top winning strategies
- 8.3. Product Mapping of Top 10 Player
- 8.4. Competitive Dashboard
- 8.5. Competitive Heatmap
- 8.6. Top player positioning, 2021
CHAPTER 9: COMPANY PROFILES
- 9.1. International Business Machines Corporation
- 9.1.1. Company overview
- 9.1.2. Key Executives
- 9.1.3. Company snapshot
- 9.1.4. Operating business segments
- 9.1.5. Product portfolio
- 9.1.6. Business performance
- 9.1.7. Key strategic moves and developments
- 9.2. Oracle Corporation
- 9.2.1. Company overview
- 9.2.2. Key Executives
- 9.2.3. Company snapshot
- 9.2.4. Operating business segments
- 9.2.5. Product portfolio
- 9.2.6. Business performance
- 9.2.7. Key strategic moves and developments
- 9.3. LUMEN TECHNOLOGIES
- 9.3.1. Company overview
- 9.3.2. Key Executives
- 9.3.3. Company snapshot
- 9.3.4. Operating business segments
- 9.3.5. Product portfolio
- 9.3.6. Business performance
- 9.3.7. Key strategic moves and developments
- 9.4. Internap Holding LLC
- 9.4.1. Company overview
- 9.4.2. Key Executives
- 9.4.3. Company snapshot
- 9.4.4. Operating business segments
- 9.4.5. Product portfolio
- 9.4.6. Key strategic moves and developments
- 9.5. Amazon Web Services, Inc.
- 9.5.1. Company overview
- 9.5.2. Key Executives
- 9.5.3. Company snapshot
- 9.5.4. Operating business segments
- 9.5.5. Product portfolio
- 9.5.6. Business performance
- 9.5.7. Key strategic moves and developments
- 9.6. Dell Technologies Inc.
- 9.6.1. Company overview
- 9.6.2. Key Executives
- 9.6.3. Company snapshot
- 9.6.4. Operating business segments
- 9.6.5. Product portfolio
- 9.6.6. Business performance
- 9.6.7. Key strategic moves and developments
- 9.7. Google LLC
- 9.7.1. Company overview
- 9.7.2. Key Executives
- 9.7.3. Company snapshot
- 9.7.4. Operating business segments
- 9.7.5. Product portfolio
- 9.7.6. Business performance
- 9.7.7. Key strategic moves and developments
- 9.8. Microsoft Corporation
- 9.8.1. Company overview
- 9.8.2. Key Executives
- 9.8.3. Company snapshot
- 9.8.4. Operating business segments
- 9.8.5. Product portfolio
- 9.8.6. Business performance
- 9.8.7. Key strategic moves and developments
- 9.9. RACKSPACE TECHNOLOGY
- 9.9.1. Company overview
- 9.9.2. Key Executives
- 9.9.3. Company snapshot
- 9.9.4. Operating business segments
- 9.9.5. Product portfolio
- 9.9.6. Business performance
- 9.9.7. Key strategic moves and developments
- 9.10. Alibaba Cloud
- 9.10.1. Company overview
- 9.10.2. Key Executives
- 9.10.3. Company snapshot
- 9.10.4. Operating business segments
- 9.10.5. Product portfolio
- 9.10.6. Business performance
- 9.10.7. Key strategic moves and developments