 |
市場調査レポート
商品コード
1298210
注射ペン市場:タイプ別、治療法別、エンドユーザー別:世界の機会分析と産業予測、2021-2031年Injection Pen Market By Type, By Therapy, By End Users : Global Opportunity Analysis and Industry Forecast, 2021-2031 |
||||||

| 注射ペン市場:タイプ別、治療法別、エンドユーザー別:世界の機会分析と産業予測、2021-2031年 |
|
出版日: 2023年03月01日
発行: Allied Market Research
ページ情報: 英文 428 Pages
納期: 2~3営業日
|
- 全表示
- 概要
- 図表
- 目次
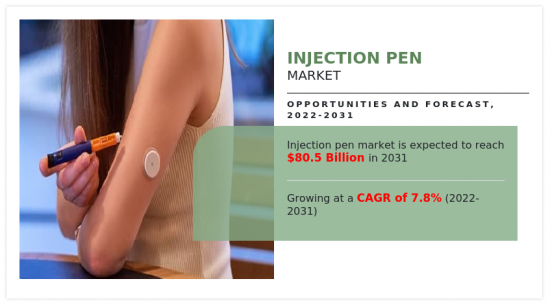
注射ペン市場は2021年に378億9,900万米ドルと評価され、2031年には805億1,151万米ドルに達すると推定され、2022年から2031年までのCAGRは7.8%を示します。
注射ペンは、注射を行うための医療機器です。注射針、注射器、そして投薬量を制御するプランジャーを備えたペンのような装置で構成されています。注射ペンは、注射を便利に投与できるように設計されています。インスリンやその他の薬剤の投与によく使用されます。使い捨てタイプと再利用可能なタイプが市場に出回っています。使い捨てペンは、あらかじめ薬剤が充填されており、薬剤カートリッジが空になったら捨てられます。一方、再利用可能なペンは、ペンに装填され、薬剤が使用されると捨てられる薬剤カートリッジで動作し、ペンは次のカートリッジの準備ができている状態になります。
注射ペン市場の成長を促進する主な要因は、糖尿病、骨粗しょう症、心血管疾患、多発性硬化症などの慢性疾患の有病率の上昇と老年人口の急増です。加えて、慢性疾患は世界の死因のトップであり、その有病率はライフスタイルの変化、高齢化、不健康な食生活により増加しています。例えば、米国疾病予防管理センター(CDC)によると、2021年現在、推定1億1,700万人の米国成人(47.4%)が少なくとも1つの慢性疾患を抱えています。最も罹患率の高い慢性疾患は、心臓病(4,580万人が罹患)、関節炎(4,340万人が罹患)、糖尿病(3,420万人が罹患)、高血圧(3,350万人が罹患)、がん(1,370万人が罹患)であり、その他にも喘息、脳卒中、腎臓病、アルツハイマー病など様々です。したがって、慢性疾患の有病率の急増は、市場の成長を後押しすると予想され、技術的に高度な注射ペンに焦点を増加しています。
しかし、北米のような一部の地域では、注射ペンのコストが高く、ドラッグデリバリーのための代替方法が利用可能であることが、市場の成長を抑制しています。逆に、慢性疾患の有病率の上昇と、糖尿病患者の増加による新興国からのインスリン用注射ペンの需要の増加は、注射ペンの新しい市場の可能性を開く可能性があり、予測期間中に市場の成長に有利な機会を提供すると予想されます。
北米は、2021年の注射ペン市場シェアの大半を占め、予測期間中も支配的であると予測されます。同市場は主に、高い可処分所得と強力な医療インフラによって牽引されています。また、同地域は製薬産業が発達しており、ヘルスケアに対する意識が高いため、幅広い治療用途に対応する注射ペンのような革新的な技術を開発・導入することができます。さらに、Sanofi、Eli Lilly、Novo Nordisk、Becton Dickinsonなど、幅広い注射ペンを提供する革新的な製品を考え出すために研究開発に多額の投資を行っている主な市場プレイヤーの増加は、この地域の市場成長を促進すると予想されます。
アジア太平洋は、予測期間中に最も速いCAGRを記録すると予想されています。これは、急速に増加する老人人口の存在、糖尿病などの慢性疾患の罹患率の上昇、所得の急増、医療製品に対する需要の増加、ヘルスケアインフラの改善によるものです。また、アジア太平洋地域は大手医薬品メーカーや医療機器メーカーの本拠地であるため、高品質の注射ペンの生産が増加し、市場の成長を牽引しています。
目次
第1章 イントロダクション
第2章 エグゼクティブサマリー
第3章 市場概要
- 市場の定義と範囲
- 主な調査結果
- 影響要因
- 主な投資ポケット
- ポーターのファイブフォース分析
- 供給企業の交渉力
- 買い手の交渉力
- 代替品の脅威
- 新規参入業者の脅威
- 競合の激しさ
- 市場力学
- 促進要因
- 慢性疾患の増加
- 自己注射薬に対する意識の高まり
- 技術進歩の高まり
- 抑制要因
- 代替ドラッグデリバリーモードの選好
- 針刺し損傷の増加
- 機会
- 新興経済諸国における高い成長の可能性。
- 促進要因
- COVID-19による市場への影響分析
第4章 注射ペン市場:タイプ別
- 概要
- 市場規模と予測
- 使い捨て注射ペン
- 主な市場動向、成長要因、機会
- 市場規模・予測:地域別
- 市場シェア分析:国別
- 再利用可能注射ペン
- 主な市場動向、成長要因、機会
- 市場規模・予測:地域別
- 市場シェア分析: 国別
第5章 注射ペン市場:治療別
- 概要
- 市場規模および予測
- 糖尿病
- 主な市場動向、成長要因、機会
- 市場規模・予測:地域別
- 市場シェア分析:国別
- 成長ホルモン
- 主要市場動向、成長要因、機会
- 市場規模・予測:地域別
- 市場シェア分析:国別
- 骨粗鬆症
- 主要市場動向、成長要因、機会
- 市場規模・予測:地域別
- 市場シェア分析:国別
- 不妊症
- 主な市場動向、成長要因、機会
- 市場規模・予測:地域別
- 市場シェア分析:国別
- その他
- 主な市場動向、成長要因、機会
- 市場規模・予測:地域別
- 市場シェア分析:国別
第6章 注射ペン市場:エンドユーザー別
- 概要
- 市場規模と予測
- ホームケア分野
- 主な市場動向、成長要因、機会
- 市場規模・予測:地域別
- 市場シェア分析:国別
- 病院と診療所
- 主な市場動向、成長要因、機会
- 市場規模・予測:地域別
- 市場シェア分析:国別
第7章 注射ペン市場:地域別
- 概要
- 市場規模・予測:地域別
- 北米
- 主な動向と機会
- 市場規模・予測:タイプ別
- 市場規模・予測:治療法別
- 市場規模・予測:エンドユーザー別
- 市場規模・予測:国別
- 米国
- 主要市場動向、成長要因、機会
- 市場規模・予測:タイプ別
- 市場規模・予測:治療法別
- 市場規模・予測:エンドユーザー別
- カナダ
- 主要市場動向、成長要因、機会
- 市場規模・予測:タイプ別
- 市場規模・予測:治療法別
- 市場規模・予測:エンドユーザー別
- メキシコ
- 主要市場動向、成長要因、機会
- 市場規模・予測:タイプ別
- 市場規模・予測:治療法別
- 市場規模・予測:エンドユーザー別
- 欧州
- 主要動向と機会
- 市場規模・予測:タイプ別
- 市場規模・予測:治療法別
- 市場規模・予測:エンドユーザー別
- 市場規模・予測:国別
- ドイツ
- 主要市場動向、成長要因、機会
- 市場規模・予測:タイプ別
- 市場規模・予測:治療法別
- 市場規模・予測:エンドユーザー別
- フランス
- 主要市場動向、成長要因、機会
- 市場規模・予測:タイプ別
- 市場規模・予測:治療法別
- 市場規模・予測:エンドユーザー別
- 英国
- 主要市場動向、成長要因、機会
- 市場規模・予測:タイプ別
- 市場規模・予測:治療法別
- 市場規模・予測:エンドユーザー別
- イタリア
- 主要市場動向、成長要因、機会
- 市場規模・予測:タイプ別
- 市場規模・予測:治療法別
- 市場規模・予測:エンドユーザー別
- スペイン
- 主要市場動向、成長要因、機会
- 市場規模・予測:タイプ別
- 市場規模・予測:治療法別
- 市場規模・予測:エンドユーザー別
- その他欧州
- 主要市場動向、成長要因、機会
- 市場規模・予測:タイプ別
- 市場規模・予測:治療法別
- 市場規模・予測:エンドユーザー別
- アジア太平洋地域
- 主要動向と機会
- 市場規模・予測:タイプ別
- 市場規模・予測:治療法別
- 市場規模・予測:エンドユーザー別
- 市場規模・予測:国別
- 日本
- 主要市場動向、成長要因、機会
- 市場規模・予測:タイプ別
- 市場規模・予測:治療法別
- 市場規模・予測:エンドユーザー別
- 中国
- 主要市場動向、成長要因、機会
- 市場規模・予測:タイプ別
- 市場規模・予測:治療法別
- 市場規模・予測:エンドユーザー別
- オーストラリア
- 主要市場動向、成長要因、機会
- 市場規模・予測:タイプ別
- 市場規模・予測:治療法別
- 市場規模・予測:エンドユーザー別
- インド
- 主要市場動向、成長要因、機会
- 市場規模・予測:タイプ別
- 市場規模・予測:治療法別
- 市場規模・予測:エンドユーザー別
- 韓国
- 主要市場動向、成長要因、機会
- 市場規模・予測:タイプ別
- 市場規模・予測:治療法別
- 市場規模・予測:エンドユーザー別
- その他アジア太平洋地域
- 主要市場動向、成長要因、機会
- 市場規模・予測:タイプ別
- 市場規模・予測:治療法別
- 市場規模・予測:エンドユーザー別
- ラテンアメリカ・中東・アフリカ
- 主要動向と機会
- 市場規模・予測:タイプ別
- 市場規模・予測:治療法別
- 市場規模・予測:エンドユーザー別
- 市場規模・予測:国別
- ブラジル
- 主要市場動向、成長要因、機会
- 市場規模・予測:タイプ別
- 市場規模・予測:治療法別
- 市場規模・予測:エンドユーザー別
- サウジアラビア
- 主要市場動向、成長要因、機会
- 市場規模・予測:タイプ別
- 市場規模・予測:治療法別
- 市場規模・予測:エンドユーザー別
- 南アフリカ
- 主要市場動向、成長要因、機会
- 市場規模・予測:タイプ別
- 市場規模・予測:治療法別
- 市場規模・予測:エンドユーザー別
- その他の地域
- 主要市場動向、成長要因、機会
- 市場規模・予測:タイプ別
- 市場規模・予測:治療法別
- 市場規模・予測:エンドユーザー別
第8章 競合情勢
- イントロダクション
- 主要成功戦略
- 主要10社の製品マッピング
- 競合ダッシュボード
- 競合ヒートマップ
- トップ企業のポジショニング(2021年
第9章 企業プロファイル
- Eli Lilly and Company
- AstraZeneca
- Ypsomed AG
- Becton, Dickinson and Company
- Merck Group
- Pfizer Inc.
- Novartis AG
- Sanofi
- Novo Nordisk A/S
- Biocon
LIST OF TABLES
- TABLE 01. GLOBAL INJECTION PEN MARKET, BY TYPE, 2021-2031 ($MILLION)
- TABLE 02. INJECTION PEN MARKET FOR DISPOSABLE INJECTION PEN, BY REGION, 2021-2031 ($MILLION)
- TABLE 03. INJECTION PEN MARKET FOR REUSABLE INJECTION PEN, BY REGION, 2021-2031 ($MILLION)
- TABLE 04. GLOBAL INJECTION PEN MARKET, BY THERAPY, 2021-2031 ($MILLION)
- TABLE 05. INJECTION PEN MARKET FOR DIABETES, BY REGION, 2021-2031 ($MILLION)
- TABLE 06. INJECTION PEN MARKET FOR GROWTH HORMONE, BY REGION, 2021-2031 ($MILLION)
- TABLE 07. INJECTION PEN MARKET FOR OSTEOPOROSIS, BY REGION, 2021-2031 ($MILLION)
- TABLE 08. INJECTION PEN MARKET FOR FERTILITY, BY REGION, 2021-2031 ($MILLION)
- TABLE 09. INJECTION PEN MARKET FOR OTHERS, BY REGION, 2021-2031 ($MILLION)
- TABLE 10. GLOBAL INJECTION PEN MARKET, BY END USERS, 2021-2031 ($MILLION)
- TABLE 11. INJECTION PEN MARKET FOR HOME-CARE SETTINGS, BY REGION, 2021-2031 ($MILLION)
- TABLE 12. INJECTION PEN MARKET FOR HOSPITAL AND CLINICS, BY REGION, 2021-2031 ($MILLION)
- TABLE 13. INJECTION PEN MARKET, BY REGION, 2021-2031 ($MILLION)
- TABLE 14. NORTH AMERICA INJECTION PEN MARKET, BY TYPE, 2021-2031 ($MILLION)
- TABLE 15. NORTH AMERICA INJECTION PEN MARKET, BY THERAPY, 2021-2031 ($MILLION)
- TABLE 16. NORTH AMERICA INJECTION PEN MARKET, BY END USERS, 2021-2031 ($MILLION)
- TABLE 17. NORTH AMERICA INJECTION PEN MARKET, BY COUNTRY, 2021-2031 ($MILLION)
- TABLE 18. U.S. INJECTION PEN MARKET, BY TYPE, 2021-2031 ($MILLION)
- TABLE 19. U.S. INJECTION PEN MARKET, BY THERAPY, 2021-2031 ($MILLION)
- TABLE 20. U.S. INJECTION PEN MARKET, BY END USERS, 2021-2031 ($MILLION)
- TABLE 21. CANADA INJECTION PEN MARKET, BY TYPE, 2021-2031 ($MILLION)
- TABLE 22. CANADA INJECTION PEN MARKET, BY THERAPY, 2021-2031 ($MILLION)
- TABLE 23. CANADA INJECTION PEN MARKET, BY END USERS, 2021-2031 ($MILLION)
- TABLE 24. MEXICO INJECTION PEN MARKET, BY TYPE, 2021-2031 ($MILLION)
- TABLE 25. MEXICO INJECTION PEN MARKET, BY THERAPY, 2021-2031 ($MILLION)
- TABLE 26. MEXICO INJECTION PEN MARKET, BY END USERS, 2021-2031 ($MILLION)
- TABLE 27. EUROPE INJECTION PEN MARKET, BY TYPE, 2021-2031 ($MILLION)
- TABLE 28. EUROPE INJECTION PEN MARKET, BY THERAPY, 2021-2031 ($MILLION)
- TABLE 29. EUROPE INJECTION PEN MARKET, BY END USERS, 2021-2031 ($MILLION)
- TABLE 30. EUROPE INJECTION PEN MARKET, BY COUNTRY, 2021-2031 ($MILLION)
- TABLE 31. GERMANY INJECTION PEN MARKET, BY TYPE, 2021-2031 ($MILLION)
- TABLE 32. GERMANY INJECTION PEN MARKET, BY THERAPY, 2021-2031 ($MILLION)
- TABLE 33. GERMANY INJECTION PEN MARKET, BY END USERS, 2021-2031 ($MILLION)
- TABLE 34. FRANCE INJECTION PEN MARKET, BY TYPE, 2021-2031 ($MILLION)
- TABLE 35. FRANCE INJECTION PEN MARKET, BY THERAPY, 2021-2031 ($MILLION)
- TABLE 36. FRANCE INJECTION PEN MARKET, BY END USERS, 2021-2031 ($MILLION)
- TABLE 37. UK INJECTION PEN MARKET, BY TYPE, 2021-2031 ($MILLION)
- TABLE 38. UK INJECTION PEN MARKET, BY THERAPY, 2021-2031 ($MILLION)
- TABLE 39. UK INJECTION PEN MARKET, BY END USERS, 2021-2031 ($MILLION)
- TABLE 40. ITALY INJECTION PEN MARKET, BY TYPE, 2021-2031 ($MILLION)
- TABLE 41. ITALY INJECTION PEN MARKET, BY THERAPY, 2021-2031 ($MILLION)
- TABLE 42. ITALY INJECTION PEN MARKET, BY END USERS, 2021-2031 ($MILLION)
- TABLE 43. SPAIN INJECTION PEN MARKET, BY TYPE, 2021-2031 ($MILLION)
- TABLE 44. SPAIN INJECTION PEN MARKET, BY THERAPY, 2021-2031 ($MILLION)
- TABLE 45. SPAIN INJECTION PEN MARKET, BY END USERS, 2021-2031 ($MILLION)
- TABLE 46. REST OF EUROPE INJECTION PEN MARKET, BY TYPE, 2021-2031 ($MILLION)
- TABLE 47. REST OF EUROPE INJECTION PEN MARKET, BY THERAPY, 2021-2031 ($MILLION)
- TABLE 48. REST OF EUROPE INJECTION PEN MARKET, BY END USERS, 2021-2031 ($MILLION)
- TABLE 49. ASIA-PACIFIC INJECTION PEN MARKET, BY TYPE, 2021-2031 ($MILLION)
- TABLE 50. ASIA-PACIFIC INJECTION PEN MARKET, BY THERAPY, 2021-2031 ($MILLION)
- TABLE 51. ASIA-PACIFIC INJECTION PEN MARKET, BY END USERS, 2021-2031 ($MILLION)
- TABLE 52. ASIA-PACIFIC INJECTION PEN MARKET, BY COUNTRY, 2021-2031 ($MILLION)
- TABLE 53. JAPAN INJECTION PEN MARKET, BY TYPE, 2021-2031 ($MILLION)
- TABLE 54. JAPAN INJECTION PEN MARKET, BY THERAPY, 2021-2031 ($MILLION)
- TABLE 55. JAPAN INJECTION PEN MARKET, BY END USERS, 2021-2031 ($MILLION)
- TABLE 56. CHINA INJECTION PEN MARKET, BY TYPE, 2021-2031 ($MILLION)
- TABLE 57. CHINA INJECTION PEN MARKET, BY THERAPY, 2021-2031 ($MILLION)
- TABLE 58. CHINA INJECTION PEN MARKET, BY END USERS, 2021-2031 ($MILLION)
- TABLE 59. AUSTRALIA INJECTION PEN MARKET, BY TYPE, 2021-2031 ($MILLION)
- TABLE 60. AUSTRALIA INJECTION PEN MARKET, BY THERAPY, 2021-2031 ($MILLION)
- TABLE 61. AUSTRALIA INJECTION PEN MARKET, BY END USERS, 2021-2031 ($MILLION)
- TABLE 62. INDIA INJECTION PEN MARKET, BY TYPE, 2021-2031 ($MILLION)
- TABLE 63. INDIA INJECTION PEN MARKET, BY THERAPY, 2021-2031 ($MILLION)
- TABLE 64. INDIA INJECTION PEN MARKET, BY END USERS, 2021-2031 ($MILLION)
- TABLE 65. SOUTH KOREA INJECTION PEN MARKET, BY TYPE, 2021-2031 ($MILLION)
- TABLE 66. SOUTH KOREA INJECTION PEN MARKET, BY THERAPY, 2021-2031 ($MILLION)
- TABLE 67. SOUTH KOREA INJECTION PEN MARKET, BY END USERS, 2021-2031 ($MILLION)
- TABLE 68. REST OF ASIA-PACIFIC INJECTION PEN MARKET, BY TYPE, 2021-2031 ($MILLION)
- TABLE 69. REST OF ASIA-PACIFIC INJECTION PEN MARKET, BY THERAPY, 2021-2031 ($MILLION)
- TABLE 70. REST OF ASIA-PACIFIC INJECTION PEN MARKET, BY END USERS, 2021-2031 ($MILLION)
- TABLE 71. LAMEA INJECTION PEN MARKET, BY TYPE, 2021-2031 ($MILLION)
- TABLE 72. LAMEA INJECTION PEN MARKET, BY THERAPY, 2021-2031 ($MILLION)
- TABLE 73. LAMEA INJECTION PEN MARKET, BY END USERS, 2021-2031 ($MILLION)
- TABLE 74. LAMEA INJECTION PEN MARKET, BY COUNTRY, 2021-2031 ($MILLION)
- TABLE 75. BRAZIL INJECTION PEN MARKET, BY TYPE, 2021-2031 ($MILLION)
- TABLE 76. BRAZIL INJECTION PEN MARKET, BY THERAPY, 2021-2031 ($MILLION)
- TABLE 77. BRAZIL INJECTION PEN MARKET, BY END USERS, 2021-2031 ($MILLION)
- TABLE 78. SAUDI ARABIA INJECTION PEN MARKET, BY TYPE, 2021-2031 ($MILLION)
- TABLE 79. SAUDI ARABIA INJECTION PEN MARKET, BY THERAPY, 2021-2031 ($MILLION)
- TABLE 80. SAUDI ARABIA INJECTION PEN MARKET, BY END USERS, 2021-2031 ($MILLION)
- TABLE 81. SOUTH AFRICA INJECTION PEN MARKET, BY TYPE, 2021-2031 ($MILLION)
- TABLE 82. SOUTH AFRICA INJECTION PEN MARKET, BY THERAPY, 2021-2031 ($MILLION)
- TABLE 83. SOUTH AFRICA INJECTION PEN MARKET, BY END USERS, 2021-2031 ($MILLION)
- TABLE 84. REST OF LAMEA INJECTION PEN MARKET, BY TYPE, 2021-2031 ($MILLION)
- TABLE 85. REST OF LAMEA INJECTION PEN MARKET, BY THERAPY, 2021-2031 ($MILLION)
- TABLE 86. REST OF LAMEA INJECTION PEN MARKET, BY END USERS, 2021-2031 ($MILLION)
- TABLE 87. ELI LILLY AND COMPANY: KEY EXECUTIVES
- TABLE 88. ELI LILLY AND COMPANY: COMPANY SNAPSHOT
- TABLE 89. ELI LILLY AND COMPANY: PRODUCT SEGMENTS
- TABLE 90. ELI LILLY AND COMPANY: PRODUCT PORTFOLIO
- TABLE 91. ASTRAZENECA: KEY EXECUTIVES
- TABLE 92. ASTRAZENECA: COMPANY SNAPSHOT
- TABLE 93. ASTRAZENECA: PRODUCT SEGMENTS
- TABLE 94. ASTRAZENECA: PRODUCT PORTFOLIO
- TABLE 95. ASTRAZENECA: KEY STRATERGIES
- TABLE 96. YPSOMED AG: KEY EXECUTIVES
- TABLE 97. YPSOMED AG: COMPANY SNAPSHOT
- TABLE 98. YPSOMED AG: PRODUCT SEGMENTS
- TABLE 99. YPSOMED AG: PRODUCT PORTFOLIO
- TABLE 100. YPSOMED AG: KEY STRATERGIES
- TABLE 101. BECTON, DICKINSON AND COMPANY: KEY EXECUTIVES
- TABLE 102. BECTON, DICKINSON AND COMPANY: COMPANY SNAPSHOT
- TABLE 103. BECTON, DICKINSON AND COMPANY: PRODUCT SEGMENTS
- TABLE 104. BECTON, DICKINSON AND COMPANY: PRODUCT PORTFOLIO
- TABLE 105. MERCK GROUP: KEY EXECUTIVES
- TABLE 106. MERCK GROUP: COMPANY SNAPSHOT
- TABLE 107. MERCK GROUP: PRODUCT SEGMENTS
- TABLE 108. MERCK GROUP: PRODUCT PORTFOLIO
- TABLE 109. PFIZER INC.: KEY EXECUTIVES
- TABLE 110. PFIZER INC.: COMPANY SNAPSHOT
- TABLE 111. PFIZER INC.: PRODUCT SEGMENTS
- TABLE 112. PFIZER INC.: PRODUCT PORTFOLIO
- TABLE 113. NOVARTIS AG: KEY EXECUTIVES
- TABLE 114. NOVARTIS AG: COMPANY SNAPSHOT
- TABLE 115. NOVARTIS AG: PRODUCT SEGMENTS
- TABLE 116. NOVARTIS AG: PRODUCT PORTFOLIO
- TABLE 117. SANOFI: KEY EXECUTIVES
- TABLE 118. SANOFI: COMPANY SNAPSHOT
- TABLE 119. SANOFI: PRODUCT SEGMENTS
- TABLE 120. SANOFI: PRODUCT PORTFOLIO
- TABLE 121. NOVO NORDISK A/S: KEY EXECUTIVES
- TABLE 122. NOVO NORDISK A/S: COMPANY SNAPSHOT
- TABLE 123. NOVO NORDISK A/S: PRODUCT SEGMENTS
- TABLE 124. NOVO NORDISK A/S: PRODUCT PORTFOLIO
- TABLE 125. BIOCON: KEY EXECUTIVES
- TABLE 126. BIOCON: COMPANY SNAPSHOT
- TABLE 127. BIOCON: PRODUCT SEGMENTS
- TABLE 128. BIOCON: PRODUCT PORTFOLIO
LIST OF FIGURES
- FIGURE 01. INJECTION PEN MARKET, 2021-2031
- FIGURE 02. SEGMENTATION OF INJECTION PEN MARKET, 2021-2031
- FIGURE 03. TOP INVESTMENT POCKETS IN INJECTION PEN MARKET (2022-2031)
- FIGURE 04. LOW BARGAINING POWER OF SUPPLIERS
- FIGURE 05. LOW BARGAINING POWER OF BUYERS
- FIGURE 06. LOW THREAT OF SUBSTITUTES
- FIGURE 07. LOW THREAT OF NEW ENTRANTS
- FIGURE 08. LOW INTENSITY OF RIVALRY
- FIGURE 09. DRIVERS, RESTRAINTS AND OPPORTUNITIES: GLOBALINJECTION PEN MARKET
- FIGURE 10. INJECTION PEN MARKET, BY TYPE, 2021(%)
- FIGURE 11. COMPARATIVE SHARE ANALYSIS OF INJECTION PEN MARKET FOR DISPOSABLE INJECTION PEN, BY COUNTRY 2021 AND 2031(%)
- FIGURE 12. COMPARATIVE SHARE ANALYSIS OF INJECTION PEN MARKET FOR REUSABLE INJECTION PEN, BY COUNTRY 2021 AND 2031(%)
- FIGURE 13. INJECTION PEN MARKET, BY THERAPY, 2021(%)
- FIGURE 14. COMPARATIVE SHARE ANALYSIS OF INJECTION PEN MARKET FOR DIABETES, BY COUNTRY 2021 AND 2031(%)
- FIGURE 15. COMPARATIVE SHARE ANALYSIS OF INJECTION PEN MARKET FOR GROWTH HORMONE, BY COUNTRY 2021 AND 2031(%)
- FIGURE 16. COMPARATIVE SHARE ANALYSIS OF INJECTION PEN MARKET FOR OSTEOPOROSIS, BY COUNTRY 2021 AND 2031(%)
- FIGURE 17. COMPARATIVE SHARE ANALYSIS OF INJECTION PEN MARKET FOR FERTILITY, BY COUNTRY 2021 AND 2031(%)
- FIGURE 18. COMPARATIVE SHARE ANALYSIS OF INJECTION PEN MARKET FOR OTHERS, BY COUNTRY 2021 AND 2031(%)
- FIGURE 19. INJECTION PEN MARKET, BY END USERS, 2021(%)
- FIGURE 20. COMPARATIVE SHARE ANALYSIS OF INJECTION PEN MARKET FOR HOME-CARE SETTINGS, BY COUNTRY 2021 AND 2031(%)
- FIGURE 21. COMPARATIVE SHARE ANALYSIS OF INJECTION PEN MARKET FOR HOSPITAL AND CLINICS, BY COUNTRY 2021 AND 2031(%)
- FIGURE 22. INJECTION PEN MARKET BY REGION, 2021
- FIGURE 23. U.S. INJECTION PEN MARKET, 2021-2031 ($MILLION)
- FIGURE 24. CANADA INJECTION PEN MARKET, 2021-2031 ($MILLION)
- FIGURE 25. MEXICO INJECTION PEN MARKET, 2021-2031 ($MILLION)
- FIGURE 26. GERMANY INJECTION PEN MARKET, 2021-2031 ($MILLION)
- FIGURE 27. FRANCE INJECTION PEN MARKET, 2021-2031 ($MILLION)
- FIGURE 28. UK INJECTION PEN MARKET, 2021-2031 ($MILLION)
- FIGURE 29. ITALY INJECTION PEN MARKET, 2021-2031 ($MILLION)
- FIGURE 30. SPAIN INJECTION PEN MARKET, 2021-2031 ($MILLION)
- FIGURE 31. REST OF EUROPE INJECTION PEN MARKET, 2021-2031 ($MILLION)
- FIGURE 32. JAPAN INJECTION PEN MARKET, 2021-2031 ($MILLION)
- FIGURE 33. CHINA INJECTION PEN MARKET, 2021-2031 ($MILLION)
- FIGURE 34. AUSTRALIA INJECTION PEN MARKET, 2021-2031 ($MILLION)
- FIGURE 35. INDIA INJECTION PEN MARKET, 2021-2031 ($MILLION)
- FIGURE 36. SOUTH KOREA INJECTION PEN MARKET, 2021-2031 ($MILLION)
- FIGURE 37. REST OF ASIA-PACIFIC INJECTION PEN MARKET, 2021-2031 ($MILLION)
- FIGURE 38. BRAZIL INJECTION PEN MARKET, 2021-2031 ($MILLION)
- FIGURE 39. SAUDI ARABIA INJECTION PEN MARKET, 2021-2031 ($MILLION)
- FIGURE 40. SOUTH AFRICA INJECTION PEN MARKET, 2021-2031 ($MILLION)
- FIGURE 41. REST OF LAMEA INJECTION PEN MARKET, 2021-2031 ($MILLION)
- FIGURE 42. TOP WINNING STRATEGIES, BY YEAR
- FIGURE 43. TOP WINNING STRATEGIES, BY DEVELOPMENT
- FIGURE 44. TOP WINNING STRATEGIES, BY COMPANY
- FIGURE 45. PRODUCT MAPPING OF TOP 10 PLAYERS
- FIGURE 46. COMPETITIVE DASHBOARD
- FIGURE 47. COMPETITIVE HEATMAP: INJECTION PEN MARKET
- FIGURE 48. TOP PLAYER POSITIONING, 2021
- FIGURE 49. ELI LILLY AND COMPANY: NET REVENUE, 2019-2021 ($MILLION)
- FIGURE 50. ELI LILLY AND COMPANY: REVENUE SHARE BY REGION, 2021 (%)
- FIGURE 51. ASTRAZENECA PLC: NET SALES, 2020-2022 ($MILLION)
- FIGURE 52. ASTRAZENECA PLC: REVENUE SHARE BY REGION, 2022 (%)
- FIGURE 53. YPSOMED AG: NET SALES, 2020-2022 ($MILLION)
- FIGURE 54. YPSOMED AG: REVENUE SHARE BY SEGMENT, 2022 (%)
- FIGURE 55. YPSOMED AG: REVENUE SHARE BY REGION, 2021 (%)
- FIGURE 56. BECTON, DICKINSON AND COMPANY: NET REVENUE, 2020-2022 ($MILLION)
- FIGURE 57. BECTON, DICKINSON AND COMPANY: REVENUE SHARE BY SEGMENT, 2022 (%)
- FIGURE 58. BECTON, DICKINSON AND COMPANY: REVENUE SHARE BY REGION, 2022 (%)
- FIGURE 59. MERCK GROUP: NET SALES, 2020-2022 ($MILLION)
- FIGURE 60. MERCK GROUP: REVENUE SHARE BY SEGMENT, 2022 (%)
- FIGURE 61. MERCK GROUP: REVENUE SHARE BY REGION, 2022 (%)
- FIGURE 62. PFIZER INC.: NET REVENUE, 2020-2022 ($MILLION)
- FIGURE 63. PFIZER INC.: REVENUE SHARE BY REGION, 2022 (%)
- FIGURE 64. PFIZER INC.: REVENUE SHARE BY SEGMENT, 2021 (%)
- FIGURE 65. NOVARTIS AG: NET SALES, 2020-2022 ($MILLION)
- FIGURE 66. NOVARTIS AG: REVENUE SHARE BY SEGMENT, 2022 (%)
- FIGURE 67. NOVARTIS AG: REVENUE SHARE BY REGION, 2022 (%)
- FIGURE 68. SANOFI: NET SALES, 2020-2022 ($MILLION)
- FIGURE 69. SANOFI: REVENUE SHARE BY SEGMENT, 2022 (%)
- FIGURE 70. SANOFI: REVENUE SHARE BY REGION, 2022 (%)
- FIGURE 71. NOVO NORDISK A/S: NET SALES, 2020-2022 ($MILLION)
- FIGURE 72. NOVO NORDISK A/S: REVENUE SHARE BY SEGMENT, 2022 (%)
- FIGURE 73. NOVO NORDISK A/S: REVENUE SHARE BY REGION, 2022 (%)
- FIGURE 74. BIOCON: NET REVENUE, 2019-2021 ($MILLION)
- FIGURE 75. BIOCON: REVENUE SHARE BY SEGMENT, 2021 (%)
The injection pen market valued for $37,899.00 million in 2021 and is estimated to reach $80,511.51 million by 2031, exhibiting a CAGR of 7.8% from 2022 to 2031. An injection pen is a medical device used to administer injections. It consists of a needle, a syringe and a pen-like device with a plunger that controls the amount of medication administered. The injection pen is designed to administer injections conveniently. It is commonly used to administer insulin and other medications. It is available in disposable and reusable type in the market. Disposable pens are preloaded with drug and are thrown away after the drug cartridge is empty. Whereas, reusable pens work with drug cartridges that can be loaded into the pen and then thrown away once the drug is used, leaving the pen ready for the next cartridge.
The key factor that drives the growth of the injection pen market is the rise in the prevalence of chronic disease such as diabetes, osteoporosis, cardiovascular diseases, and multiple sclerosis, and surge in geriatric population. In addition, chronic diseases are the leading cause of death worldwide, and their prevalence is increasing due to lifestyle changes, aging population, and unhealthy diets. For instance, according to the Centers for Disease Control and Prevention (CDC), an estimated 117 million U.S. adults (47.4%) have at least one chronic health condition as of 2021. The most prevalent chronic diseases are, heart disease (affecting 45.8 million people), arthritis (affecting 43.4 million people), diabetes (affecting 34.2 million people), high blood pressure (affecting 33.5 million people), cancer (affecting 13.7 million people), and various others such as asthma, stroke kidney disease and Alzheimer's disease. Thus, surge in prevalence of chronic diseases, has increased the focus on the technologically advanced injection pen that is anticipated to boost the growth of the market.
However, high cost of injection pen in some regions such as North America and availability of alternative methods for drug delivery restrain the growth of the market. Conversely, rise in prevalence of chronic diseases and increase in demand for injection pen for insulin from emerging economies owing to rise in diabetic cases may open up new market potential for injection pen and is expected to provide a lucrative opportunity for the growth of the market during the forecast period.
North America accounted for a majority of the injection pen market share in 2021 and is anticipated to remain dominant during the forecast period. The injection pen market is mainly driven by high disposable income, and strong medical infrastructure. In addition, the region has a well-established pharmaceutical industry and a high level of healthcare awareness, which has enabled it to develop and implement innovative technologies, such as injection pens, for a wide range of therapeutic applications. Furthermore, the increase in number of key market players such as Sanofi, Eli Lilly, Novo Nordisk, and Becton Dickinson, which have invested heavily in research and development to come up with innovative products to provide a wide range of injection pen is expected to fuel the market growth in this region.
Asia-Pacific is expected to register the fastest CAGR during the forecast period. This is due to the presence of a rapidly growing geriatric population, rise in incidences of chronic diseases such as diabetes, surge in income, increase in demand for medical products, and improvement in the healthcare infrastructure. In addition, Asia-Pacific is a home to major drug and medical device manufacturers, leading to increased production of high-quality injection pens that drives the growth of the market.
The injection pen market is segmented on the basis of type, therapy, end user, and region. By type, the market is divided into disposable injection pen and reusable injection pen. By therapy the market is bifurcated into diabetes, growth hormone, osteoporosis, fertility, and others. By end user, it is categorized into home-care settings and hospital & clinics. Region-wise, it is analyzed across North America, Europe, Asia-Pacific, and LAMEA.
The key players that operate in the injection pen market are: Eli Lily and Company, Novo Nordisk A/S, Sanofi, Biocon, AstraZeneca, Pfizer Inc, Becton, Dickinson and Company, Ypsomed AG, Novartis AG and Merck KGaA.
Key Benefits For Stakeholders
- This report provides a quantitative analysis of the market segments, current trends, estimations, and dynamics of the injection pen market analysis from 2021 to 2031 to identify the prevailing injection pen market opportunities.
- The market research is offered along with information related to key drivers, restraints, and opportunities.
- Porter's five forces analysis highlights the potency of buyers and suppliers to enable stakeholders make profit-oriented business decisions and strengthen their supplier-buyer network.
- In-depth analysis of the injection pen market segmentation assists to determine the prevailing market opportunities.
- Major countries in each region are mapped according to their revenue contribution to the global market.
- Market player positioning facilitates benchmarking and provides a clear understanding of the present position of the market players.
- The report includes the analysis of the regional as well as global injection pen market trends, key players, market segments, application areas, and market growth strategies.
Key Market Segments
By Therapy
- Growth Hormone
- Osteoporosis
- Fertility
- Others
- Diabetes
By End Users
- Home-care Settings
- Hospital and clinics
By Type
- Disposable injection pen
- Reusable injection pen
By Region
- North America
- U.S.
- Canada
- Mexico
- Europe
- Germany
- France
- UK
- Italy
- Spain
- Rest of Europe
- Asia-Pacific
- Japan
- China
- Australia
- India
- South Korea
- Rest of Asia-Pacific
- LAMEA
- Brazil
- Saudi Arabia
- South Africa
- Rest of LAMEA
Key Market Players:
- AstraZeneca
- Ypsomed AG
- Becton, Dickinson and Company
- Pfizer Inc.
- Novartis AG
- Sanofi
- Eli Lilly and Company
- Merck Group
- Novo Nordisk A/S
- Biocon
TABLE OF CONTENTS
CHAPTER 1: INTRODUCTION
- 1.1. Report description
- 1.2. Key market segments
- 1.3. Key benefits to the stakeholders
- 1.4. Research Methodology
- 1.4.1. Primary research
- 1.4.2. Secondary research
- 1.4.3. Analyst tools and models
CHAPTER 2: EXECUTIVE SUMMARY
- 2.1. CXO Perspective
CHAPTER 3: MARKET OVERVIEW
- 3.1. Market definition and scope
- 3.2. Key findings
- 3.2.1. Top impacting factors
- 3.2.2. Top investment pockets
- 3.3. Porter's five forces analysis
- 3.3.1. Bargaining power of suppliers
- 3.3.2. Bargaining power of buyers
- 3.3.3. Threat of substitutes
- 3.3.4. Threat of new entrants
- 3.3.5. Intensity of rivalry
- 3.4. Market dynamics
- 3.4.1. Drivers
- 3.4.1.1. Increase in prevalence of chronic disease.
- 3.4.1.2. Surge in awareness for self-injectables
- 3.4.1.3. Rise in technological advancement
- 3.4.1. Drivers
- 3.4.2. Restraints
- 3.4.2.1. Preference for alternative drug delivery modes
- 3.4.2.2. Increase in the number of needlestick injury
- 3.4.3. Opportunities
- 3.4.3.1. High growth potential in developing economies.
- 3.5. COVID-19 Impact Analysis on the market
CHAPTER 4: INJECTION PEN MARKET, BY TYPE
- 4.1. Overview
- 4.1.1. Market size and forecast
- 4.2. Disposable injection pen
- 4.2.1. Key market trends, growth factors and opportunities
- 4.2.2. Market size and forecast, by region
- 4.2.3. Market share analysis by country
- 4.3. Reusable injection pen
- 4.3.1. Key market trends, growth factors and opportunities
- 4.3.2. Market size and forecast, by region
- 4.3.3. Market share analysis by country
CHAPTER 5: INJECTION PEN MARKET, BY THERAPY
- 5.1. Overview
- 5.1.1. Market size and forecast
- 5.2. Diabetes
- 5.2.1. Key market trends, growth factors and opportunities
- 5.2.2. Market size and forecast, by region
- 5.2.3. Market share analysis by country
- 5.3. Growth Hormone
- 5.3.1. Key market trends, growth factors and opportunities
- 5.3.2. Market size and forecast, by region
- 5.3.3. Market share analysis by country
- 5.4. Osteoporosis
- 5.4.1. Key market trends, growth factors and opportunities
- 5.4.2. Market size and forecast, by region
- 5.4.3. Market share analysis by country
- 5.5. Fertility
- 5.5.1. Key market trends, growth factors and opportunities
- 5.5.2. Market size and forecast, by region
- 5.5.3. Market share analysis by country
- 5.6. Others
- 5.6.1. Key market trends, growth factors and opportunities
- 5.6.2. Market size and forecast, by region
- 5.6.3. Market share analysis by country
CHAPTER 6: INJECTION PEN MARKET, BY END USERS
- 6.1. Overview
- 6.1.1. Market size and forecast
- 6.2. Home-care Settings
- 6.2.1. Key market trends, growth factors and opportunities
- 6.2.2. Market size and forecast, by region
- 6.2.3. Market share analysis by country
- 6.3. Hospital and clinics
- 6.3.1. Key market trends, growth factors and opportunities
- 6.3.2. Market size and forecast, by region
- 6.3.3. Market share analysis by country
CHAPTER 7: INJECTION PEN MARKET, BY REGION
- 7.1. Overview
- 7.1.1. Market size and forecast By Region
- 7.2. North America
- 7.2.1. Key trends and opportunities
- 7.2.2. Market size and forecast, by Type
- 7.2.3. Market size and forecast, by Therapy
- 7.2.4. Market size and forecast, by End Users
- 7.2.5. Market size and forecast, by country
- 7.2.5.1. U.S.
- 7.2.5.1.1. Key market trends, growth factors and opportunities
- 7.2.5.1.2. Market size and forecast, by Type
- 7.2.5.1.3. Market size and forecast, by Therapy
- 7.2.5.1.4. Market size and forecast, by End Users
- 7.2.5.2. Canada
- 7.2.5.2.1. Key market trends, growth factors and opportunities
- 7.2.5.2.2. Market size and forecast, by Type
- 7.2.5.2.3. Market size and forecast, by Therapy
- 7.2.5.2.4. Market size and forecast, by End Users
- 7.2.5.3. Mexico
- 7.2.5.3.1. Key market trends, growth factors and opportunities
- 7.2.5.3.2. Market size and forecast, by Type
- 7.2.5.3.3. Market size and forecast, by Therapy
- 7.2.5.3.4. Market size and forecast, by End Users
- 7.3. Europe
- 7.3.1. Key trends and opportunities
- 7.3.2. Market size and forecast, by Type
- 7.3.3. Market size and forecast, by Therapy
- 7.3.4. Market size and forecast, by End Users
- 7.3.5. Market size and forecast, by country
- 7.3.5.1. Germany
- 7.3.5.1.1. Key market trends, growth factors and opportunities
- 7.3.5.1.2. Market size and forecast, by Type
- 7.3.5.1.3. Market size and forecast, by Therapy
- 7.3.5.1.4. Market size and forecast, by End Users
- 7.3.5.2. France
- 7.3.5.2.1. Key market trends, growth factors and opportunities
- 7.3.5.2.2. Market size and forecast, by Type
- 7.3.5.2.3. Market size and forecast, by Therapy
- 7.3.5.2.4. Market size and forecast, by End Users
- 7.3.5.3. UK
- 7.3.5.3.1. Key market trends, growth factors and opportunities
- 7.3.5.3.2. Market size and forecast, by Type
- 7.3.5.3.3. Market size and forecast, by Therapy
- 7.3.5.3.4. Market size and forecast, by End Users
- 7.3.5.4. Italy
- 7.3.5.4.1. Key market trends, growth factors and opportunities
- 7.3.5.4.2. Market size and forecast, by Type
- 7.3.5.4.3. Market size and forecast, by Therapy
- 7.3.5.4.4. Market size and forecast, by End Users
- 7.3.5.5. Spain
- 7.3.5.5.1. Key market trends, growth factors and opportunities
- 7.3.5.5.2. Market size and forecast, by Type
- 7.3.5.5.3. Market size and forecast, by Therapy
- 7.3.5.5.4. Market size and forecast, by End Users
- 7.3.5.6. Rest of Europe
- 7.3.5.6.1. Key market trends, growth factors and opportunities
- 7.3.5.6.2. Market size and forecast, by Type
- 7.3.5.6.3. Market size and forecast, by Therapy
- 7.3.5.6.4. Market size and forecast, by End Users
- 7.4. Asia-Pacific
- 7.4.1. Key trends and opportunities
- 7.4.2. Market size and forecast, by Type
- 7.4.3. Market size and forecast, by Therapy
- 7.4.4. Market size and forecast, by End Users
- 7.4.5. Market size and forecast, by country
- 7.4.5.1. Japan
- 7.4.5.1.1. Key market trends, growth factors and opportunities
- 7.4.5.1.2. Market size and forecast, by Type
- 7.4.5.1.3. Market size and forecast, by Therapy
- 7.4.5.1.4. Market size and forecast, by End Users
- 7.4.5.2. China
- 7.4.5.2.1. Key market trends, growth factors and opportunities
- 7.4.5.2.2. Market size and forecast, by Type
- 7.4.5.2.3. Market size and forecast, by Therapy
- 7.4.5.2.4. Market size and forecast, by End Users
- 7.4.5.3. Australia
- 7.4.5.3.1. Key market trends, growth factors and opportunities
- 7.4.5.3.2. Market size and forecast, by Type
- 7.4.5.3.3. Market size and forecast, by Therapy
- 7.4.5.3.4. Market size and forecast, by End Users
- 7.4.5.4. India
- 7.4.5.4.1. Key market trends, growth factors and opportunities
- 7.4.5.4.2. Market size and forecast, by Type
- 7.4.5.4.3. Market size and forecast, by Therapy
- 7.4.5.4.4. Market size and forecast, by End Users
- 7.4.5.5. South Korea
- 7.4.5.5.1. Key market trends, growth factors and opportunities
- 7.4.5.5.2. Market size and forecast, by Type
- 7.4.5.5.3. Market size and forecast, by Therapy
- 7.4.5.5.4. Market size and forecast, by End Users
- 7.4.5.6. Rest of Asia-Pacific
- 7.4.5.6.1. Key market trends, growth factors and opportunities
- 7.4.5.6.2. Market size and forecast, by Type
- 7.4.5.6.3. Market size and forecast, by Therapy
- 7.4.5.6.4. Market size and forecast, by End Users
- 7.5. LAMEA
- 7.5.1. Key trends and opportunities
- 7.5.2. Market size and forecast, by Type
- 7.5.3. Market size and forecast, by Therapy
- 7.5.4. Market size and forecast, by End Users
- 7.5.5. Market size and forecast, by country
- 7.5.5.1. Brazil
- 7.5.5.1.1. Key market trends, growth factors and opportunities
- 7.5.5.1.2. Market size and forecast, by Type
- 7.5.5.1.3. Market size and forecast, by Therapy
- 7.5.5.1.4. Market size and forecast, by End Users
- 7.5.5.2. Saudi Arabia
- 7.5.5.2.1. Key market trends, growth factors and opportunities
- 7.5.5.2.2. Market size and forecast, by Type
- 7.5.5.2.3. Market size and forecast, by Therapy
- 7.5.5.2.4. Market size and forecast, by End Users
- 7.5.5.3. South Africa
- 7.5.5.3.1. Key market trends, growth factors and opportunities
- 7.5.5.3.2. Market size and forecast, by Type
- 7.5.5.3.3. Market size and forecast, by Therapy
- 7.5.5.3.4. Market size and forecast, by End Users
- 7.5.5.4. Rest of LAMEA
- 7.5.5.4.1. Key market trends, growth factors and opportunities
- 7.5.5.4.2. Market size and forecast, by Type
- 7.5.5.4.3. Market size and forecast, by Therapy
- 7.5.5.4.4. Market size and forecast, by End Users
CHAPTER 8: COMPETITIVE LANDSCAPE
- 8.1. Introduction
- 8.2. Top winning strategies
- 8.3. Product Mapping of Top 10 Player
- 8.4. Competitive Dashboard
- 8.5. Competitive Heatmap
- 8.6. Top player positioning, 2021
CHAPTER 9: COMPANY PROFILES
- 9.1. Eli Lilly and Company
- 9.1.1. Company overview
- 9.1.2. Key Executives
- 9.1.3. Company snapshot
- 9.1.4. Operating business segments
- 9.1.5. Product portfolio
- 9.1.6. Business performance
- 9.2. AstraZeneca
- 9.2.1. Company overview
- 9.2.2. Key Executives
- 9.2.3. Company snapshot
- 9.2.4. Operating business segments
- 9.2.5. Product portfolio
- 9.2.6. Business performance
- 9.2.7. Key strategic moves and developments
- 9.3. Ypsomed AG
- 9.3.1. Company overview
- 9.3.2. Key Executives
- 9.3.3. Company snapshot
- 9.3.4. Operating business segments
- 9.3.5. Product portfolio
- 9.3.6. Business performance
- 9.3.7. Key strategic moves and developments
- 9.4. Becton, Dickinson and Company
- 9.4.1. Company overview
- 9.4.2. Key Executives
- 9.4.3. Company snapshot
- 9.4.4. Operating business segments
- 9.4.5. Product portfolio
- 9.4.6. Business performance
- 9.5. Merck Group
- 9.5.1. Company overview
- 9.5.2. Key Executives
- 9.5.3. Company snapshot
- 9.5.4. Operating business segments
- 9.5.5. Product portfolio
- 9.5.6. Business performance
- 9.6. Pfizer Inc.
- 9.6.1. Company overview
- 9.6.2. Key Executives
- 9.6.3. Company snapshot
- 9.6.4. Operating business segments
- 9.6.5. Product portfolio
- 9.6.6. Business performance
- 9.7. Novartis AG
- 9.7.1. Company overview
- 9.7.2. Key Executives
- 9.7.3. Company snapshot
- 9.7.4. Operating business segments
- 9.7.5. Product portfolio
- 9.7.6. Business performance
- 9.8. Sanofi
- 9.8.1. Company overview
- 9.8.2. Key Executives
- 9.8.3. Company snapshot
- 9.8.4. Operating business segments
- 9.8.5. Product portfolio
- 9.8.6. Business performance
- 9.9. Novo Nordisk A/S
- 9.9.1. Company overview
- 9.9.2. Key Executives
- 9.9.3. Company snapshot
- 9.9.4. Operating business segments
- 9.9.5. Product portfolio
- 9.9.6. Business performance
- 9.10. Biocon
- 9.10.1. Company overview
- 9.10.2. Key Executives
- 9.10.3. Company snapshot
- 9.10.4. Operating business segments
- 9.10.5. Product portfolio
- 9.10.6. Business performance