|
|
市場調査レポート
商品コード
1266340
骨接合装置市場:デバイスタイプ別、骨折タイプ別、エンドユーザー別:世界の機会分析と産業予測、2021-2031年Osteosynthesis Devices Market By Device Type, By Fracture Type, By End User : Global Opportunity Analysis and Industry Forecast, 2021-2031 |
||||||
|
|
|||||||


| 骨接合装置市場:デバイスタイプ別、骨折タイプ別、エンドユーザー別:世界の機会分析と産業予測、2021-2031年 |
|
出版日: 2023年02月01日
発行: Allied Market Research
ページ情報: 英文 256 Pages
納期: 2~3営業日
|
- 全表示
- 概要
- 図表
- 目次
骨接合装置市場は、2021年に90億6,120万米ドルとなり、2022年から2031年にかけて4.6%のCAGRを示し、2031年には142億1,492万米ドルに達すると推定されています。
骨接合装置は、骨折や損傷を受けた骨を安定させたり、融合させたりするために用いられる医療用インプラントです。オステオシンセシスの目的は、迅速な治癒と正常な骨機能の回復を達成することです。骨接合装置には、プレート、スクリュー、ピン、髄内釘などの種類があり、これらを単独または組み合わせて使用することで、骨を安定させることができます。これらの器具は通常、ステンレスやチタンなどの金属でできており、強度、耐久性、生体適合性に優れた設計になっています。骨接合装置は、骨を安定させるだけでなく、変形を矯正したり、治癒過程をサポートするために使用されることもあります。使用する器具の種類は、骨折の部位や性質、患者の年齢、病歴、その他の要因によって決まります。
市場の成長を促進する主な要因としては、骨接合装置の技術的進歩の増加、骨折しやすい変形性関節症や骨粗鬆症などの整形外科疾患の有病率の増加、整形外科インプラントの潜在的な利点に対する意識の高まりが挙げられます。例えば、Verywell HealthとNational Centre for biotechnology information(NCBI)によると、2020年には米国で約150万人が関節リウマチを患っているとされています。National Centre for biotechnology information(NCBI)によると、2022年には、米国で294,000人の子供が若年性特発性関節炎に苦しんでいます。2025年には、6,700万人のアメリカ人が関節炎と診断されると予想されています。
さらに、骨接合装置の採用が進み、骨折を引き起こす事故&スポーツ傷害の増加により、スクリュー&プレート、外部骨折固定デバイスなどの骨接合装置の需要が増加し、骨接合装置市場の成長をさらに押し上げています。例えば、米国国家安全評議会が2022年に発表した報告書によると、2021年には2020年と比較してスポーツやレクリエーションでの怪我が20%増加したことが確認されたため、スポーツ関連の怪我件数の増加が市場の成長を促進すると考えられています。
しかし、骨接合装置の高額な費用、骨接合装置に伴う健康リスクや合併症が、骨接合装置市場の成長を妨げると予想されます。逆に、新興経済諸国における満たされない医療需要と新興諸国における有利なビジネスチャンスは、将来的に骨接合装置製品メーカーに計り知れない機会をもたらすと予想されます。
骨接合装置市場は、装置の種類、骨折の種類、エンドユーザー、地域に基づいて区分されます。デバイスタイプに基づき、市場は内部固定デバイスと外部固定デバイスに分類されます。内固定装置は、さらにスクリュー&プレート、ワイヤー&ピン、髄内ロッド&ネイル、脊椎固定装置に分けられます。外部固定装置セグメントは、さらに骨折固定装置と骨延長装置に分けられます。骨折の種類に基づき、市場は股関節、膝、脊椎、肩、足首、顔面骨、その他に分類されます。エンドユーザー別に見ると、市場は病院、整形外科クリニック、外来手術センターに分類されます。
目次
第1章 イントロダクション
第2章 エグゼクティブサマリー
第3章 市場の概要
- 市場の定義と範囲
- 主な調査結果
- トップインパクトファクター
- トップインベストメントポケット
- ポーターのファイブフォース分析
- 供給企業の交渉力
- 買い手の交渉力
- 代替品の脅威
- 新規参入業者の脅威
- ライバルの強さ
- 市場力学
- 促進要因
- 整形外科疾患の有病率の上昇
- 事故・スポーツ障害件数の増加
- 老年人口の増加
- 抑制要因
- 骨接合装置に伴う合併症
- 機会について
- 新規骨接合装置を発売
- 促進要因
- COVID-19市場への影響度分析
第4章 骨接合装置市場:デバイスの種類別
- 概要
- 市場規模・予測
- 内部固定装置
- 主な市場動向、成長要因、機会について
- 市場規模・予測:地域別
- 市場シェア分析:国別分析
- 内固定装置骨接合装置市場:タイプ別
- 外付け固定装置
- 主な市場動向、成長要因、機会について
- 市場規模・予測:地域別
- 市場シェア分析:国別分析
- 外部固定装置骨接合装置市場:タイプ別
第5章 骨接合装置市場:骨折の種類別
- 概要
- 市場規模・予測
- 股関節の骨折
- 主な市場動向、成長要因、機会について
- 市場規模・予測:地域別
- 市場シェア分析:国別分析
- 膝の骨折
- 主な市場動向、成長要因、機会について
- 市場規模・予測:地域別
- 市場シェア分析:国別分析
- 背骨の骨折
- 主な市場動向、成長要因、機会について
- 市場規模・予測:地域別
- 市場シェア分析:国別分析
- 肩の骨折
- 主な市場動向、成長要因、機会について
- 市場規模・予測:地域別
- 市場シェア分析:国別分析
- 足・足首の骨折
- 主な市場動向、成長要因、機会について
- 市場規模・予測:地域別
- 市場シェア分析:国別分析
- 顔面骨骨折
- 主な市場動向、成長要因、機会について
- 市場規模・予測:地域別
- 市場シェア分析:国別分析
- その他
- 主な市場動向、成長要因、機会について
- 市場規模・予測:地域別
- 市場シェア分析:国別分析
第6章 骨接合装置市場:エンドユーザー別
- 概要
- 市場規模・予測
- 病院
- 主な市場動向、成長要因、機会について
- 市場規模・予測:地域別
- 市場シェア分析:国別分析
- 整形外科クリニック
- 主な市場動向、成長要因、機会について
- 市場規模・予測:地域別
- 市場シェア分析:国別分析
- 外来手術センター
- 主な市場動向、成長要因、機会について
- 市場規模・予測:地域別
- 市場シェア分析:国別分析
第7章 骨接合装置市場:地域別
- 概要
- 市場規模・予測:地域別
- 北米
- 主な動向と機会
- 市場規模・予測:デバイスタイプ別
- 市場規模・予測:骨折の種類別
- 市場規模・予測:エンドユーザー別
- 市場規模・予測:国別
- 米国
- 主な市場動向、成長要因、機会について
- 市場規模・予測:デバイスタイプ別
- 市場規模・予測:骨折の種類別
- 市場規模・予測:エンドユーザー別
- カナダ
- 主な市場動向、成長要因、機会について
- 市場規模・予測:デバイスタイプ別
- 市場規模・予測:骨折の種類別
- 市場規模・予測:エンドユーザー別
- メキシコ
- 主な市場動向、成長要因、機会について
- 市場規模・予測:デバイスタイプ別
- 市場規模・予測:骨折の種類別
- 市場規模・予測:エンドユーザー別
- 欧州
- 主な動向と機会
- 市場規模・予測:デバイスタイプ別
- 市場規模・予測:骨折の種類別
- 市場規模・予測:エンドユーザー別
- 市場規模・予測:国別
- ドイツ
- 主な市場動向、成長要因、機会について
- 市場規模・予測:デバイスタイプ別
- 市場規模・予測:骨折の種類別
- 市場規模・予測:エンドユーザー別
- フランス
- 主な市場動向、成長要因、機会について
- 市場規模・予測:デバイスタイプ別
- 市場規模・予測:骨折の種類別
- 市場規模・予測:エンドユーザー別
- 英国
- 主な市場動向、成長要因、機会について
- 市場規模・予測:デバイスタイプ別
- 市場規模・予測:骨折の種類別
- 市場規模・予測:エンドユーザー別
- イタリア
- 主な市場動向、成長要因、機会について
- 市場規模・予測:デバイスタイプ別
- 市場規模・予測:骨折の種類別
- 市場規模・予測:エンドユーザー別
- スペイン
- 主な市場動向、成長要因、機会について
- 市場規模・予測:デバイスタイプ別
- 市場規模・予測:骨折の種類別
- 市場規模・予測:エンドユーザー別
- その他欧州
- 主な市場動向、成長要因、機会について
- 市場規模・予測:デバイスタイプ別
- 市場規模・予測:骨折の種類別
- 市場規模・予測:エンドユーザー別
- アジア太平洋地域
- 主な動向と機会
- 市場規模・予測:デバイスタイプ別
- 市場規模・予測:骨折の種類別
- 市場規模・予測:エンドユーザー別
- 市場規模・予測:国別
- 日本
- 主な市場動向、成長要因、機会について
- 市場規模・予測:デバイスタイプ別
- 市場規模・予測:骨折の種類別
- 市場規模・予測:エンドユーザー別
- 中国
- 主な市場動向、成長要因、機会について
- 市場規模・予測:デバイスタイプ別
- 市場規模・予測:骨折の種類別
- 市場規模・予測:エンドユーザー別
- オーストラリア
- 主な市場動向、成長要因、機会について
- 市場規模・予測:デバイスタイプ別
- 市場規模・予測:骨折の種類別
- 市場規模・予測:エンドユーザー別
- インド
- 主な市場動向、成長要因、機会について
- 市場規模・予測:デバイスタイプ別
- 市場規模・予測:骨折の種類別
- 市場規模・予測:エンドユーザー別
- 韓国
- 主な市場動向、成長要因、機会について
- 市場規模・予測:デバイスタイプ別
- 市場規模・予測:骨折の種類別
- 市場規模・予測:エンドユーザー別
- その他アジア太平洋地域
- 主な市場動向、成長要因、機会について
- 市場規模・予測:デバイスタイプ別
- 市場規模・予測:骨折の種類別
- 市場規模・予測:エンドユーザー別
- LAMEA
- 主な動向と機会
- 市場規模・予測:デバイスタイプ別
- 市場規模・予測:骨折の種類別
- 市場規模・予測:エンドユーザー別
- 市場規模・予測:国別
- ブラジル
- 主な市場動向、成長要因、機会について
- 市場規模・予測:デバイスタイプ別
- 市場規模・予測:骨折の種類別
- 市場規模・予測:エンドユーザー別
- サウジアラビア
- 主な市場動向、成長要因、機会について
- 市場規模・予測:デバイスタイプ別
- 市場規模・予測:骨折の種類別
- 市場規模・予測:エンドユーザー別
- 南アフリカ
- 主な市場動向、成長要因、機会について
- 市場規模・予測:デバイスタイプ別
- 市場規模・予測:骨折の種類別
- 市場規模・予測:エンドユーザー別
- LAMEAの残りの地域
- 主な市場動向、成長要因、機会について
- 市場規模・予測:デバイスタイプ別
- 市場規模・予測:骨折の種類別
- 市場規模・予測:エンドユーザー別
第8章 競合情勢
- イントロダクション
- 主要成功戦略
- 主要10社の製品マッピング
- 競合ダッシュボード
- 競合ヒートマップ
- トップ企業のポジショニング、2021年
第9章 企業プロファイル
- Arthrex, Inc.
- Globus Medical, Inc.
- GS Solutions, Inc.
- Johnson & Johnson
- Life Spine, Inc.
- Precision Spine, Inc.
- Stryker Corporation
- Zimmer Biomet Holding Inc.
- Medtronic plc
- Smith & Nephew plc
LIST OF TABLES
- TABLE 01. GLOBAL OSTEOSYNTHESIS DEVICES MARKET, BY DEVICE TYPE, 2021-2031 ($MILLION)
- TABLE 02. OSTEOSYNTHESIS DEVICES MARKET FOR INTERNAL FIXATION DEVICES, BY REGION, 2021-2031 ($MILLION)
- TABLE 03. GLOBAL INTERNAL FIXATION DEVICES OSTEOSYNTHESIS DEVICES MARKET, BY TYPE, 2021-2031 ($MILLION)
- TABLE 04. OSTEOSYNTHESIS DEVICES MARKET FOR EXTERNAL FIXATION DEVICES, BY REGION, 2021-2031 ($MILLION)
- TABLE 05. GLOBAL EXTERNAL FIXATION DEVICES OSTEOSYNTHESIS DEVICES MARKET, BY TYPE, 2021-2031 ($MILLION)
- TABLE 06. GLOBAL OSTEOSYNTHESIS DEVICES MARKET, BY FRACTURE TYPE, 2021-2031 ($MILLION)
- TABLE 07. OSTEOSYNTHESIS DEVICES MARKET FOR HIP FRACTURE, BY REGION, 2021-2031 ($MILLION)
- TABLE 08. OSTEOSYNTHESIS DEVICES MARKET FOR KNEE FRACTURE, BY REGION, 2021-2031 ($MILLION)
- TABLE 09. OSTEOSYNTHESIS DEVICES MARKET FOR SPINE FRACTURE, BY REGION, 2021-2031 ($MILLION)
- TABLE 10. OSTEOSYNTHESIS DEVICES MARKET FOR SHOULDER FRACTURE, BY REGION, 2021-2031 ($MILLION)
- TABLE 11. OSTEOSYNTHESIS DEVICES MARKET FOR FOOT AND ANKLE FRACTURE, BY REGION, 2021-2031 ($MILLION)
- TABLE 12. OSTEOSYNTHESIS DEVICES MARKET FOR FACIAL BONES FRACTURE, BY REGION, 2021-2031 ($MILLION)
- TABLE 13. OSTEOSYNTHESIS DEVICES MARKET FOR OTHERS, BY REGION, 2021-2031 ($MILLION)
- TABLE 14. GLOBAL OSTEOSYNTHESIS DEVICES MARKET, BY END USER, 2021-2031 ($MILLION)
- TABLE 15. OSTEOSYNTHESIS DEVICES MARKET FOR HOSPITALS, BY REGION, 2021-2031 ($MILLION)
- TABLE 16. OSTEOSYNTHESIS DEVICES MARKET FOR ORTHOPAEDIC CLINICS, BY REGION, 2021-2031 ($MILLION)
- TABLE 17. OSTEOSYNTHESIS DEVICES MARKET FOR AMBULATORY SURGICAL CENTERS, BY REGION, 2021-2031 ($MILLION)
- TABLE 18. OSTEOSYNTHESIS DEVICES MARKET, BY REGION, 2021-2031 ($MILLION)
- TABLE 19. NORTH AMERICA OSTEOSYNTHESIS DEVICES MARKET, BY DEVICE TYPE, 2021-2031 ($MILLION)
- TABLE 20. NORTH AMERICA OSTEOSYNTHESIS DEVICES MARKET, BY FRACTURE TYPE, 2021-2031 ($MILLION)
- TABLE 21. NORTH AMERICA OSTEOSYNTHESIS DEVICES MARKET, BY END USER, 2021-2031 ($MILLION)
- TABLE 22. NORTH AMERICA OSTEOSYNTHESIS DEVICES MARKET, BY COUNTRY, 2021-2031 ($MILLION)
- TABLE 23. U.S. OSTEOSYNTHESIS DEVICES MARKET, BY DEVICE TYPE, 2021-2031 ($MILLION)
- TABLE 24. U.S. OSTEOSYNTHESIS DEVICES MARKET, BY FRACTURE TYPE, 2021-2031 ($MILLION)
- TABLE 25. U.S. OSTEOSYNTHESIS DEVICES MARKET, BY END USER, 2021-2031 ($MILLION)
- TABLE 26. CANADA OSTEOSYNTHESIS DEVICES MARKET, BY DEVICE TYPE, 2021-2031 ($MILLION)
- TABLE 27. CANADA OSTEOSYNTHESIS DEVICES MARKET, BY FRACTURE TYPE, 2021-2031 ($MILLION)
- TABLE 28. CANADA OSTEOSYNTHESIS DEVICES MARKET, BY END USER, 2021-2031 ($MILLION)
- TABLE 29. MEXICO OSTEOSYNTHESIS DEVICES MARKET, BY DEVICE TYPE, 2021-2031 ($MILLION)
- TABLE 30. MEXICO OSTEOSYNTHESIS DEVICES MARKET, BY FRACTURE TYPE, 2021-2031 ($MILLION)
- TABLE 31. MEXICO OSTEOSYNTHESIS DEVICES MARKET, BY END USER, 2021-2031 ($MILLION)
- TABLE 32. EUROPE OSTEOSYNTHESIS DEVICES MARKET, BY DEVICE TYPE, 2021-2031 ($MILLION)
- TABLE 33. EUROPE OSTEOSYNTHESIS DEVICES MARKET, BY FRACTURE TYPE, 2021-2031 ($MILLION)
- TABLE 34. EUROPE OSTEOSYNTHESIS DEVICES MARKET, BY END USER, 2021-2031 ($MILLION)
- TABLE 35. EUROPE OSTEOSYNTHESIS DEVICES MARKET, BY COUNTRY, 2021-2031 ($MILLION)
- TABLE 36. GERMANY OSTEOSYNTHESIS DEVICES MARKET, BY DEVICE TYPE, 2021-2031 ($MILLION)
- TABLE 37. GERMANY OSTEOSYNTHESIS DEVICES MARKET, BY FRACTURE TYPE, 2021-2031 ($MILLION)
- TABLE 38. GERMANY OSTEOSYNTHESIS DEVICES MARKET, BY END USER, 2021-2031 ($MILLION)
- TABLE 39. FRANCE OSTEOSYNTHESIS DEVICES MARKET, BY DEVICE TYPE, 2021-2031 ($MILLION)
- TABLE 40. FRANCE OSTEOSYNTHESIS DEVICES MARKET, BY FRACTURE TYPE, 2021-2031 ($MILLION)
- TABLE 41. FRANCE OSTEOSYNTHESIS DEVICES MARKET, BY END USER, 2021-2031 ($MILLION)
- TABLE 42. UK OSTEOSYNTHESIS DEVICES MARKET, BY DEVICE TYPE, 2021-2031 ($MILLION)
- TABLE 43. UK OSTEOSYNTHESIS DEVICES MARKET, BY FRACTURE TYPE, 2021-2031 ($MILLION)
- TABLE 44. UK OSTEOSYNTHESIS DEVICES MARKET, BY END USER, 2021-2031 ($MILLION)
- TABLE 45. ITALY OSTEOSYNTHESIS DEVICES MARKET, BY DEVICE TYPE, 2021-2031 ($MILLION)
- TABLE 46. ITALY OSTEOSYNTHESIS DEVICES MARKET, BY FRACTURE TYPE, 2021-2031 ($MILLION)
- TABLE 47. ITALY OSTEOSYNTHESIS DEVICES MARKET, BY END USER, 2021-2031 ($MILLION)
- TABLE 48. SPAIN OSTEOSYNTHESIS DEVICES MARKET, BY DEVICE TYPE, 2021-2031 ($MILLION)
- TABLE 49. SPAIN OSTEOSYNTHESIS DEVICES MARKET, BY FRACTURE TYPE, 2021-2031 ($MILLION)
- TABLE 50. SPAIN OSTEOSYNTHESIS DEVICES MARKET, BY END USER, 2021-2031 ($MILLION)
- TABLE 51. REST OF EUROPE OSTEOSYNTHESIS DEVICES MARKET, BY DEVICE TYPE, 2021-2031 ($MILLION)
- TABLE 52. REST OF EUROPE OSTEOSYNTHESIS DEVICES MARKET, BY FRACTURE TYPE, 2021-2031 ($MILLION)
- TABLE 53. REST OF EUROPE OSTEOSYNTHESIS DEVICES MARKET, BY END USER, 2021-2031 ($MILLION)
- TABLE 54. ASIA-PACIFIC OSTEOSYNTHESIS DEVICES MARKET, BY DEVICE TYPE, 2021-2031 ($MILLION)
- TABLE 55. ASIA-PACIFIC OSTEOSYNTHESIS DEVICES MARKET, BY FRACTURE TYPE, 2021-2031 ($MILLION)
- TABLE 56. ASIA-PACIFIC OSTEOSYNTHESIS DEVICES MARKET, BY END USER, 2021-2031 ($MILLION)
- TABLE 57. ASIA-PACIFIC OSTEOSYNTHESIS DEVICES MARKET, BY COUNTRY, 2021-2031 ($MILLION)
- TABLE 58. JAPAN OSTEOSYNTHESIS DEVICES MARKET, BY DEVICE TYPE, 2021-2031 ($MILLION)
- TABLE 59. JAPAN OSTEOSYNTHESIS DEVICES MARKET, BY FRACTURE TYPE, 2021-2031 ($MILLION)
- TABLE 60. JAPAN OSTEOSYNTHESIS DEVICES MARKET, BY END USER, 2021-2031 ($MILLION)
- TABLE 61. CHINA OSTEOSYNTHESIS DEVICES MARKET, BY DEVICE TYPE, 2021-2031 ($MILLION)
- TABLE 62. CHINA OSTEOSYNTHESIS DEVICES MARKET, BY FRACTURE TYPE, 2021-2031 ($MILLION)
- TABLE 63. CHINA OSTEOSYNTHESIS DEVICES MARKET, BY END USER, 2021-2031 ($MILLION)
- TABLE 64. AUSTRALIA OSTEOSYNTHESIS DEVICES MARKET, BY DEVICE TYPE, 2021-2031 ($MILLION)
- TABLE 65. AUSTRALIA OSTEOSYNTHESIS DEVICES MARKET, BY FRACTURE TYPE, 2021-2031 ($MILLION)
- TABLE 66. AUSTRALIA OSTEOSYNTHESIS DEVICES MARKET, BY END USER, 2021-2031 ($MILLION)
- TABLE 67. INDIA OSTEOSYNTHESIS DEVICES MARKET, BY DEVICE TYPE, 2021-2031 ($MILLION)
- TABLE 68. INDIA OSTEOSYNTHESIS DEVICES MARKET, BY FRACTURE TYPE, 2021-2031 ($MILLION)
- TABLE 69. INDIA OSTEOSYNTHESIS DEVICES MARKET, BY END USER, 2021-2031 ($MILLION)
- TABLE 70. SOUTH KOREA OSTEOSYNTHESIS DEVICES MARKET, BY DEVICE TYPE, 2021-2031 ($MILLION)
- TABLE 71. SOUTH KOREA OSTEOSYNTHESIS DEVICES MARKET, BY FRACTURE TYPE, 2021-2031 ($MILLION)
- TABLE 72. SOUTH KOREA OSTEOSYNTHESIS DEVICES MARKET, BY END USER, 2021-2031 ($MILLION)
- TABLE 73. REST OF ASIA-PACIFIC OSTEOSYNTHESIS DEVICES MARKET, BY DEVICE TYPE, 2021-2031 ($MILLION)
- TABLE 74. REST OF ASIA-PACIFIC OSTEOSYNTHESIS DEVICES MARKET, BY FRACTURE TYPE, 2021-2031 ($MILLION)
- TABLE 75. REST OF ASIA-PACIFIC OSTEOSYNTHESIS DEVICES MARKET, BY END USER, 2021-2031 ($MILLION)
- TABLE 76. LAMEA OSTEOSYNTHESIS DEVICES MARKET, BY DEVICE TYPE, 2021-2031 ($MILLION)
- TABLE 77. LAMEA OSTEOSYNTHESIS DEVICES MARKET, BY FRACTURE TYPE, 2021-2031 ($MILLION)
- TABLE 78. LAMEA OSTEOSYNTHESIS DEVICES MARKET, BY END USER, 2021-2031 ($MILLION)
- TABLE 79. LAMEA OSTEOSYNTHESIS DEVICES MARKET, BY COUNTRY, 2021-2031 ($MILLION)
- TABLE 80. BRAZIL OSTEOSYNTHESIS DEVICES MARKET, BY DEVICE TYPE, 2021-2031 ($MILLION)
- TABLE 81. BRAZIL OSTEOSYNTHESIS DEVICES MARKET, BY FRACTURE TYPE, 2021-2031 ($MILLION)
- TABLE 82. BRAZIL OSTEOSYNTHESIS DEVICES MARKET, BY END USER, 2021-2031 ($MILLION)
- TABLE 83. SAUDI ARABIA OSTEOSYNTHESIS DEVICES MARKET, BY DEVICE TYPE, 2021-2031 ($MILLION)
- TABLE 84. SAUDI ARABIA OSTEOSYNTHESIS DEVICES MARKET, BY FRACTURE TYPE, 2021-2031 ($MILLION)
- TABLE 85. SAUDI ARABIA OSTEOSYNTHESIS DEVICES MARKET, BY END USER, 2021-2031 ($MILLION)
- TABLE 86. SOUTH AFRICA OSTEOSYNTHESIS DEVICES MARKET, BY DEVICE TYPE, 2021-2031 ($MILLION)
- TABLE 87. SOUTH AFRICA OSTEOSYNTHESIS DEVICES MARKET, BY FRACTURE TYPE, 2021-2031 ($MILLION)
- TABLE 88. SOUTH AFRICA OSTEOSYNTHESIS DEVICES MARKET, BY END USER, 2021-2031 ($MILLION)
- TABLE 89. REST OF LAMEA OSTEOSYNTHESIS DEVICES MARKET, BY DEVICE TYPE, 2021-2031 ($MILLION)
- TABLE 90. REST OF LAMEA OSTEOSYNTHESIS DEVICES MARKET, BY FRACTURE TYPE, 2021-2031 ($MILLION)
- TABLE 91. REST OF LAMEA OSTEOSYNTHESIS DEVICES MARKET, BY END USER, 2021-2031 ($MILLION)
- TABLE 92. ARTHREX, INC.: KEY EXECUTIVES
- TABLE 93. ARTHREX, INC.: COMPANY SNAPSHOT
- TABLE 94. ARTHREX, INC.: PRODUCT SEGMENTS
- TABLE 95. ARTHREX, INC.: PRODUCT PORTFOLIO
- TABLE 96. GLOBUS MEDICAL, INC.: KEY EXECUTIVES
- TABLE 97. GLOBUS MEDICAL, INC.: COMPANY SNAPSHOT
- TABLE 98. GLOBUS MEDICAL, INC.: PRODUCT SEGMENTS
- TABLE 99. GLOBUS MEDICAL, INC.: PRODUCT PORTFOLIO
- TABLE 100. GLOBUS MEDICAL, INC.: KEY STRATERGIES
- TABLE 101. GS SOLUTIONS, INC.: KEY EXECUTIVES
- TABLE 102. GS SOLUTIONS, INC.: COMPANY SNAPSHOT
- TABLE 103. GS SOLUTIONS, INC.: PRODUCT SEGMENTS
- TABLE 104. GS SOLUTIONS, INC.: PRODUCT PORTFOLIO
- TABLE 105. JOHNSON & JOHNSON: KEY EXECUTIVES
- TABLE 106. JOHNSON & JOHNSON: COMPANY SNAPSHOT
- TABLE 107. JOHNSON & JOHNSON: PRODUCT SEGMENTS
- TABLE 108. JOHNSON & JOHNSON: PRODUCT PORTFOLIO
- TABLE 109. JOHNSON & JOHNSON: KEY STRATERGIES
- TABLE 110. LIFE SPINE, INC.: KEY EXECUTIVES
- TABLE 111. LIFE SPINE, INC.: COMPANY SNAPSHOT
- TABLE 112. LIFE SPINE, INC.: PRODUCT SEGMENTS
- TABLE 113. LIFE SPINE, INC.: PRODUCT PORTFOLIO
- TABLE 114. LIFE SPINE, INC.: KEY STRATERGIES
- TABLE 115. PRECISION SPINE, INC.: KEY EXECUTIVES
- TABLE 116. PRECISION SPINE, INC.: COMPANY SNAPSHOT
- TABLE 117. PRECISION SPINE, INC.: PRODUCT SEGMENTS
- TABLE 118. PRECISION SPINE, INC.: PRODUCT PORTFOLIO
- TABLE 119. PRECISION SPINE, INC.: KEY STRATERGIES
- TABLE 120. STRYKER CORPORATION: KEY EXECUTIVES
- TABLE 121. STRYKER CORPORATION: COMPANY SNAPSHOT
- TABLE 122. STRYKER CORPORATION: PRODUCT SEGMENTS
- TABLE 123. STRYKER CORPORATION: PRODUCT PORTFOLIO
- TABLE 124. ZIMMER BIOMET HOLDING INC.: KEY EXECUTIVES
- TABLE 125. ZIMMER BIOMET HOLDING INC.: COMPANY SNAPSHOT
- TABLE 126. ZIMMER BIOMET HOLDING INC.: PRODUCT SEGMENTS
- TABLE 127. ZIMMER BIOMET HOLDING INC.: PRODUCT PORTFOLIO
- TABLE 128. MEDTRONIC PLC: KEY EXECUTIVES
- TABLE 129. MEDTRONIC PLC: COMPANY SNAPSHOT
- TABLE 130. MEDTRONIC PLC: PRODUCT SEGMENTS
- TABLE 131. MEDTRONIC PLC: PRODUCT PORTFOLIO
- TABLE 132. MEDTRONIC PLC: KEY STRATERGIES
- TABLE 133. SMITH & NEPHEW PLC: KEY EXECUTIVES
- TABLE 134. SMITH & NEPHEW PLC: COMPANY SNAPSHOT
- TABLE 135. SMITH & NEPHEW PLC: PRODUCT SEGMENTS
- TABLE 136. SMITH & NEPHEW PLC: PRODUCT PORTFOLIO
LIST OF FIGURES
- FIGURE 01. OSTEOSYNTHESIS DEVICES MARKET, 2021-2031
- FIGURE 02. SEGMENTATION OF OSTEOSYNTHESIS DEVICES MARKET, 2021-2031
- FIGURE 03. TOP INVESTMENT POCKETS IN OSTEOSYNTHESIS DEVICES MARKET (2022-2031)
- FIGURE 04. LOW BARGAINING POWER OF SUPPLIERS
- FIGURE 05. LOW BARGAINING POWER OF BUYERS
- FIGURE 06. LOW THREAT OF SUBSTITUTES
- FIGURE 07. LOW THREAT OF NEW ENTRANTS
- FIGURE 08. LOW INTENSITY OF RIVALRY
- FIGURE 09. DRIVERS, RESTRAINTS AND OPPORTUNITIES: GLOBALOSTEOSYNTHESIS DEVICES MARKET
- FIGURE 10. OSTEOSYNTHESIS DEVICES MARKET, BY DEVICE TYPE, 2021(%)
- FIGURE 11. COMPARATIVE SHARE ANALYSIS OF OSTEOSYNTHESIS DEVICES MARKET FOR INTERNAL FIXATION DEVICES, BY COUNTRY 2021-2031(%)
- FIGURE 12. COMPARATIVE SHARE ANALYSIS OF OSTEOSYNTHESIS DEVICES MARKET FOR EXTERNAL FIXATION DEVICES, BY COUNTRY 2021-2031(%)
- FIGURE 13. OSTEOSYNTHESIS DEVICES MARKET, BY FRACTURE TYPE, 2021(%)
- FIGURE 14. COMPARATIVE SHARE ANALYSIS OF OSTEOSYNTHESIS DEVICES MARKET FOR HIP FRACTURE, BY COUNTRY 2021-2031(%)
- FIGURE 15. COMPARATIVE SHARE ANALYSIS OF OSTEOSYNTHESIS DEVICES MARKET FOR KNEE FRACTURE, BY COUNTRY 2021-2031(%)
- FIGURE 16. COMPARATIVE SHARE ANALYSIS OF OSTEOSYNTHESIS DEVICES MARKET FOR SPINE FRACTURE, BY COUNTRY 2021-2031(%)
- FIGURE 17. COMPARATIVE SHARE ANALYSIS OF OSTEOSYNTHESIS DEVICES MARKET FOR SHOULDER FRACTURE, BY COUNTRY 2021-2031(%)
- FIGURE 18. COMPARATIVE SHARE ANALYSIS OF OSTEOSYNTHESIS DEVICES MARKET FOR FOOT AND ANKLE FRACTURE, BY COUNTRY 2021-2031(%)
- FIGURE 19. COMPARATIVE SHARE ANALYSIS OF OSTEOSYNTHESIS DEVICES MARKET FOR FACIAL BONES FRACTURE, BY COUNTRY 2021-2031(%)
- FIGURE 20. COMPARATIVE SHARE ANALYSIS OF OSTEOSYNTHESIS DEVICES MARKET FOR OTHERS, BY COUNTRY 2021-2031(%)
- FIGURE 21. OSTEOSYNTHESIS DEVICES MARKET, BY END USER, 2021(%)
- FIGURE 22. COMPARATIVE SHARE ANALYSIS OF OSTEOSYNTHESIS DEVICES MARKET FOR HOSPITALS, BY COUNTRY 2021-2031(%)
- FIGURE 23. COMPARATIVE SHARE ANALYSIS OF OSTEOSYNTHESIS DEVICES MARKET FOR ORTHOPAEDIC CLINICS, BY COUNTRY 2021-2031(%)
- FIGURE 24. COMPARATIVE SHARE ANALYSIS OF OSTEOSYNTHESIS DEVICES MARKET FOR AMBULATORY SURGICAL CENTERS, BY COUNTRY 2021-2031(%)
- FIGURE 25. OSTEOSYNTHESIS DEVICES MARKET BY REGION, 2021
- FIGURE 26. U.S. OSTEOSYNTHESIS DEVICES MARKET, 2021-2031 ($MILLION)
- FIGURE 27. CANADA OSTEOSYNTHESIS DEVICES MARKET, 2021-2031 ($MILLION)
- FIGURE 28. MEXICO OSTEOSYNTHESIS DEVICES MARKET, 2021-2031 ($MILLION)
- FIGURE 29. GERMANY OSTEOSYNTHESIS DEVICES MARKET, 2021-2031 ($MILLION)
- FIGURE 30. FRANCE OSTEOSYNTHESIS DEVICES MARKET, 2021-2031 ($MILLION)
- FIGURE 31. UK OSTEOSYNTHESIS DEVICES MARKET, 2021-2031 ($MILLION)
- FIGURE 32. ITALY OSTEOSYNTHESIS DEVICES MARKET, 2021-2031 ($MILLION)
- FIGURE 33. SPAIN OSTEOSYNTHESIS DEVICES MARKET, 2021-2031 ($MILLION)
- FIGURE 34. REST OF EUROPE OSTEOSYNTHESIS DEVICES MARKET, 2021-2031 ($MILLION)
- FIGURE 35. JAPAN OSTEOSYNTHESIS DEVICES MARKET, 2021-2031 ($MILLION)
- FIGURE 36. CHINA OSTEOSYNTHESIS DEVICES MARKET, 2021-2031 ($MILLION)
- FIGURE 37. AUSTRALIA OSTEOSYNTHESIS DEVICES MARKET, 2021-2031 ($MILLION)
- FIGURE 38. INDIA OSTEOSYNTHESIS DEVICES MARKET, 2021-2031 ($MILLION)
- FIGURE 39. SOUTH KOREA OSTEOSYNTHESIS DEVICES MARKET, 2021-2031 ($MILLION)
- FIGURE 40. REST OF ASIA-PACIFIC OSTEOSYNTHESIS DEVICES MARKET, 2021-2031 ($MILLION)
- FIGURE 41. BRAZIL OSTEOSYNTHESIS DEVICES MARKET, 2021-2031 ($MILLION)
- FIGURE 42. SAUDI ARABIA OSTEOSYNTHESIS DEVICES MARKET, 2021-2031 ($MILLION)
- FIGURE 43. SOUTH AFRICA OSTEOSYNTHESIS DEVICES MARKET, 2021-2031 ($MILLION)
- FIGURE 44. REST OF LAMEA OSTEOSYNTHESIS DEVICES MARKET, 2021-2031 ($MILLION)
- FIGURE 45. TOP WINNING STRATEGIES, BY YEAR
- FIGURE 46. TOP WINNING STRATEGIES, BY DEVELOPMENT
- FIGURE 47. TOP WINNING STRATEGIES, BY COMPANY
- FIGURE 48. PRODUCT MAPPING OF TOP 10 PLAYERS
- FIGURE 49. COMPETITIVE DASHBOARD
- FIGURE 50. COMPETITIVE HEATMAP: OSTEOSYNTHESIS DEVICES MARKET
- FIGURE 51. TOP PLAYER POSITIONING, 2021
- FIGURE 52. GLOBUS MEDICAL, INC.: NET SALES, 2019-2021 ($MILLION)
- FIGURE 53. GLOBUS MEDICAL, INC.: REVENUE SHARE BY SEGMENT, 2021 (%)
- FIGURE 54. GLOBUS MEDICAL, INC.: REVENUE SHARE BY REGION, 2021 (%)
- FIGURE 55. JOHNSON & JOHNSON: NET REVENUE, 2019-2021 ($MILLION)
- FIGURE 56. JOHNSON & JOHNSON: REVENUE SHARE BY SEGMENT, 2021 (%)
- FIGURE 57. JOHNSON & JOHNSON: REVENUE SHARE BY REGION, 2021 (%)
- FIGURE 58. STRYKER CORPORATION: NET REVENUE, 2019-2021 ($MILLION)
- FIGURE 59. STRYKER CORPORATION: REVENUE SHARE BY SEGMENT, 2021 (%)
- FIGURE 60. STRYKER CORPORATION: REVENUE SHARE BY REGION, 2021 (%)
- FIGURE 61. ZIMMER BIOMET HOLDING INC.: NET SALES, 2019-2021 ($MILLION)
- FIGURE 62. ZIMMER BIOMET HOLDING INC.: REVENUE SHARE BY REGION, 2021 (%)
- FIGURE 63. ZIMMER BIOMET HOLDING INC.: REVENUE SHARE BY SEGMENT, 2021 (%)
- FIGURE 64. MEDTRONIC PLC: NET SALES, 2020-2022 ($MILLION)
- FIGURE 65. MEDTRONIC PLC: REVENUE SHARE BY SEGMENT, 2022 (%)
- FIGURE 66. MEDTRONIC PLC: REVENUE SHARE BY REGION, 2022 (%)
- FIGURE 67. SMITH & NEPHEW PLC: NET REVENUE, 2019-2021 ($MILLION)
- FIGURE 68. SMITH & NEPHEW PLC: REVENUE SHARE BY SEGMENT, 2021 (%)
- FIGURE 69. SMITH & NEPHEW PLC: REVENUE SHARE BY REGION, 2021 (%)
The Osteosynthesis Devices Market was valued at $9,061.20 million in 2021 and is estimated to reach $14,214.92 million by 2031, exhibiting a CAGR of 4.6% from 2022 to 2031. Osteosynthesis devices are medical implants used to stabilize or fuse bones that have been fractured or damaged. The goal of osteosynthesis is to achieve rapid healing and restoration of normal bone function. There are different types of osteosynthesis devices, including plates, screws, pins, and intramedullary nails, which can be used alone or in combination to stabilize the bones. These devices are usually made of metal, such as stainless steel or titanium, and are designed to be strong, durable, and biocompatible. In addition to stabilizing the bones, osteosynthesis devices may also be used to correct deformities or to provide support during the healing process. The specific type of device used depends on the location and nature of the fracture, as well as the age, medical history, and other factors of the patient.
Major factors that drive the growth of the market include a rise in technological advancement in osteosynthesis devices, a rise in the prevalence of orthopedic disorders such as osteoarthritis and osteoporosis that are more prone to fracture, as well a rise in the awareness of the potential benefits of orthopedic implants drives the growth of the osteosynthesis devices market. For instance, according to Verywell Health and National Centre for biotechnology information (NCBI), in 2020, about 1.5 million people in the U.S. were living with rheumatoid arthritis. According to National Centre for biotechnology information (NCBI), in 2022, 294,000 children in the U.S. were suffering from juvenile idiopathic arthritis. By 2025, 67 million Americans are expected to be diagnosed with arthritis.
Furthermore, the rise in the adoption of osteosynthesis devices, and the rise in the number of accidents & sports injuries that causes fracture has led to an increase in demand for osteosynthesis devices such as screws & plates, external fracture fixation devices, which further boost the growth of the osteosynthesis devices market. For instance, a report published by the National Safety Council of the U.S. in 2022 stated that in 2021, 20% rise in sports and recreational injuries was observed as compared to 2020, thus a rise in the number of sport-related injuries is expected to drive the growth of the market.
However, the high costs of osteosynthesis devices, health risks and complications associated with osteosynthesis devices are expected to hamper the osteosynthesis devices market growth. On the contrary, unmet medical demands in developing countries and lucrative opportunities in emerging economies are expected to create immense opportunities for osteosynthesis device product manufacturers in the future.
The osteosynthesis devices market is segmented on the basis of device type, fracture type, end user, and region. On the basis of device type, the market is classified into internal fixation devices and external fixation devices. The internal fixation device segment is further divided into screws & plates, wires & pins, intramedullary rods & nails, and spinal fixation devices. The external fixation device segment is further divided into fracture fixation devices and bone lengthening devices. On the basis of fracture type, the market is classified into hip, knee, spine, shoulder, foot & ankle, facial bones, and others. On the basis of end users, the market is classified into hospitals, orthopedic clinics, and ambulatory surgical centers.
Region-wise, the market is analyzed across North America (the U.S., Canada, and Mexico), Europe (Germany, France, the UK, Italy, Spain, and the rest of Europe), Asia-Pacific (China, Japan, Australia, India, South Korea, and rest of Asia-Pacific), and LAMEA (Brazil, South Africa, Saudi Arabia, and rest of LAMEA).
Major players profiled in the report are: Arthrex, Inc., Johnson & Johnson (DePuy Synthes, Inc.), Globus Medical, Inc., GS Solutions, Inc., Life Spine, Inc., Medtronic plc, Precision Spine, Inc, Smith & Nephew, Stryker Corporation, and Zimmer Biomet Inc.
Key Benefits For Stakeholders
- This report provides a quantitative analysis of the market segments, current trends, estimations, and dynamics of the osteosynthesis devices market analysis from 2021 to 2031 to identify the prevailing osteosynthesis devices market opportunities.
- The market research is offered along with information related to key drivers, restraints, and opportunities.
- Porter's five forces analysis highlights the potency of buyers and suppliers to enable stakeholders to make profit-oriented business decisions and strengthen their supplier-buyer network.
- In-depth analysis of the osteosynthesis devices market segmentation assists to determine the prevailing market opportunities.
- Major countries in each region are mapped according to their revenue contribution to the global market.
- Market player positioning facilitates benchmarking and provides a clear understanding of the present position of the market players.
- The report includes the analysis of the regional as well as global osteosynthesis devices market trends, key players, market segments, application areas, and market growth strategies.
Key Market Segments
By Device Type
- External Fixation Devices
- Type
- Fracture Fixation Devices
- Bone Lengthening Devices
- Internal Fixation Devices
- Type
- Screws and Plates
- Wires and Pins
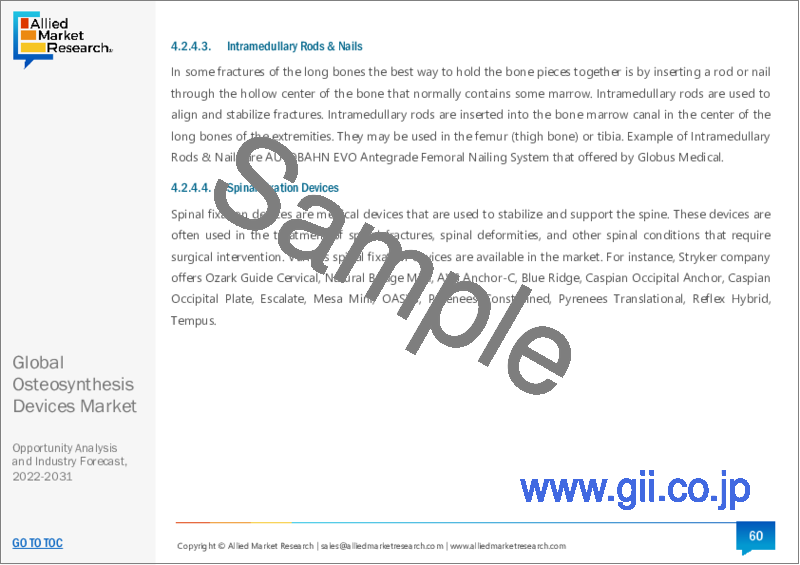
- Intramedullary Rods and Nails
- Spinal Fixation Devices
By Fracture Type
- Hip Fracture
- Knee Fracture
- Spine Fracture
- Shoulder Fracture
- Foot and Ankle Fracture
- Facial bones Fracture
- Others
By End User
- Hospitals
- Orthopaedic Clinics
- Ambulatory surgical Centers
By Region
- North America
- U.S.
- Canada
- Mexico
- Europe
- Germany
- France
- UK
- Italy
- Spain
- Rest of Europe
- Asia-Pacific
- Japan
- China
- Australia
- India
- South Korea
- Rest of Asia-Pacific
- LAMEA
- Brazil
- Saudi Arabia
- South Africa
- Rest of LAMEA
Key Market Players
- Arthrex, Inc.
- Globus Medical, Inc.
- Johnson & Johnson
- Stryker Corporation
- Life Spine, Inc.
- Precision Spine, Inc.
- GS Solutions, Inc.
- Medtronic plc
- Smith & Nephew plc
- Zimmer Biomet Holding Inc.
TABLE OF CONTENTS
CHAPTER 1: INTRODUCTION
- 1.1. Report description
- 1.2. Key market segments
- 1.3. Key benefits to the stakeholders
- 1.4. Research Methodology
- 1.4.1. Primary research
- 1.4.2. Secondary research
- 1.4.3. Analyst tools and models
CHAPTER 2: EXECUTIVE SUMMARY
- 2.1. CXO Perspective
CHAPTER 3: MARKET OVERVIEW
- 3.1. Market definition and scope
- 3.2. Key findings
- 3.2.1. Top impacting factors
- 3.2.2. Top investment pockets
- 3.3. Porter's five forces analysis
- 3.3.1. Bargaining power of suppliers
- 3.3.2. Bargaining power of buyers
- 3.3.3. Threat of substitutes
- 3.3.4. Threat of new entrants
- 3.3.5. Intensity of rivalry
- 3.4. Market dynamics
- 3.4.1. Drivers
- 3.4.1.1. Rise in prevalence of orthopedic disorders
- 3.4.1.2. Rise in number of accidents & sports injuries
- 3.4.1.3. Rise in geriatric population
- 3.4.2. Restraints
- 3.4.2.1. Complications associated with osteosynthesis devices.
- 3.4.3. Opportunities
- 3.4.3.1. Launch of novel osteosynthesis devices
- 3.4.1. Drivers
- 3.5. COVID-19 Impact Analysis on the market
CHAPTER 4: OSTEOSYNTHESIS DEVICES MARKET, BY DEVICE TYPE
- 4.1. Overview
- 4.1.1. Market size and forecast
- 4.2. Internal Fixation Devices
- 4.2.1. Key market trends, growth factors and opportunities
- 4.2.2. Market size and forecast, by region
- 4.2.3. Market share analysis by country
- 4.2.4. Internal Fixation Devices Osteosynthesis Devices Market by Type
- 4.3. External Fixation Devices
- 4.3.1. Key market trends, growth factors and opportunities
- 4.3.2. Market size and forecast, by region
- 4.3.3. Market share analysis by country
- 4.3.4. External Fixation Devices Osteosynthesis Devices Market by Type
CHAPTER 5: OSTEOSYNTHESIS DEVICES MARKET, BY FRACTURE TYPE
- 5.1. Overview
- 5.1.1. Market size and forecast
- 5.2. Hip Fracture
- 5.2.1. Key market trends, growth factors and opportunities
- 5.2.2. Market size and forecast, by region
- 5.2.3. Market share analysis by country
- 5.3. Knee Fracture
- 5.3.1. Key market trends, growth factors and opportunities
- 5.3.2. Market size and forecast, by region
- 5.3.3. Market share analysis by country
- 5.4. Spine Fracture
- 5.4.1. Key market trends, growth factors and opportunities
- 5.4.2. Market size and forecast, by region
- 5.4.3. Market share analysis by country
- 5.5. Shoulder Fracture
- 5.5.1. Key market trends, growth factors and opportunities
- 5.5.2. Market size and forecast, by region
- 5.5.3. Market share analysis by country
- 5.6. Foot and Ankle Fracture
- 5.6.1. Key market trends, growth factors and opportunities
- 5.6.2. Market size and forecast, by region
- 5.6.3. Market share analysis by country
- 5.7. Facial bones Fracture
- 5.7.1. Key market trends, growth factors and opportunities
- 5.7.2. Market size and forecast, by region
- 5.7.3. Market share analysis by country
- 5.8. Others
- 5.8.1. Key market trends, growth factors and opportunities
- 5.8.2. Market size and forecast, by region
- 5.8.3. Market share analysis by country
CHAPTER 6: OSTEOSYNTHESIS DEVICES MARKET, BY END USER
- 6.1. Overview
- 6.1.1. Market size and forecast
- 6.2. Hospitals
- 6.2.1. Key market trends, growth factors and opportunities
- 6.2.2. Market size and forecast, by region
- 6.2.3. Market share analysis by country
- 6.3. Orthopaedic Clinics
- 6.3.1. Key market trends, growth factors and opportunities
- 6.3.2. Market size and forecast, by region
- 6.3.3. Market share analysis by country
- 6.4. Ambulatory surgical Centers
- 6.4.1. Key market trends, growth factors and opportunities
- 6.4.2. Market size and forecast, by region
- 6.4.3. Market share analysis by country
CHAPTER 7: OSTEOSYNTHESIS DEVICES MARKET, BY REGION
- 7.1. Overview
- 7.1.1. Market size and forecast By Region
- 7.2. North America
- 7.2.1. Key trends and opportunities
- 7.2.2. Market size and forecast, by Device Type
- 7.2.3. Market size and forecast, by Fracture Type
- 7.2.4. Market size and forecast, by End User
- 7.2.5. Market size and forecast, by country
- 7.2.5.1. U.S.
- 7.2.5.1.1. Key market trends, growth factors and opportunities
- 7.2.5.1.2. Market size and forecast, by Device Type
- 7.2.5.1.3. Market size and forecast, by Fracture Type
- 7.2.5.1.4. Market size and forecast, by End User
- 7.2.5.2. Canada
- 7.2.5.2.1. Key market trends, growth factors and opportunities
- 7.2.5.2.2. Market size and forecast, by Device Type
- 7.2.5.2.3. Market size and forecast, by Fracture Type
- 7.2.5.2.4. Market size and forecast, by End User
- 7.2.5.3. Mexico
- 7.2.5.3.1. Key market trends, growth factors and opportunities
- 7.2.5.3.2. Market size and forecast, by Device Type
- 7.2.5.3.3. Market size and forecast, by Fracture Type
- 7.2.5.3.4. Market size and forecast, by End User
- 7.3. Europe
- 7.3.1. Key trends and opportunities
- 7.3.2. Market size and forecast, by Device Type
- 7.3.3. Market size and forecast, by Fracture Type
- 7.3.4. Market size and forecast, by End User
- 7.3.5. Market size and forecast, by country
- 7.3.5.1. Germany
- 7.3.5.1.1. Key market trends, growth factors and opportunities
- 7.3.5.1.2. Market size and forecast, by Device Type
- 7.3.5.1.3. Market size and forecast, by Fracture Type
- 7.3.5.1.4. Market size and forecast, by End User
- 7.3.5.2. France
- 7.3.5.2.1. Key market trends, growth factors and opportunities
- 7.3.5.2.2. Market size and forecast, by Device Type
- 7.3.5.2.3. Market size and forecast, by Fracture Type
- 7.3.5.2.4. Market size and forecast, by End User
- 7.3.5.3. UK
- 7.3.5.3.1. Key market trends, growth factors and opportunities
- 7.3.5.3.2. Market size and forecast, by Device Type
- 7.3.5.3.3. Market size and forecast, by Fracture Type
- 7.3.5.3.4. Market size and forecast, by End User
- 7.3.5.4. Italy
- 7.3.5.4.1. Key market trends, growth factors and opportunities
- 7.3.5.4.2. Market size and forecast, by Device Type
- 7.3.5.4.3. Market size and forecast, by Fracture Type
- 7.3.5.4.4. Market size and forecast, by End User
- 7.3.5.5. Spain
- 7.3.5.5.1. Key market trends, growth factors and opportunities
- 7.3.5.5.2. Market size and forecast, by Device Type
- 7.3.5.5.3. Market size and forecast, by Fracture Type
- 7.3.5.5.4. Market size and forecast, by End User
- 7.3.5.6. Rest of Europe
- 7.3.5.6.1. Key market trends, growth factors and opportunities
- 7.3.5.6.2. Market size and forecast, by Device Type
- 7.3.5.6.3. Market size and forecast, by Fracture Type
- 7.3.5.6.4. Market size and forecast, by End User
- 7.4. Asia-Pacific
- 7.4.1. Key trends and opportunities
- 7.4.2. Market size and forecast, by Device Type
- 7.4.3. Market size and forecast, by Fracture Type
- 7.4.4. Market size and forecast, by End User
- 7.4.5. Market size and forecast, by country
- 7.4.5.1. Japan
- 7.4.5.1.1. Key market trends, growth factors and opportunities
- 7.4.5.1.2. Market size and forecast, by Device Type
- 7.4.5.1.3. Market size and forecast, by Fracture Type
- 7.4.5.1.4. Market size and forecast, by End User
- 7.4.5.2. China
- 7.4.5.2.1. Key market trends, growth factors and opportunities
- 7.4.5.2.2. Market size and forecast, by Device Type
- 7.4.5.2.3. Market size and forecast, by Fracture Type
- 7.4.5.2.4. Market size and forecast, by End User
- 7.4.5.3. Australia
- 7.4.5.3.1. Key market trends, growth factors and opportunities
- 7.4.5.3.2. Market size and forecast, by Device Type
- 7.4.5.3.3. Market size and forecast, by Fracture Type
- 7.4.5.3.4. Market size and forecast, by End User
- 7.4.5.4. India
- 7.4.5.4.1. Key market trends, growth factors and opportunities
- 7.4.5.4.2. Market size and forecast, by Device Type
- 7.4.5.4.3. Market size and forecast, by Fracture Type
- 7.4.5.4.4. Market size and forecast, by End User
- 7.4.5.5. South Korea
- 7.4.5.5.1. Key market trends, growth factors and opportunities
- 7.4.5.5.2. Market size and forecast, by Device Type
- 7.4.5.5.3. Market size and forecast, by Fracture Type
- 7.4.5.5.4. Market size and forecast, by End User
- 7.4.5.6. Rest of Asia-Pacific
- 7.4.5.6.1. Key market trends, growth factors and opportunities
- 7.4.5.6.2. Market size and forecast, by Device Type
- 7.4.5.6.3. Market size and forecast, by Fracture Type
- 7.4.5.6.4. Market size and forecast, by End User
- 7.5. LAMEA
- 7.5.1. Key trends and opportunities
- 7.5.2. Market size and forecast, by Device Type
- 7.5.3. Market size and forecast, by Fracture Type
- 7.5.4. Market size and forecast, by End User
- 7.5.5. Market size and forecast, by country
- 7.5.5.1. Brazil
- 7.5.5.1.1. Key market trends, growth factors and opportunities
- 7.5.5.1.2. Market size and forecast, by Device Type
- 7.5.5.1.3. Market size and forecast, by Fracture Type
- 7.5.5.1.4. Market size and forecast, by End User
- 7.5.5.2. Saudi Arabia
- 7.5.5.2.1. Key market trends, growth factors and opportunities
- 7.5.5.2.2. Market size and forecast, by Device Type
- 7.5.5.2.3. Market size and forecast, by Fracture Type
- 7.5.5.2.4. Market size and forecast, by End User
- 7.5.5.3. South Africa
- 7.5.5.3.1. Key market trends, growth factors and opportunities
- 7.5.5.3.2. Market size and forecast, by Device Type
- 7.5.5.3.3. Market size and forecast, by Fracture Type
- 7.5.5.3.4. Market size and forecast, by End User
- 7.5.5.4. Rest of LAMEA
- 7.5.5.4.1. Key market trends, growth factors and opportunities
- 7.5.5.4.2. Market size and forecast, by Device Type
- 7.5.5.4.3. Market size and forecast, by Fracture Type
- 7.5.5.4.4. Market size and forecast, by End User
CHAPTER 8: COMPETITIVE LANDSCAPE
- 8.1. Introduction
- 8.2. Top winning strategies
- 8.3. Product Mapping of Top 10 Player
- 8.4. Competitive Dashboard
- 8.5. Competitive Heatmap
- 8.6. Top player positioning, 2021
CHAPTER 9: COMPANY PROFILES
- 9.1. Arthrex, Inc.
- 9.1.1. Company overview
- 9.1.2. Key Executives
- 9.1.3. Company snapshot
- 9.1.4. Operating business segments
- 9.1.5. Product portfolio
- 9.2. Globus Medical, Inc.
- 9.2.1. Company overview
- 9.2.2. Key Executives
- 9.2.3. Company snapshot
- 9.2.4. Operating business segments
- 9.2.5. Product portfolio
- 9.2.6. Business performance
- 9.2.7. Key strategic moves and developments
- 9.3. GS Solutions, Inc.
- 9.3.1. Company overview
- 9.3.2. Key Executives
- 9.3.3. Company snapshot
- 9.3.4. Operating business segments
- 9.3.5. Product portfolio
- 9.4. Johnson & Johnson
- 9.4.1. Company overview
- 9.4.2. Key Executives
- 9.4.3. Company snapshot
- 9.4.4. Operating business segments
- 9.4.5. Product portfolio
- 9.4.6. Business performance
- 9.4.7. Key strategic moves and developments
- 9.5. Life Spine, Inc.
- 9.5.1. Company overview
- 9.5.2. Key Executives
- 9.5.3. Company snapshot
- 9.5.4. Operating business segments
- 9.5.5. Product portfolio
- 9.5.6. Key strategic moves and developments
- 9.6. Precision Spine, Inc.
- 9.6.1. Company overview
- 9.6.2. Key Executives
- 9.6.3. Company snapshot
- 9.6.4. Operating business segments
- 9.6.5. Product portfolio
- 9.6.6. Key strategic moves and developments
- 9.7. Stryker Corporation
- 9.7.1. Company overview
- 9.7.2. Key Executives
- 9.7.3. Company snapshot
- 9.7.4. Operating business segments
- 9.7.5. Product portfolio
- 9.7.6. Business performance
- 9.8. Zimmer Biomet Holding Inc.
- 9.8.1. Company overview
- 9.8.2. Key Executives
- 9.8.3. Company snapshot
- 9.8.4. Operating business segments
- 9.8.5. Product portfolio
- 9.8.6. Business performance
- 9.9. Medtronic plc
- 9.9.1. Company overview
- 9.9.2. Key Executives
- 9.9.3. Company snapshot
- 9.9.4. Operating business segments
- 9.9.5. Product portfolio
- 9.9.6. Business performance
- 9.9.7. Key strategic moves and developments
- 9.10. Smith & Nephew plc
- 9.10.1. Company overview
- 9.10.2. Key Executives
- 9.10.3. Company snapshot
- 9.10.4. Operating business segments
- 9.10.5. Product portfolio
- 9.10.6. Business performance