|
|
市場調査レポート
商品コード
1239453
蛍光塗料市場:タイプ別、用途別:世界の機会分析と産業予測、2021-2031年Fluorescent Paint Market By Type, By Application : Global Opportunity Analysis and Industry Forecast, 2021-2031 |
||||||
|
|
|||||||


| 蛍光塗料市場:タイプ別、用途別:世界の機会分析と産業予測、2021-2031年 |
|
出版日: 2023年01月01日
発行: Allied Market Research
ページ情報: 英文 420 Pages
納期: 2~3営業日
|
- 全表示
- 概要
- 図表
- 目次
蛍光塗料市場は、2021年に3億5,730万米ドルに達し、2022年から2031年にかけてCAGR6.8%で成長し、2031年には6億7,790万米ドルに達すると予測されています。
蛍光塗料は、光に当たると可視光線または着色された光を発する塗料の一種です。蛍光塗料は、塗料やコーティング剤、プラスチック、布地、紙製品、革製品などに利用されています。紫外線や青色光を吸収し、波長(色)の異なる可視光線として再放出する蛍光塗料の2つの成分から構成されています。このような塗料は、外部からの光源を必要とせず、発光することができます。
蛍光塗料は、可視・非可視の電磁波を吸収し、吸収したエネルギーを必要な波長で速やかに放出することができる塗料を指します。この塗料に期待される波長の光を照射すると、非常に特殊な色合いを放つようになります。蛍光塗料は、塗料やコーティング液、インク、繊維製品など、さまざまな用途に利用されています。蛍光塗料には、有機系と無機系の2種類があり、それぞれ由来が異なります。有機蛍光塗料は天然および合成の基礎物質から作られ、無機蛍光塗料は様々な金属酸化物を組み合わせて合成されます。どちらも粉末やディスパージョンの形で市販されており、エンドユーザー業界の要求に合わせて処方されます。
光学的白色化剤とは、紙が本来持っている白色度を高めるために製紙業界で使用される化学物質です。紫外線や紫色の光(通常340~370nm)を吸収した後、青色の光(通常420~470nm)を放出する化合物です。紙のほか、プラスチック、繊維、洗濯用洗剤などに利用されています。蛍光増白剤、人工白色剤とも呼ばれます。ドライエンド、ウェットエンド、または両方のエンドで、光学的な白色化剤を使用することができます。光学的または蛍光性の光沢剤は内部明るさを得るために在庫のぬれた端に含まれていなければなりません。製紙会社は通常、サイズプレスやカレンダースタックのドライエンドを表面コーティングするために蛍光増白剤を使用します。ドライエンド処理は、ドライエンドで紫外線を反射させるために、薬剤を繊維の内部ではなく外部に噴霧するため、ウェットエンド処理よりもコストがかかりません。しかし、メーカーによっては、ウェットエンドとドライエンドの両方を一緒に処理する場合もあります。したがって、塗工紙や非塗工紙産業における蛍光増白剤の幅広い適用と使用は、蛍光塗料市場を促進すると予想されます。
蛍光塗料は、劇場用照明、塗料、その他の照明用途に使用されます。蛍光塗料の高価な原材料は、世界の蛍光塗料市場における大きな障害となっています。硫化亜鉛または亜鉛の価格は、旺盛な市場需要により上昇しています。国際通貨基金の分析では、亜鉛価格は2021年の1トン当たり2,828ドルから2022年には2,859ドルに上昇すると予測されています。また、国際鉛・亜鉛研究会(ILZSG)は、2022年までに世界の精製亜鉛の需要が1,441万トンに増加すると予測しています。また、蛍光塗料の原料である二酸化チタンについては、政府による厳しい制限があり、蛍光塗料市場の拡大を阻害すると予想されます。2020年2月、EUはCLP基準で二酸化チタンを発がん性物質に指定しました。このように、原材料に対する厳しい環境規制が蛍光塗料産業の拡大を阻害しています。
インク、ワニス、マーキング、標識における蛍光塗料の使用は、航空宇宙および防衛用途を拡大しています。蛍光塗料は航空会社に鮮やかな色、反射、明るさを提供します。低照度や夜間の運航時にテールローターの視認性を向上させるために、航空会社は蓄光塗料を塗布しています。また、蛍光塗料は、日中は光を吸収し、低照度や夜間では可視光線を放出するため、航空機に採用されています。パンデミック後の航空会社の運航や生産の増加も、輝度顔料市場を後押ししています。航空宇宙産業協会(AIA)によると、航空宇宙・防衛産業の売上収入は2019年に9090億米ドルに達し、前年比6.7%増となっています。このように、航空宇宙・軍需産業の拡大が蛍光塗料市場を牽引し、世界展開に多大な機会をもたらしています。
目次
第1章 イントロダクション
第2章 エグゼクティブサマリー
第3章 市場概要
- 市場の定義と範囲
- 主な調査結果
- 主な影響要因
- 主な投資ポケット
- ポーターのファイブフォース分析
- 供給企業の交渉力
- 買い手の交渉力
- 代替品の脅威
- 新規参入業者の脅威
- ライバル意識の低さ
- 市場力学
- 促進要因
- 建築および建設業界からの需要の増加
- コート紙および非コート紙業界での蛍光増白剤の使用の増加
- 抑制要因
- 原材料費の高騰と環境規制
- 機会
- 航空宇宙および防衛産業での使用の増加
- 促進要因
- 市場におけるCOVID-19影響分析
- 市場シェア分析
- 特許情勢
- 価格分析
- バリューチェーン分析
第4章 蛍光塗料市場:タイプ別
- 概要
- 市場規模と予測
- 無機蛍光
- 主要な市場動向、成長要因と機会
- 市場規模と予測:地域別
- 市場シェア分析: 国別
- 蛍光増白剤
- 主要な市場動向、成長要因と機会
- 市場規模と予測:地域別
- 市場シェア分析: 国別
- 昼光蛍光灯
- 主要な市場動向、成長要因と機会
- 市場規模と予測:地域別
- 市場シェア分析: 国別
第5章 蛍光塗料市場:用途別
- 概要
- 市場規模と予測
- 安全装置
- 主要な市場動向、成長要因と機会
- 市場規模と予測:地域別
- 市場シェア分析: 国別
- 商業ビル
- 主要な市場動向、成長要因と機会
- 市場規模と予測:地域別
- 市場シェア分析: 国別
- 道路境界標示
- 主要な市場動向、成長要因と機会
- 市場規模と予測:地域別
- 市場シェア分析: 国別
- 設備
- 主要な市場動向、成長要因と機会
- 市場規模と予測:地域別
- 市場シェア分析: 国別
- その他
- 主要な市場動向、成長要因と機会
- 市場規模と予測:地域別
- 市場シェア分析: 国別
第6章 蛍光塗料市場:地域別
- 概要
- 市場規模と予測:地域別
- 北米
- 主な動向と機会
- 市場規模と予測:タイプ別
- 市場規模と予測:用途別
- 市場規模と予測:国別
- 米国
- 主要な市場動向、成長要因と機会
- 市場規模と予測:タイプ別
- 市場規模と予測:用途別
- カナダ
- 主要な市場動向、成長要因と機会
- 市場規模と予測:タイプ別
- 市場規模と予測:用途別
- メキシコ
- 主要な市場動向、成長要因と機会
- 市場規模と予測:タイプ別
- 市場規模と予測:用途別
- 欧州
- 主な動向と機会
- 市場規模と予測:タイプ別
- 市場規模と予測:用途別
- 市場規模と予測:国別
- ドイツ
- 主要な市場動向、成長要因と機会
- 市場規模と予測:タイプ別
- 市場規模と予測:用途別
- フランス
- 主要な市場動向、成長要因と機会
- 市場規模と予測:タイプ別
- 市場規模と予測:用途別
- イタリア
- 主要な市場動向、成長要因と機会
- 市場規模と予測:タイプ別
- 市場規模と予測:用途別
- 英国
- 主要な市場動向、成長要因と機会
- 市場規模と予測:タイプ別
- 市場規模と予測:用途別
- スペイン
- 主要な市場動向、成長要因と機会
- 市場規模と予測:タイプ別
- 市場規模と予測:用途別
- その他欧州
- 主要な市場動向、成長要因と機会
- 市場規模と予測:タイプ別
- 市場規模と予測:用途別
- アジア太平洋
- 主な動向と機会
- 市場規模と予測:タイプ別
- 市場規模と予測:用途別
- 市場規模と予測:国別
- 中国
- 主要な市場動向、成長要因と機会
- 市場規模と予測:タイプ別
- 市場規模と予測:用途別
- インド
- 主要な市場動向、成長要因と機会
- 市場規模と予測:タイプ別
- 市場規模と予測:用途別
- 日本
- 主要な市場動向、成長要因と機会
- 市場規模と予測:タイプ別
- 市場規模と予測:用途別
- 韓国
- 主要な市場動向、成長要因と機会
- 市場規模と予測:タイプ別
- 市場規模と予測:用途別
- オーストラリア
- 主要な市場動向、成長要因と機会
- 市場規模と予測:タイプ別
- 市場規模と予測:用途別
- その他アジア太平洋地域
- 主要な市場動向、成長要因と機会
- 市場規模と予測:タイプ別
- 市場規模と予測:用途別
- ラテンアメリカ・中東・アフリカ
- 主な動向と機会
- 市場規模と予測:タイプ別
- 市場規模と予測:用途別
- 市場規模と予測:国別
- ブラジル
- 主要な市場動向、成長要因と機会
- 市場規模と予測:タイプ別
- 市場規模と予測:用途別
- サウジアラビア
- 主要な市場動向、成長要因と機会
- 市場規模と予測:タイプ別
- 市場規模と予測:用途別
- 南アフリカ
- 主要な市場動向、成長要因と機会
- 市場規模と予測:タイプ別
- 市場規模と予測:用途別
- その他のラテンアメリカ・中東・アフリカ
- 主要な市場動向、成長要因と機会
- 市場規模と予測:タイプ別
- 市場規模と予測:用途別
第7章 競合情勢
- イントロダクション
- 主要成功戦略
- トップ 10プレーヤーの製品マッピング
- 競合ダッシュボード
- 競合ヒートマップ
- トッププレーヤーのポジショニング、2021
第8章 企業プロファイル
- Radiant Color N.V.
- LuminoChem
- Aron Universal Limited
- Ronan Paints
- Glow Paint Industries
- GLOWTEC LTD
- Krylon Products Group
- DayGlo Color Corp
- Brilliant Group, Inc.
- Vicome Corp.
LIST OF TABLES
- TABLE 01. GLOBAL FLUORESCENT PAINT MARKET, BY TYPE, 2021-2031 (REVENUE, $MILLION)
- TABLE 02. GLOBAL FLUORESCENT PAINT MARKET, BY TYPE, 2021-2031 (VOLUME, KILOLITRES)
- TABLE 03. FLUORESCENT PAINT MARKET FOR INORGANIC FLUORESCENTS, BY REGION, 2021-2031 (REVENUE, $MILLION)
- TABLE 04. FLUORESCENT PAINT MARKET FOR INORGANIC FLUORESCENTS, BY REGION, 2021-2031 (VOLUME, KILOLITRES)
- TABLE 05. FLUORESCENT PAINT MARKET FOR OPTICAL WHITENERS, BY REGION, 2021-2031 (REVENUE, $MILLION)
- TABLE 06. FLUORESCENT PAINT MARKET FOR OPTICAL WHITENERS, BY REGION, 2021-2031 (VOLUME, KILOLITRES)
- TABLE 07. FLUORESCENT PAINT MARKET FOR DAYLIGHT FLUORESCENTS, BY REGION, 2021-2031 (REVENUE, $MILLION)
- TABLE 08. FLUORESCENT PAINT MARKET FOR DAYLIGHT FLUORESCENTS, BY REGION, 2021-2031 (VOLUME, KILOLITRES)
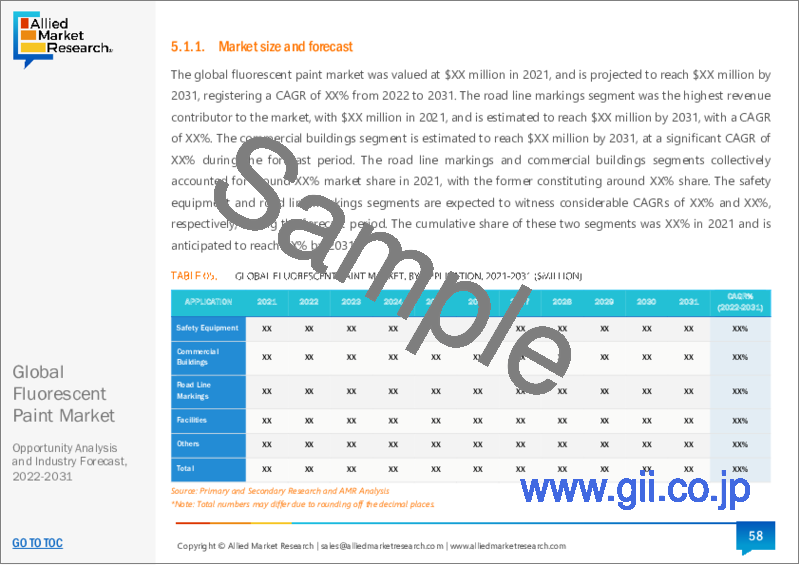
- TABLE 09. GLOBAL FLUORESCENT PAINT MARKET, BY APPLICATION, 2021-2031 (REVENUE, $MILLION)
- TABLE 10. GLOBAL FLUORESCENT PAINT MARKET, BY APPLICATION, 2021-2031 (VOLUME, KILOLITRES)
- TABLE 11. FLUORESCENT PAINT MARKET FOR SAFETY EQUIPMENT, BY REGION, 2021-2031 (REVENUE, $MILLION)
- TABLE 12. FLUORESCENT PAINT MARKET FOR SAFETY EQUIPMENT, BY REGION, 2021-2031 (VOLUME, KILOLITRES)
- TABLE 13. FLUORESCENT PAINT MARKET FOR COMMERCIAL BUILDINGS, BY REGION, 2021-2031 (REVENUE, $MILLION)
- TABLE 14. FLUORESCENT PAINT MARKET FOR COMMERCIAL BUILDINGS, BY REGION, 2021-2031 (VOLUME, KILOLITRES)
- TABLE 15. FLUORESCENT PAINT MARKET FOR ROAD LINE MARKINGS, BY REGION, 2021-2031 (REVENUE, $MILLION)
- TABLE 16. FLUORESCENT PAINT MARKET FOR ROAD LINE MARKINGS, BY REGION, 2021-2031 (VOLUME, KILOLITRES)
- TABLE 17. FLUORESCENT PAINT MARKET FOR FACILITIES, BY REGION, 2021-2031 (REVENUE, $MILLION)
- TABLE 18. FLUORESCENT PAINT MARKET FOR FACILITIES, BY REGION, 2021-2031 (VOLUME, KILOLITRES)
- TABLE 19. FLUORESCENT PAINT MARKET FOR OTHERS, BY REGION, 2021-2031 (REVENUE, $MILLION)
- TABLE 20. FLUORESCENT PAINT MARKET FOR OTHERS, BY REGION, 2021-2031 (VOLUME, KILOLITRES)
- TABLE 21. FLUORESCENT PAINT MARKET, BY REGION, 2021-2031 (REVENUE, $MILLION)
- TABLE 22. FLUORESCENT PAINT MARKET, BY REGION, 2021-2031 (VOLUME, KILOLITRES)
- TABLE 23. NORTH AMERICA FLUORESCENT PAINT MARKET, BY TYPE, 2021-2031 (REVENUE, $MILLION)
- TABLE 24. NORTH AMERICA FLUORESCENT PAINT MARKET, BY TYPE, 2021-2031 (VOLUME, KILOLITRES)
- TABLE 25. NORTH AMERICA FLUORESCENT PAINT MARKET, BY APPLICATION, 2021-2031 (REVENUE, $MILLION)
- TABLE 26. NORTH AMERICA FLUORESCENT PAINT MARKET, BY APPLICATION, 2021-2031 (VOLUME, KILOLITRES)
- TABLE 27. NORTH AMERICA FLUORESCENT PAINT MARKET, BY COUNTRY, 2021-2031 (REVENUE, $MILLION)
- TABLE 28. NORTH AMERICA FLUORESCENT PAINT MARKET, BY COUNTRY, 2021-2031 (VOLUME, KILOLITRES)
- TABLE 29. U.S. FLUORESCENT PAINT MARKET, BY TYPE, 2021-2031 (REVENUE, $MILLION)
- TABLE 30. U.S. FLUORESCENT PAINT MARKET, BY TYPE, 2021-2031 (VOLUME, KILOLITRES)
- TABLE 31. U.S. FLUORESCENT PAINT MARKET, BY APPLICATION, 2021-2031 (REVENUE, $MILLION)
- TABLE 32. U.S. FLUORESCENT PAINT MARKET, BY APPLICATION, 2021-2031 (VOLUME, KILOLITRES)
- TABLE 33. CANADA FLUORESCENT PAINT MARKET, BY TYPE, 2021-2031 (REVENUE, $MILLION)
- TABLE 34. CANADA FLUORESCENT PAINT MARKET, BY TYPE, 2021-2031 (VOLUME, KILOLITRES)
- TABLE 35. CANADA FLUORESCENT PAINT MARKET, BY APPLICATION, 2021-2031 (REVENUE, $MILLION)
- TABLE 36. CANADA FLUORESCENT PAINT MARKET, BY APPLICATION, 2021-2031 (VOLUME, KILOLITRES)
- TABLE 37. MEXICO FLUORESCENT PAINT MARKET, BY TYPE, 2021-2031 (REVENUE, $MILLION)
- TABLE 38. MEXICO FLUORESCENT PAINT MARKET, BY TYPE, 2021-2031 (VOLUME, KILOLITRES)
- TABLE 39. MEXICO FLUORESCENT PAINT MARKET, BY APPLICATION, 2021-2031 (REVENUE, $MILLION)
- TABLE 40. MEXICO FLUORESCENT PAINT MARKET, BY APPLICATION, 2021-2031 (VOLUME, KILOLITRES)
- TABLE 41. EUROPE FLUORESCENT PAINT MARKET, BY TYPE, 2021-2031 (REVENUE, $MILLION)
- TABLE 42. EUROPE FLUORESCENT PAINT MARKET, BY TYPE, 2021-2031 (VOLUME, KILOLITRES)
- TABLE 43. EUROPE FLUORESCENT PAINT MARKET, BY APPLICATION, 2021-2031 (REVENUE, $MILLION)
- TABLE 44. EUROPE FLUORESCENT PAINT MARKET, BY APPLICATION, 2021-2031 (VOLUME, KILOLITRES)
- TABLE 45. EUROPE FLUORESCENT PAINT MARKET, BY COUNTRY, 2021-2031 (REVENUE, $MILLION)
- TABLE 46. EUROPE FLUORESCENT PAINT MARKET, BY COUNTRY, 2021-2031 (VOLUME, KILOLITRES)
- TABLE 47. GERMANY FLUORESCENT PAINT MARKET, BY TYPE, 2021-2031 (REVENUE, $MILLION)
- TABLE 48. GERMANY FLUORESCENT PAINT MARKET, BY TYPE, 2021-2031 (VOLUME, KILOLITRES)
- TABLE 49. GERMANY FLUORESCENT PAINT MARKET, BY APPLICATION, 2021-2031 (REVENUE, $MILLION)
- TABLE 50. GERMANY FLUORESCENT PAINT MARKET, BY APPLICATION, 2021-2031 (VOLUME, KILOLITRES)
- TABLE 51. FRANCE FLUORESCENT PAINT MARKET, BY TYPE, 2021-2031 (REVENUE, $MILLION)
- TABLE 52. FRANCE FLUORESCENT PAINT MARKET, BY TYPE, 2021-2031 (VOLUME, KILOLITRES)
- TABLE 53. FRANCE FLUORESCENT PAINT MARKET, BY APPLICATION, 2021-2031 (REVENUE, $MILLION)
- TABLE 54. FRANCE FLUORESCENT PAINT MARKET, BY APPLICATION, 2021-2031 (VOLUME, KILOLITRES)
- TABLE 55. ITALY FLUORESCENT PAINT MARKET, BY TYPE, 2021-2031 (REVENUE, $MILLION)
- TABLE 56. ITALY FLUORESCENT PAINT MARKET, BY TYPE, 2021-2031 (VOLUME, KILOLITRES)
- TABLE 57. ITALY FLUORESCENT PAINT MARKET, BY APPLICATION, 2021-2031 (REVENUE, $MILLION)
- TABLE 58. ITALY FLUORESCENT PAINT MARKET, BY APPLICATION, 2021-2031 (VOLUME, KILOLITRES)
- TABLE 59. UK FLUORESCENT PAINT MARKET, BY TYPE, 2021-2031 (REVENUE, $MILLION)
- TABLE 60. UK FLUORESCENT PAINT MARKET, BY TYPE, 2021-2031 (VOLUME, KILOLITRES)
- TABLE 61. UK FLUORESCENT PAINT MARKET, BY APPLICATION, 2021-2031 (REVENUE, $MILLION)
- TABLE 62. UK FLUORESCENT PAINT MARKET, BY APPLICATION, 2021-2031 (VOLUME, KILOLITRES)
- TABLE 63. SPAIN FLUORESCENT PAINT MARKET, BY TYPE, 2021-2031 (REVENUE, $MILLION)
- TABLE 64. SPAIN FLUORESCENT PAINT MARKET, BY TYPE, 2021-2031 (VOLUME, KILOLITRES)
- TABLE 65. SPAIN FLUORESCENT PAINT MARKET, BY APPLICATION, 2021-2031 (REVENUE, $MILLION)
- TABLE 66. SPAIN FLUORESCENT PAINT MARKET, BY APPLICATION, 2021-2031 (VOLUME, KILOLITRES)
- TABLE 67. REST OF EUROPE FLUORESCENT PAINT MARKET, BY TYPE, 2021-2031 (REVENUE, $MILLION)
- TABLE 68. REST OF EUROPE FLUORESCENT PAINT MARKET, BY TYPE, 2021-2031 (VOLUME, KILOLITRES)
- TABLE 69. REST OF EUROPE FLUORESCENT PAINT MARKET, BY APPLICATION, 2021-2031 (REVENUE, $MILLION)
- TABLE 70. REST OF EUROPE FLUORESCENT PAINT MARKET, BY APPLICATION, 2021-2031 (VOLUME, KILOLITRES)
- TABLE 71. ASIA-PACIFIC FLUORESCENT PAINT MARKET, BY TYPE, 2021-2031 (REVENUE, $MILLION)
- TABLE 72. ASIA-PACIFIC FLUORESCENT PAINT MARKET, BY TYPE, 2021-2031 (VOLUME, KILOLITRES)
- TABLE 73. ASIA-PACIFIC FLUORESCENT PAINT MARKET, BY APPLICATION, 2021-2031 (REVENUE, $MILLION)
- TABLE 74. ASIA-PACIFIC FLUORESCENT PAINT MARKET, BY APPLICATION, 2021-2031 (VOLUME, KILOLITRES)
- TABLE 75. ASIA-PACIFIC FLUORESCENT PAINT MARKET, BY COUNTRY, 2021-2031 (REVENUE, $MILLION)
- TABLE 76. ASIA-PACIFIC FLUORESCENT PAINT MARKET, BY COUNTRY, 2021-2031 (VOLUME, KILOLITRES)
- TABLE 77. CHINA FLUORESCENT PAINT MARKET, BY TYPE, 2021-2031 (REVENUE, $MILLION)
- TABLE 78. CHINA FLUORESCENT PAINT MARKET, BY TYPE, 2021-2031 (VOLUME, KILOLITRES)
- TABLE 79. CHINA FLUORESCENT PAINT MARKET, BY APPLICATION, 2021-2031 (REVENUE, $MILLION)
- TABLE 80. CHINA FLUORESCENT PAINT MARKET, BY APPLICATION, 2021-2031 (VOLUME, KILOLITRES)
- TABLE 81. INDIA FLUORESCENT PAINT MARKET, BY TYPE, 2021-2031 (REVENUE, $MILLION)
- TABLE 82. INDIA FLUORESCENT PAINT MARKET, BY TYPE, 2021-2031 (VOLUME, KILOLITRES)
- TABLE 83. INDIA FLUORESCENT PAINT MARKET, BY APPLICATION, 2021-2031 (REVENUE, $MILLION)
- TABLE 84. INDIA FLUORESCENT PAINT MARKET, BY APPLICATION, 2021-2031 (VOLUME, KILOLITRES)
- TABLE 85. JAPAN FLUORESCENT PAINT MARKET, BY TYPE, 2021-2031 (REVENUE, $MILLION)
- TABLE 86. JAPAN FLUORESCENT PAINT MARKET, BY TYPE, 2021-2031 (VOLUME, KILOLITRES)
- TABLE 87. JAPAN FLUORESCENT PAINT MARKET, BY APPLICATION, 2021-2031 (REVENUE, $MILLION)
- TABLE 88. JAPAN FLUORESCENT PAINT MARKET, BY APPLICATION, 2021-2031 (VOLUME, KILOLITRES)
- TABLE 89. SOUTH KOREA FLUORESCENT PAINT MARKET, BY TYPE, 2021-2031 (REVENUE, $MILLION)
- TABLE 90. SOUTH KOREA FLUORESCENT PAINT MARKET, BY TYPE, 2021-2031 (VOLUME, KILOLITRES)
- TABLE 91. SOUTH KOREA FLUORESCENT PAINT MARKET, BY APPLICATION, 2021-2031 (REVENUE, $MILLION)
- TABLE 92. SOUTH KOREA FLUORESCENT PAINT MARKET, BY APPLICATION, 2021-2031 (VOLUME, KILOLITRES)
- TABLE 93. AUSTRALIA FLUORESCENT PAINT MARKET, BY TYPE, 2021-2031 (REVENUE, $MILLION)
- TABLE 94. AUSTRALIA FLUORESCENT PAINT MARKET, BY TYPE, 2021-2031 (VOLUME, KILOLITRES)
- TABLE 95. AUSTRALIA FLUORESCENT PAINT MARKET, BY APPLICATION, 2021-2031 (REVENUE, $MILLION)
- TABLE 96. AUSTRALIA FLUORESCENT PAINT MARKET, BY APPLICATION, 2021-2031 (VOLUME, KILOLITRES)
- TABLE 97. REST OF ASIA-PACIFIC FLUORESCENT PAINT MARKET, BY TYPE, 2021-2031 (REVENUE, $MILLION)
- TABLE 98. REST OF ASIA-PACIFIC FLUORESCENT PAINT MARKET, BY TYPE, 2021-2031 (VOLUME, KILOLITRES)
- TABLE 99. REST OF ASIA-PACIFIC FLUORESCENT PAINT MARKET, BY APPLICATION, 2021-2031 (REVENUE, $MILLION)
- TABLE 100. REST OF ASIA-PACIFIC FLUORESCENT PAINT MARKET, BY APPLICATION, 2021-2031 (VOLUME, KILOLITRES)
- TABLE 101. LAMEA FLUORESCENT PAINT MARKET, BY TYPE, 2021-2031 (REVENUE, $MILLION)
- TABLE 102. LAMEA FLUORESCENT PAINT MARKET, BY TYPE, 2021-2031 (VOLUME, KILOLITRES)
- TABLE 103. LAMEA FLUORESCENT PAINT MARKET, BY APPLICATION, 2021-2031 (REVENUE, $MILLION)
- TABLE 104. LAMEA FLUORESCENT PAINT MARKET, BY APPLICATION, 2021-2031 (VOLUME, KILOLITRES)
- TABLE 105. LAMEA FLUORESCENT PAINT MARKET, BY COUNTRY, 2021-2031 (REVENUE, $MILLION)
- TABLE 106. LAMEA FLUORESCENT PAINT MARKET, BY COUNTRY, 2021-2031 (VOLUME, KILOLITRES)
- TABLE 107. BRAZIL FLUORESCENT PAINT MARKET, BY TYPE, 2021-2031 (REVENUE, $MILLION)
- TABLE 108. BRAZIL FLUORESCENT PAINT MARKET, BY TYPE, 2021-2031 (VOLUME, KILOLITRES)
- TABLE 109. BRAZIL FLUORESCENT PAINT MARKET, BY APPLICATION, 2021-2031 (REVENUE, $MILLION)
- TABLE 110. BRAZIL FLUORESCENT PAINT MARKET, BY APPLICATION, 2021-2031 (VOLUME, KILOLITRES)
- TABLE 111. SAUDI ARABIA FLUORESCENT PAINT MARKET, BY TYPE, 2021-2031 (REVENUE, $MILLION)
- TABLE 112. SAUDI ARABIA FLUORESCENT PAINT MARKET, BY TYPE, 2021-2031 (VOLUME, KILOLITRES)
- TABLE 113. SAUDI ARABIA FLUORESCENT PAINT MARKET, BY APPLICATION, 2021-2031 (REVENUE, $MILLION)
- TABLE 114. SAUDI ARABIA FLUORESCENT PAINT MARKET, BY APPLICATION, 2021-2031 (VOLUME, KILOLITRES)
- TABLE 115. SOUTH AFRICA FLUORESCENT PAINT MARKET, BY TYPE, 2021-2031 (REVENUE, $MILLION)
- TABLE 116. SOUTH AFRICA FLUORESCENT PAINT MARKET, BY TYPE, 2021-2031 (VOLUME, KILOLITRES)
- TABLE 117. SOUTH AFRICA FLUORESCENT PAINT MARKET, BY APPLICATION, 2021-2031 (REVENUE, $MILLION)
- TABLE 118. SOUTH AFRICA FLUORESCENT PAINT MARKET, BY APPLICATION, 2021-2031 (VOLUME, KILOLITRES)
- TABLE 119. REST OF LAMEA FLUORESCENT PAINT MARKET, BY TYPE, 2021-2031 (REVENUE, $MILLION)
- TABLE 120. REST OF LAMEA FLUORESCENT PAINT MARKET, BY TYPE, 2021-2031 (VOLUME, KILOLITRES)
- TABLE 121. REST OF LAMEA FLUORESCENT PAINT MARKET, BY APPLICATION, 2021-2031 (REVENUE, $MILLION)
- TABLE 122. REST OF LAMEA FLUORESCENT PAINT MARKET, BY APPLICATION, 2021-2031 (VOLUME, KILOLITRES)
- TABLE 123. RADIANT COLOR N.V.: KEY EXECUTIVES
- TABLE 124. RADIANT COLOR N.V.: COMPANY SNAPSHOT
- TABLE 125. RADIANT COLOR N.V.: PRODUCT SEGMENTS
- TABLE 126. RADIANT COLOR N.V.: PRODUCT PORTFOLIO
- TABLE 127. LUMINOCHEM: KEY EXECUTIVES
- TABLE 128. LUMINOCHEM: COMPANY SNAPSHOT
- TABLE 129. LUMINOCHEM: PRODUCT SEGMENTS
- TABLE 130. LUMINOCHEM: PRODUCT PORTFOLIO
- TABLE 131. LUMINOCHEM: KEY STRATERGIES
- TABLE 132. ARON UNIVERSAL LIMITED: KEY EXECUTIVES
- TABLE 133. ARON UNIVERSAL LIMITED: COMPANY SNAPSHOT
- TABLE 134. ARON UNIVERSAL LIMITED: PRODUCT SEGMENTS
- TABLE 135. ARON UNIVERSAL LIMITED: PRODUCT PORTFOLIO
- TABLE 136. RONAN PAINTS: KEY EXECUTIVES
- TABLE 137. RONAN PAINTS: COMPANY SNAPSHOT
- TABLE 138. RONAN PAINTS: PRODUCT SEGMENTS
- TABLE 139. RONAN PAINTS: PRODUCT PORTFOLIO
- TABLE 140. GLOW PAINT INDUSTRIES: KEY EXECUTIVES
- TABLE 141. GLOW PAINT INDUSTRIES: COMPANY SNAPSHOT
- TABLE 142. GLOW PAINT INDUSTRIES: PRODUCT SEGMENTS
- TABLE 143. GLOW PAINT INDUSTRIES: PRODUCT PORTFOLIO
- TABLE 144. GLOWTEC LTD: KEY EXECUTIVES
- TABLE 145. GLOWTEC LTD: COMPANY SNAPSHOT
- TABLE 146. GLOWTEC LTD: PRODUCT SEGMENTS
- TABLE 147. GLOWTEC LTD: PRODUCT PORTFOLIO
- TABLE 148. KRYLON PRODUCTS GROUP: KEY EXECUTIVES
- TABLE 149. KRYLON PRODUCTS GROUP: COMPANY SNAPSHOT
- TABLE 150. KRYLON PRODUCTS GROUP: PRODUCT SEGMENTS
- TABLE 151. KRYLON PRODUCTS GROUP: PRODUCT PORTFOLIO
- TABLE 152. DAYGLO COLOR CORP: KEY EXECUTIVES
- TABLE 153. DAYGLO COLOR CORP: COMPANY SNAPSHOT
- TABLE 154. DAYGLO COLOR CORP: PRODUCT SEGMENTS
- TABLE 155. DAYGLO COLOR CORP: PRODUCT PORTFOLIO
- TABLE 156. BRILLIANT GROUP, INC.: KEY EXECUTIVES
- TABLE 157. BRILLIANT GROUP, INC.: COMPANY SNAPSHOT
- TABLE 158. BRILLIANT GROUP, INC.: PRODUCT SEGMENTS
- TABLE 159. BRILLIANT GROUP, INC.: PRODUCT PORTFOLIO
- TABLE 160. BRILLIANT GROUP, INC.: KEY STRATERGIES
- TABLE 161. VICOME CORP.: KEY EXECUTIVES
- TABLE 162. VICOME CORP.: COMPANY SNAPSHOT
- TABLE 163. VICOME CORP.: PRODUCT SEGMENTS
- TABLE 164. VICOME CORP.: PRODUCT PORTFOLIO
LIST OF FIGURES
- FIGURE 01. FLUORESCENT PAINT MARKET, 2021-2031
- FIGURE 02. SEGMENTATION OF FLUORESCENT PAINT MARKET, 2021-2031
- FIGURE 03. TOP INVESTMENT POCKETS IN FLUORESCENT PAINT MARKET (2022-2031)
- FIGURE 04. MODERATE BARGAINING POWER OF SUPPLIERS
- FIGURE 05. MODERATE BARGAINING POWER OF BUYERS
- FIGURE 06. MODERATE THREAT OF SUBSTITUTES
- FIGURE 07. MODERATE THREAT OF NEW ENTRANTS
- FIGURE 08. LOW INTENSITY OF RIVALRY
- FIGURE 09. DRIVERS, RESTRAINTS AND OPPORTUNITIES: GLOBALFLUORESCENT PAINT MARKET
- FIGURE 10. MARKET SHARE ANALYSIS: FLUORESCENT PAINT MARKET
- FIGURE 11. PATENT ANALYSIS BY COMPANY
- FIGURE 12. PATENT ANALYSIS BY COUNTRY
- FIGURE 13. PRICING ANALYSIS: FLUORESCENT PAINT MARKET 2021 AND 2031
- FIGURE 14. VALUE CHAIN ANALYSIS: FLUORESCENT PAINT MARKET
- FIGURE 15. FLUORESCENT PAINT MARKET, BY TYPE, 2021(%)
- FIGURE 16. COMPARATIVE SHARE ANALYSIS OF FLUORESCENT PAINT MARKET FOR INORGANIC FLUORESCENTS, BY COUNTRY 2021-2031(%)
- FIGURE 17. COMPARATIVE SHARE ANALYSIS OF FLUORESCENT PAINT MARKET FOR OPTICAL WHITENERS, BY COUNTRY 2021-2031(%)
- FIGURE 18. COMPARATIVE SHARE ANALYSIS OF FLUORESCENT PAINT MARKET FOR DAYLIGHT FLUORESCENTS, BY COUNTRY 2021-2031(%)
- FIGURE 19. FLUORESCENT PAINT MARKET, BY APPLICATION, 2021(%)
- FIGURE 20. COMPARATIVE SHARE ANALYSIS OF FLUORESCENT PAINT MARKET FOR SAFETY EQUIPMENT, BY COUNTRY 2021-2031(%)
- FIGURE 21. COMPARATIVE SHARE ANALYSIS OF FLUORESCENT PAINT MARKET FOR COMMERCIAL BUILDINGS, BY COUNTRY 2021-2031(%)
- FIGURE 22. COMPARATIVE SHARE ANALYSIS OF FLUORESCENT PAINT MARKET FOR ROAD LINE MARKINGS, BY COUNTRY 2021-2031(%)
- FIGURE 23. COMPARATIVE SHARE ANALYSIS OF FLUORESCENT PAINT MARKET FOR FACILITIES, BY COUNTRY 2021-2031(%)
- FIGURE 24. COMPARATIVE SHARE ANALYSIS OF FLUORESCENT PAINT MARKET FOR OTHERS, BY COUNTRY 2021-2031(%)
- FIGURE 25. FLUORESCENT PAINT MARKET BY REGION, 2021
- FIGURE 26. U.S. FLUORESCENT PAINT MARKET, 2021-2031 ($MILLION)
- FIGURE 27. CANADA FLUORESCENT PAINT MARKET, 2021-2031 ($MILLION)
- FIGURE 28. MEXICO FLUORESCENT PAINT MARKET, 2021-2031 ($MILLION)
- FIGURE 29. GERMANY FLUORESCENT PAINT MARKET, 2021-2031 ($MILLION)
- FIGURE 30. FRANCE FLUORESCENT PAINT MARKET, 2021-2031 ($MILLION)
- FIGURE 31. ITALY FLUORESCENT PAINT MARKET, 2021-2031 ($MILLION)
- FIGURE 32. UK FLUORESCENT PAINT MARKET, 2021-2031 ($MILLION)
- FIGURE 33. SPAIN FLUORESCENT PAINT MARKET, 2021-2031 ($MILLION)
- FIGURE 34. REST OF EUROPE FLUORESCENT PAINT MARKET, 2021-2031 ($MILLION)
- FIGURE 35. CHINA FLUORESCENT PAINT MARKET, 2021-2031 ($MILLION)
- FIGURE 36. INDIA FLUORESCENT PAINT MARKET, 2021-2031 ($MILLION)
- FIGURE 37. JAPAN FLUORESCENT PAINT MARKET, 2021-2031 ($MILLION)
- FIGURE 38. SOUTH KOREA FLUORESCENT PAINT MARKET, 2021-2031 ($MILLION)
- FIGURE 39. AUSTRALIA FLUORESCENT PAINT MARKET, 2021-2031 ($MILLION)
- FIGURE 40. REST OF ASIA-PACIFIC FLUORESCENT PAINT MARKET, 2021-2031 ($MILLION)
- FIGURE 41. BRAZIL FLUORESCENT PAINT MARKET, 2021-2031 ($MILLION)
- FIGURE 42. SAUDI ARABIA FLUORESCENT PAINT MARKET, 2021-2031 ($MILLION)
- FIGURE 43. SOUTH AFRICA FLUORESCENT PAINT MARKET, 2021-2031 ($MILLION)
- FIGURE 44. REST OF LAMEA FLUORESCENT PAINT MARKET, 2021-2031 ($MILLION)
- FIGURE 45. TOP WINNING STRATEGIES, BY YEAR
- FIGURE 46. TOP WINNING STRATEGIES, BY DEVELOPMENT
- FIGURE 47. TOP WINNING STRATEGIES, BY COMPANY
- FIGURE 48. PRODUCT MAPPING OF TOP 10 PLAYERS
- FIGURE 49. COMPETITIVE DASHBOARD
- FIGURE 50. COMPETITIVE HEATMAP: FLUORESCENT PAINT MARKET
- FIGURE 51. TOP PLAYER POSITIONING, 2021
The fluorescent paint market attained $357.3 million in 2021 and is projected to reach $677.9 million by 2031, growing at a CAGR of 6.8% from 2022 to 2031.
Fluorescent paint is a form of coating that emits visible or colored light when exposed to light. Fluorescent paints are utilized in paints and coatings, plastics, fabrics, paper goods, and leather goods, among others. It comprises two components, fluorescent paint that absorbs ultraviolet or blue light and re-emits it as visible light with a different wavelength (color). This sort of paint color emits light without the aid of an external source.
Fluorescent paint refers to paint that can absorb both visible and non-visible electromagnetic waves and radiation and then swiftly release the absorbed energy at the required wavelength. When the light of the expected wavelength is released onto this paint, it also emits a very particular hue. On a commercial scale, fluorescent paint has been utilized in a variety of applications, including the formulation of paint and coating solutions, inks, and textiles, to mention a few. There are two forms of fluorescent paint used commercially: organic and inorganic, which are derived from distinct sources. Organic fluorescent paint is made from natural and synthetic basic materials, while inorganic fluorescent paint is synthesized by combining various metal oxides. Both varieties are commercially accessible in powder and dispersion form, with formulations tailored to the requirements of the end-user industry.
Optical whitening agents are chemicals used in the paper industry to enhance the paper's inherent whiteness. After absorbing light in the ultraviolet and violet spectrum (usually between 340 and 370 nm), these chemical compounds emit light in the blue spectrum (typically 420-470 nm). In addition to paper, they are utilized in plastics, textiles, and laundry detergents. They are also known as optical brighteners and artificial whiteners. On the dry end, the wet end, or both ends, optical whiteners can be used. Optical or fluorescent brighteners must be included in the wet end of the stock to obtain internal brightness. Paper makers typically employ fluorescent brighteners for surface coating the dry end of the size press or calendar stack. Dry-end treatment is less expensive than wet-end treatment because the chemical is sprayed on the fiber's outside rather than its interior to reflect UV radiation in the dry end. However, some manufacturers process both the wet and dry ends together. Consequently, the broad applicability and use of optical or fluorescent brighteners in the coated or uncoated paper industry are anticipated to propel the fluorescent paint market.
Fluorescent paints are used for theatrical lights, paints, and other lighting purposes. Fluorescent paints' expensive raw materials are a major hindrance in the global fluorescent paints market. Zinc sulfide or zinc prices are increasing due to robust market demand. The analysis from the International Monetary Fund predicts that zinc prices would increase from $2,828 per ton in 2021 to $2,859 per ton in 2022. In addition, the International Lead and Zinc Study Group (ILZSG) projects that by 2022, the worldwide demand for refined zinc is expected to increase to 14.41 million tons. In addition, the government's severe limitations on titanium dioxide, a raw material for fluorescent paints, are anticipated to impede the expansion of the fluorescent paints market. In February 2020, the EU designated titanium dioxide as a carcinogen under CLP standards. Thus, stringent environmental regulations for raw materials impede the expansion of the fluorescent paints industry.
The usage of fluorescent paint in inks, varnishes, markings, and signs is expanding its aerospace and defense applications. The fluorescent paint offers airlines brilliant color, reflection, and brightness. To improve the tail rotor's visibility during low-light or nighttime operations, an airline applies phosphorescent paint. In addition, fluorescent paints are employed on aircraft because they absorb light during the day and emit visible light in low-light or nighttime environments. Increasing airline operations and production post-pandemic are also propelling the bright pigments market. According to the Aerospace Industries Association (AIA), the aerospace & defense industry's sales income reached $909 billion in 2019, a 6.7% rise from the previous year. Thus, the expanding aerospace and military industry is driving the market for fluorescent paint and providing tremendous opportunities for global expansion.
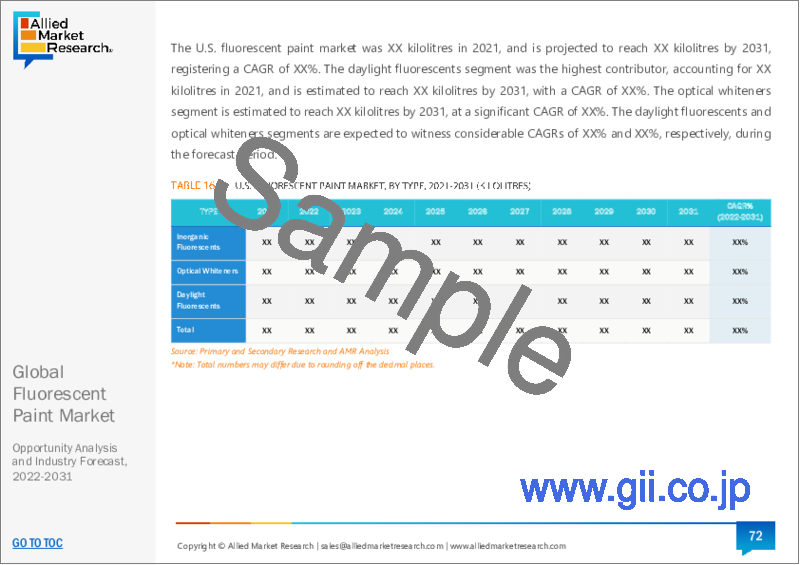
The fluorescent paint market is segmented into type, application, and region. Depending on the type, the market is divided into Inorganic fluorescents, optical whiteners, and daylight fluorescents. On the basis of application, it is categorized into safety equipment, commercial buildings, road line markings, facilities, and others. Region-wise, the market is studied across North America, Europe, Asia-Pacific, and LAMEA.
The major players operating in the global fluorescents paint market are: Radiant Color N.V., LuminoChem, Ronan Paints, Glow Paint Industries, GLOWTEC LTD, Krylon Products Group, DayGlo Color Corp, Brilliant Group, Inc., Aron Universal Limited, Vicome Corp. Other players operating in the market are Midstar, Xcolor, DANE Color Group and Solar Color Dust.
Key findings of the study
On the basis of type, the daylight fluorescents segment is expected to grow at a CAGR of 7.0%, in terms of revenue, during the forecast period.
Depending on application, the safety equipment segment is expected to grow at a CAGR of 7.4%, in terms of revenue, during the forecast period.
Region-wise, Asia-Pacific garnered the highest share in 2021 in terms of revenue.
Key Benefits For Stakeholders
- This report provides a quantitative analysis of the market segments, current trends, estimations, and dynamics of the fluorescent paint market analysis from 2021 to 2031 to identify the prevailing fluorescent paint market opportunities.
- The market research is offered along with information related to key drivers, restraints, and opportunities.
- Porter's five forces analysis highlights the potency of buyers and suppliers to enable stakeholders make profit-oriented business decisions and strengthen their supplier-buyer network.
- In-depth analysis of the fluorescent paint market segmentation assists to determine the prevailing market opportunities.
- Major countries in each region are mapped according to their revenue contribution to the global market.
- Market player positioning facilitates benchmarking and provides a clear understanding of the present position of the market players.
- The report includes the analysis of the regional as well as global fluorescent paint market trends, key players, market segments, application areas, and market growth strategies.
Key Market Segments
By Type
- Daylight Fluorescents
- Inorganic Fluorescents
- Optical Whiteners
By Application
- Safety Equipment
- Commercial Buildings
- Road Line Markings
- Facilities
- Others
By Region
- North America
- U.S.
- Canada
- Mexico
- Europe
- Germany
- France
- Italy
- UK
- Spain
- Rest of Europe
- Asia-Pacific
- China
- India
- Japan
- South Korea
- Australia
- Rest of Asia-Pacific
- LAMEA
- Brazil
- Saudi Arabia
- South Africa
- Rest of LAMEA
Key Market Players
- Radiant Color N.V.
- LuminoChem
- Glow Paint Industries
- GLOWTEC LTD
- DayGlo Color Corp
- Brilliant Group, Inc.
- Aron Universal Limited
- Vicome Corp.
- Ronan Paints
- Krylon Products Group
TABLE OF CONTENTS
CHAPTER 1: INTRODUCTION
- 1.1. Report description
- 1.2. Key market segments
- 1.3. Key benefits to the stakeholders
- 1.4. Research Methodology
- 1.4.1. Primary research
- 1.4.2. Secondary research
- 1.4.3. Analyst tools and models
CHAPTER 2: EXECUTIVE SUMMARY
- 2.1. CXO Perspective
CHAPTER 3: MARKET OVERVIEW
- 3.1. Market definition and scope
- 3.2. Key findings
- 3.2.1. Top impacting factors
- 3.2.2. Top investment pockets
- 3.3. Porter's five forces analysis
- 3.3.1. Moderate bargaining power of suppliers
- 3.3.2. Moderate bargaining power of buyers
- 3.3.3. Moderate threat of substitutes
- 3.3.4. Moderate threat of new entrants
- 3.3.5. Low intensity of rivalry
- 3.4. Market dynamics
- 3.4.1. Drivers
- 3.4.1.1. Increasing demand from building and construction industry
- 3.4.1.2. Increasing use of optical whiteners in coated and uncoated paper industry
- 3.4.2. Restraints
- 3.4.2.1. Increasing raw material costs and environmental restrictions
- 3.4.3. Opportunities
- 3.4.3.1. Increasing use in the aerospace and defense industries
- 3.4.1. Drivers
- 3.5. COVID-19 Impact Analysis on the market
- 3.6. Market Share Analysis
- 3.7. Patent Landscape
- 3.8. Pricing Analysis
- 3.9. Value Chain Analysis
CHAPTER 4: FLUORESCENT PAINT MARKET, BY TYPE
- 4.1. Overview
- 4.1.1. Market size and forecast
- 4.2. Inorganic Fluorescents
- 4.2.1. Key market trends, growth factors and opportunities
- 4.2.2. Market size and forecast, by region
- 4.2.3. Market share analysis by country
- 4.3. Optical Whiteners
- 4.3.1. Key market trends, growth factors and opportunities
- 4.3.2. Market size and forecast, by region
- 4.3.3. Market share analysis by country
- 4.4. Daylight Fluorescents
- 4.4.1. Key market trends, growth factors and opportunities
- 4.4.2. Market size and forecast, by region
- 4.4.3. Market share analysis by country
CHAPTER 5: FLUORESCENT PAINT MARKET, BY APPLICATION
- 5.1. Overview
- 5.1.1. Market size and forecast
- 5.2. Safety Equipment
- 5.2.1. Key market trends, growth factors and opportunities
- 5.2.2. Market size and forecast, by region
- 5.2.3. Market share analysis by country
- 5.3. Commercial Buildings
- 5.3.1. Key market trends, growth factors and opportunities
- 5.3.2. Market size and forecast, by region
- 5.3.3. Market share analysis by country
- 5.4. Road Line Markings
- 5.4.1. Key market trends, growth factors and opportunities
- 5.4.2. Market size and forecast, by region
- 5.4.3. Market share analysis by country
- 5.5. Facilities
- 5.5.1. Key market trends, growth factors and opportunities
- 5.5.2. Market size and forecast, by region
- 5.5.3. Market share analysis by country
- 5.6. Others
- 5.6.1. Key market trends, growth factors and opportunities
- 5.6.2. Market size and forecast, by region
- 5.6.3. Market share analysis by country
CHAPTER 6: FLUORESCENT PAINT MARKET, BY REGION
- 6.1. Overview
- 6.1.1. Market size and forecast By Region
- 6.2. North America
- 6.2.1. Key trends and opportunities
- 6.2.2. Market size and forecast, by Type
- 6.2.3. Market size and forecast, by Application
- 6.2.4. Market size and forecast, by country
- 6.2.4.1. U.S.
- 6.2.4.1.1. Key market trends, growth factors and opportunities
- 6.2.4.1.2. Market size and forecast, by Type
- 6.2.4.1.3. Market size and forecast, by Application
- 6.2.4.2. Canada
- 6.2.4.2.1. Key market trends, growth factors and opportunities
- 6.2.4.2.2. Market size and forecast, by Type
- 6.2.4.2.3. Market size and forecast, by Application
- 6.2.4.3. Mexico
- 6.2.4.3.1. Key market trends, growth factors and opportunities
- 6.2.4.3.2. Market size and forecast, by Type
- 6.2.4.3.3. Market size and forecast, by Application
- 6.3. Europe
- 6.3.1. Key trends and opportunities
- 6.3.2. Market size and forecast, by Type
- 6.3.3. Market size and forecast, by Application
- 6.3.4. Market size and forecast, by country
- 6.3.4.1. Germany
- 6.3.4.1.1. Key market trends, growth factors and opportunities
- 6.3.4.1.2. Market size and forecast, by Type
- 6.3.4.1.3. Market size and forecast, by Application
- 6.3.4.2. France
- 6.3.4.2.1. Key market trends, growth factors and opportunities
- 6.3.4.2.2. Market size and forecast, by Type
- 6.3.4.2.3. Market size and forecast, by Application
- 6.3.4.3. Italy
- 6.3.4.3.1. Key market trends, growth factors and opportunities
- 6.3.4.3.2. Market size and forecast, by Type
- 6.3.4.3.3. Market size and forecast, by Application
- 6.3.4.4. UK
- 6.3.4.4.1. Key market trends, growth factors and opportunities
- 6.3.4.4.2. Market size and forecast, by Type
- 6.3.4.4.3. Market size and forecast, by Application
- 6.3.4.5. Spain
- 6.3.4.5.1. Key market trends, growth factors and opportunities
- 6.3.4.5.2. Market size and forecast, by Type
- 6.3.4.5.3. Market size and forecast, by Application
- 6.3.4.6. Rest of Europe
- 6.3.4.6.1. Key market trends, growth factors and opportunities
- 6.3.4.6.2. Market size and forecast, by Type
- 6.3.4.6.3. Market size and forecast, by Application
- 6.4. Asia-Pacific
- 6.4.1. Key trends and opportunities
- 6.4.2. Market size and forecast, by Type
- 6.4.3. Market size and forecast, by Application
- 6.4.4. Market size and forecast, by country
- 6.4.4.1. China
- 6.4.4.1.1. Key market trends, growth factors and opportunities
- 6.4.4.1.2. Market size and forecast, by Type
- 6.4.4.1.3. Market size and forecast, by Application
- 6.4.4.2. India
- 6.4.4.2.1. Key market trends, growth factors and opportunities
- 6.4.4.2.2. Market size and forecast, by Type
- 6.4.4.2.3. Market size and forecast, by Application
- 6.4.4.3. Japan
- 6.4.4.3.1. Key market trends, growth factors and opportunities
- 6.4.4.3.2. Market size and forecast, by Type
- 6.4.4.3.3. Market size and forecast, by Application
- 6.4.4.4. South Korea
- 6.4.4.4.1. Key market trends, growth factors and opportunities
- 6.4.4.4.2. Market size and forecast, by Type
- 6.4.4.4.3. Market size and forecast, by Application
- 6.4.4.5. Australia
- 6.4.4.5.1. Key market trends, growth factors and opportunities
- 6.4.4.5.2. Market size and forecast, by Type
- 6.4.4.5.3. Market size and forecast, by Application
- 6.4.4.6. Rest of Asia-Pacific
- 6.4.4.6.1. Key market trends, growth factors and opportunities
- 6.4.4.6.2. Market size and forecast, by Type
- 6.4.4.6.3. Market size and forecast, by Application
- 6.5. LAMEA
- 6.5.1. Key trends and opportunities
- 6.5.2. Market size and forecast, by Type
- 6.5.3. Market size and forecast, by Application
- 6.5.4. Market size and forecast, by country
- 6.5.4.1. Brazil
- 6.5.4.1.1. Key market trends, growth factors and opportunities
- 6.5.4.1.2. Market size and forecast, by Type
- 6.5.4.1.3. Market size and forecast, by Application
- 6.5.4.2. Saudi Arabia
- 6.5.4.2.1. Key market trends, growth factors and opportunities
- 6.5.4.2.2. Market size and forecast, by Type
- 6.5.4.2.3. Market size and forecast, by Application
- 6.5.4.3. South Africa
- 6.5.4.3.1. Key market trends, growth factors and opportunities
- 6.5.4.3.2. Market size and forecast, by Type
- 6.5.4.3.3. Market size and forecast, by Application
- 6.5.4.4. Rest of LAMEA
- 6.5.4.4.1. Key market trends, growth factors and opportunities
- 6.5.4.4.2. Market size and forecast, by Type
- 6.5.4.4.3. Market size and forecast, by Application
CHAPTER 7: COMPETITIVE LANDSCAPE
- 7.1. Introduction
- 7.2. Top winning strategies
- 7.3. Product Mapping of Top 10 Player
- 7.4. Competitive Dashboard
- 7.5. Competitive Heatmap
- 7.6. Top player positioning, 2021
CHAPTER 8: COMPANY PROFILES
- 8.1. Radiant Color N.V.
- 8.1.1. Company overview
- 8.1.2. Key Executives
- 8.1.3. Company snapshot
- 8.1.4. Operating business segments
- 8.1.5. Product portfolio
- 8.2. LuminoChem
- 8.2.1. Company overview
- 8.2.2. Key Executives
- 8.2.3. Company snapshot
- 8.2.4. Operating business segments
- 8.2.5. Product portfolio
- 8.2.6. Key strategic moves and developments
- 8.3. Aron Universal Limited
- 8.3.1. Company overview
- 8.3.2. Key Executives
- 8.3.3. Company snapshot
- 8.3.4. Operating business segments
- 8.3.5. Product portfolio
- 8.4. Ronan Paints
- 8.4.1. Company overview
- 8.4.2. Key Executives
- 8.4.3. Company snapshot
- 8.4.4. Operating business segments
- 8.4.5. Product portfolio
- 8.5. Glow Paint Industries
- 8.5.1. Company overview
- 8.5.2. Key Executives
- 8.5.3. Company snapshot
- 8.5.4. Operating business segments
- 8.5.5. Product portfolio
- 8.6. GLOWTEC LTD
- 8.6.1. Company overview
- 8.6.2. Key Executives
- 8.6.3. Company snapshot
- 8.6.4. Operating business segments
- 8.6.5. Product portfolio
- 8.7. Krylon Products Group
- 8.7.1. Company overview
- 8.7.2. Key Executives
- 8.7.3. Company snapshot
- 8.7.4. Operating business segments
- 8.7.5. Product portfolio
- 8.8. DayGlo Color Corp
- 8.8.1. Company overview
- 8.8.2. Key Executives
- 8.8.3. Company snapshot
- 8.8.4. Operating business segments
- 8.8.5. Product portfolio
- 8.9. Brilliant Group, Inc.
- 8.9.1. Company overview
- 8.9.2. Key Executives
- 8.9.3. Company snapshot
- 8.9.4. Operating business segments
- 8.9.5. Product portfolio
- 8.9.6. Key strategic moves and developments
- 8.10. Vicome Corp.
- 8.10.1. Company overview
- 8.10.2. Key Executives
- 8.10.3. Company snapshot
- 8.10.4. Operating business segments
- 8.10.5. Product portfolio