|
|
市場調査レポート
商品コード
1193356
クリストバライト市場:形態別(粒状、粉末)、用途別(ガラスとサーメット、建築・建設活動、塗料とコーティング、鋳造、その他):世界の機会分析および産業予測、2021-2031年Cristobalite Market By Form (Granular, Powder), By Application (Glass and Cermaic, Building and Construction activities, Paints and Coatings, Foundry, Others): Global Opportunity Analysis and Industry Forecast, 2021-2031 |
||||||
|
|
|||||||


| クリストバライト市場:形態別(粒状、粉末)、用途別(ガラスとサーメット、建築・建設活動、塗料とコーティング、鋳造、その他):世界の機会分析および産業予測、2021-2031年 |
|
出版日: 2022年11月01日
発行: Allied Market Research
ページ情報: 英文 236 Pages
納期: 2~3営業日
|
- 全表示
- 概要
- 図表
- 目次
クリストバライトの世界市場は2021年に3630万米ドル、2031年には5660万米ドルに達し、2022年から2031年にかけてCAGR4.6%で成長すると予測されています。
クリストバライトはシリカの鉱物多形体であり、焼成と鉄分を含まない粉砕工程を経て1,500℃で得られます。クリストバライトは、自然界では主に火山岩に十分な量が含まれています。商業的には、砂を1500℃の窯で加熱して製造します。主に粉状・砂状・粒状で提供されています。クリストバライトは、建築、塗料、金属鋳造、工業、セラミック、ガラス繊維産業など、さまざまな最終用途の産業で幅広く使用されています。
世界の人口の増加、生活水準の向上、消費者の購買力の上昇により、住宅を設計する際にユニークな建築材料を求めるようになりました。セラミックスは、タイル、洗面台、キッチンカウンターなど、住宅・商業建築に使用される特徴的な材料のひとつで、クリストバライトはガラス化剤および溶融剤として広く使用されています。また、融点の維持に役立ち、セラミックに硬度を与え、熱膨張率の減少に役立ちます。そのため、成長するセラミック産業においてクリストバライトの需要は高まっています。
しかし、産業界では作業員や製造業者がクリストバライトの粉末に日常的に触れており、珪肺症、肺疾患、がんなどの急性・慢性疾患を発症する危険性があります。例えば、2022年4月に国立労働安全衛生研究所(NIOSH)が発表した記事によると、それはメーカーが低い程度に彼らの生産能力を切り替えているためにクリストバライトの使用に関するいくつかの基準や規制を設定しています。これは、クリストバライト市場の成長を妨げると予測されます。
一方、クリストバライトの生産は高いエネルギーを消費するため、グレンゼバッハグループは、エネルギーコストの削減と資源の持続的な消費を可能にするエネルギー効率化プロセスのためのオーダーメイド技術や最先端技術に取り組んでいます。持続可能な技術の採用は、クリストバライト市場の潜在的な売上高を増加させ、したがって、市場に有利な機会を提供します。
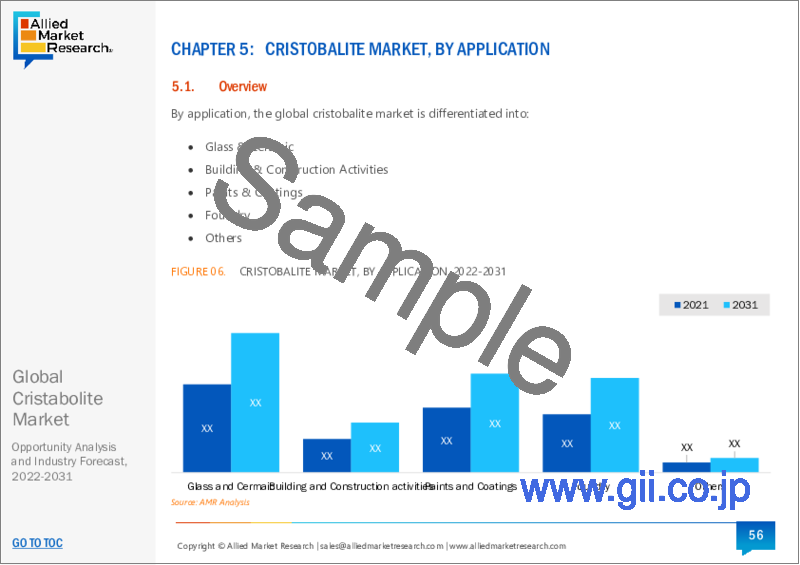
クリストバライト市場は、形状、用途、および地域に基づいて区分されます。形状では、市場は粒状と粉末に分類されます。用途別では、ガラス・セラミック、建築・建設活動、塗料・コーティング、鋳造、その他の用途に分類されます。地域別では、北米、欧州、アジア太平洋、LAMEAで調査しています。
レポートの主なハイライト
クリストバライト市場は、2031年中に粒状セグメントの成長が加速し、主要シェアの40%を占めると予測されています。
塗料とコーティングのアプリケーションセグメントは、クリストバライト市場で2番目に急速に成長しているアプリケーションセグメントであり、CAGR 4.3%で成長しています。
北米は2021年の総市場シェアの25%を占めており、予測期間中はCAGR 4.0%で成長すると予測されています。
中国、米国、インド、ドイツ、ブラジルなどの国々は、世界のクリストバライト市場で大きなシェアを占めています。
利害関係者にとっての主なメリット
- 本レポートは、2021年から2031年までのクリストバライト市場分析の市場セグメント、現在の動向、推定、力学を定量的に分析し、クリストバライト市場の優勢な機会を特定します。
- 市場調査は、主要な促進要因、市場抑制要因、機会に関連する情報とともに提供されます。
- ポーターのファイブフォース分析は、利害関係者が利益志向のビジネス決定を行い、サプライヤーとバイヤーのネットワークを強化できるように、バイヤーとサプライヤーの効力を強調します。
- クリストバライト市場のセグメンテーションの詳細な分析は、一般的な市場機会を決定するのに役立ちます。
- 各地域の主要国は、世界市場に対する収益貢献度に応じてマッピングされています。
- 市場プレーヤーのポジショニングは、ベンチマークを容易にし、市場プレーヤーの現在の位置の明確な理解を提供します。
- 当レポートは、地域および世界のクリストファイトの市場動向、主要企業、市場セグメント、応用分野、市場成長戦略の分析を含んでいます。
目次
第1章 イントロダクション
第2章 エグゼクティブサマリー
第3章 市場の概要
- 市場の定義と範囲
- 主な調査結果
- 主な投資ポケット
- ポーターのファイブフォース分析
- 市場力学
- 促進要因
- bcnsghaafasf
- jzsvjxhvjhv
- 抑制要因
- smdvbdsjvh
- 機会(Opportunities)
- zjnbfjsdbdskj
- mcbzjhzjkhvd
- 促進要因
- COVID-19 影響分析
- プライシング分析
- バリューチェーン分析
- 特許情勢
第4章 クリストバライト市場:形状別
- 概要
- 市場規模および予測
- 顆粒
- 主な市場動向、成長要因、機会
- 市場規模・予測:地域別
- 市場シェア分析:国別
- 粉末
- 主な市場動向、成長要因、機会
- 市場規模・予測:地域別
- 市場シェア分析:国別
第5章 クリストバライト市場:用途別
- 概要
- 市場規模および予測
- ガラスとサーメック
- 主な市場動向、成長要因、機会
- 市場規模・予測:地域別
- 市場シェア分析:国別
- 建築・建設分野
- 主な市場動向、成長要因、機会
- 市場規模・予測:地域別
- 市場シェア分析:国別
- 塗料・コーティング
- 主な市場動向、成長要因、機会
- 市場規模・予測:地域別
- 市場シェア分析:国別
- ファウンドリ
- 主な市場動向、成長要因、機会
- 市場規模・予測:地域別
- 市場シェア分析:国別
- その他
- 主な市場動向、成長要因、機会
- 市場規模・予測:地域別
- 市場シェア分析:国別
第6章 クリストバライト市場:地域別
- 概要
- 市場規模・予測
- 北米
- 主な動向と機会
- 北米市場規模・予測:形状別
- 北米市場規模・予測:用途別
- 北米市場規模・予測:国別
- 米国
- カナダ
- メキシコ
- 欧州
- 主な動向と機会
- 欧州の市場規模・予測:形態別
- 欧州市場規模・予測:アプリケーション別
- 欧州市場規模・予測:国別
- ドイツ
- 英国
- フランス
- スペイン
- イタリア
- その他の欧州
- アジア太平洋地域
- 主な動向と機会
- アジア太平洋地域の市場規模・予測:形態別
- アジア太平洋地域の市場規模・予測:用途別
- アジア太平洋地域の市場規模・予測:国別
- 中国
- インド
- 日本
- 韓国
- オーストラリア
- その他アジア太平洋地域
- LAMEA
- 主な動向と機会
- LAMEAの市場規模・予測:形態別
- LAMEAの市場規模・予測:アプリケーション別
- LAMEAの市場規模・予測:国別
- ブラジル
- サウジアラビア
- 南アフリカ共和国
- LAMEAの残りの地域
第7章 企業情勢
- イントロダクション
- 主要成功戦略
- 主要10社の製品マッピング
- 競合ダッシュボード
- 競合ヒートマップ
- トップ企業のポジショニング、2021年
第8章 企業プロファイル
- C.E.D. Process Minerals, Inc
- Goyal Group Of Minerals
- GRENZEBACH GROUP
- Momentive Technologies
- Hoben International Limited
- Quartz Works GmbH
- Sibelco,
- Goldstar Powders Pvt. Ltd
- Dinglong Quartz Limited
- SILMER
LIST OF TABLES
- TABLE 1. GLOBAL CRISTOBALITE MARKET, BY FORM, 2021-2031 (REVENUE, $THOUSAND)
- TABLE 2. GLOBAL CRISTOBALITE MARKET, BY FORM, 2021-2031 (VOLUME, TONS)
- TABLE 3. CRISTOBALITE MARKET FOR GRANULAR, BY REGION, 2021-2031 (REVENUE, $THOUSAND)
- TABLE 4. CRISTOBALITE MARKET FOR GRANULAR, BY REGION, 2021-2031 (VOLUME, TONS)
- TABLE 5. CRISTOBALITE MARKET FOR POWDER, BY REGION, 2021-2031 (REVENUE, $THOUSAND)
- TABLE 6. CRISTOBALITE MARKET FOR POWDER, BY REGION, 2021-2031 (VOLUME, TONS)
- TABLE 7. GLOBAL CRISTOBALITE MARKET, BY APPLICATION, 2021-2031 (REVENUE, $THOUSAND)
- TABLE 8. GLOBAL CRISTOBALITE MARKET, BY APPLICATION, 2021-2031 (VOLUME, TONS)
- TABLE 9. CRISTOBALITE MARKET FOR GLASS AND CERMAIC, BY REGION, 2021-2031 (REVENUE, $THOUSAND)
- TABLE 10. CRISTOBALITE MARKET FOR GLASS AND CERMAIC, BY REGION, 2021-2031 (VOLUME, TONS)
- TABLE 11. CRISTOBALITE MARKET FOR BUILDING AND CONSTRUCTION ACTIVITIES, BY REGION, 2021-2031 (REVENUE, $THOUSAND)
- TABLE 12. CRISTOBALITE MARKET FOR BUILDING AND CONSTRUCTION ACTIVITIES, BY REGION, 2021-2031 (VOLUME, TONS)
- TABLE 13. CRISTOBALITE MARKET FOR PAINTS AND COATINGS, BY REGION, 2021-2031 (REVENUE, $THOUSAND)
- TABLE 14. CRISTOBALITE MARKET FOR PAINTS AND COATINGS, BY REGION, 2021-2031 (VOLUME, TONS)
- TABLE 15. CRISTOBALITE MARKET FOR FOUNDRY, BY REGION, 2021-2031 (REVENUE, $THOUSAND)
- TABLE 16. CRISTOBALITE MARKET FOR FOUNDRY, BY REGION, 2021-2031 (VOLUME, TONS)
- TABLE 17. CRISTOBALITE MARKET FOR OTHERS, BY REGION, 2021-2031 (REVENUE, $THOUSAND)
- TABLE 18. CRISTOBALITE MARKET FOR OTHERS, BY REGION, 2021-2031 (VOLUME, TONS)
- TABLE 19. CRISTOBALITE MARKET, BY REGION, 2021-2031 (REVENUE, $THOUSAND)
- TABLE 20. CRISTOBALITE MARKET, BY REGION, 2021-2031 (VOLUME, TONS)
- TABLE 21. NORTH AMERICA CRISTOBALITE MARKET, BY FORM, 2021-2031 (REVENUE, $THOUSAND)
- TABLE 22. NORTH AMERICA CRISTOBALITE MARKET, BY FORM, 2021-2031 (VOLUME, TONS)
- TABLE 23. NORTH AMERICA CRISTOBALITE MARKET, BY APPLICATION, 2021-2031 (REVENUE, $THOUSAND)
- TABLE 24. NORTH AMERICA CRISTOBALITE MARKET, BY APPLICATION, 2021-2031 (VOLUME, TONS)
- TABLE 25. NORTH AMERICA CRISTOBALITE MARKET, BY COUNTRY, 2021-2031 (REVENUE, $THOUSAND)
- TABLE 26. NORTH AMERICA CRISTOBALITE MARKET, BY COUNTRY, 2021-2031 (VOLUME, TONS)
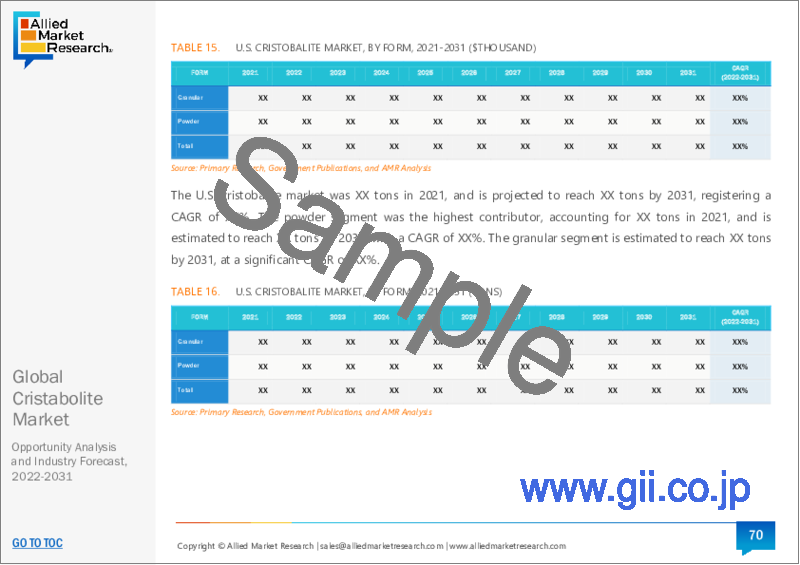
- TABLE 27. U.S. CRISTOBALITE MARKET, BY FORM, 2021-2031 (REVENUE, $THOUSAND)
- TABLE 28. U.S. CRISTOBALITE MARKET, BY FORM, 2021-2031 (VOLUME, TONS)
- TABLE 29. U.S. CRISTOBALITE MARKET, BY APPLICATION, 2021-2031 (REVENUE, $THOUSAND)
- TABLE 30. U.S. CRISTOBALITE MARKET, BY APPLICATION, 2021-2031 (VOLUME, TONS)
- TABLE 31. CANADA CRISTOBALITE MARKET, BY FORM, 2021-2031 (REVENUE, $THOUSAND)
- TABLE 32. CANADA CRISTOBALITE MARKET, BY FORM, 2021-2031 (VOLUME, TONS)
- TABLE 33. CANADA CRISTOBALITE MARKET, BY APPLICATION, 2021-2031 (REVENUE, $THOUSAND)
- TABLE 34. CANADA CRISTOBALITE MARKET, BY APPLICATION, 2021-2031 (VOLUME, TONS)
- TABLE 35. MEXICO CRISTOBALITE MARKET, BY FORM, 2021-2031 (REVENUE, $THOUSAND)
- TABLE 36. MEXICO CRISTOBALITE MARKET, BY FORM, 2021-2031 (VOLUME, TONS)
- TABLE 37. MEXICO CRISTOBALITE MARKET, BY APPLICATION, 2021-2031 (REVENUE, $THOUSAND)
- TABLE 38. MEXICO CRISTOBALITE MARKET, BY APPLICATION, 2021-2031 (VOLUME, TONS)
- TABLE 39. EUROPE CRISTOBALITE MARKET, BY FORM, 2021-2031 (REVENUE, $THOUSAND)
- TABLE 40. EUROPE CRISTOBALITE MARKET, BY FORM, 2021-2031 (VOLUME, TONS)
- TABLE 41. EUROPE CRISTOBALITE MARKET, BY APPLICATION, 2021-2031 (REVENUE, $THOUSAND)
- TABLE 42. EUROPE CRISTOBALITE MARKET, BY APPLICATION, 2021-2031 (VOLUME, TONS)
- TABLE 43. EUROPE CRISTOBALITE MARKET, BY COUNTRY, 2021-2031 (REVENUE, $THOUSAND)
- TABLE 44. EUROPE CRISTOBALITE MARKET, BY COUNTRY, 2021-2031 (VOLUME, TONS)
- TABLE 45. GERMANY CRISTOBALITE MARKET, BY FORM, 2021-2031 (REVENUE, $THOUSAND)
- TABLE 46. GERMANY CRISTOBALITE MARKET, BY FORM, 2021-2031 (VOLUME, TONS)
- TABLE 47. GERMANY CRISTOBALITE MARKET, BY APPLICATION, 2021-2031 (REVENUE, $THOUSAND)
- TABLE 48. GERMANY CRISTOBALITE MARKET, BY APPLICATION, 2021-2031 (VOLUME, TONS)
- TABLE 49. UK CRISTOBALITE MARKET, BY FORM, 2021-2031 (REVENUE, $THOUSAND)
- TABLE 50. UK CRISTOBALITE MARKET, BY FORM, 2021-2031 (VOLUME, TONS)
- TABLE 51. UK CRISTOBALITE MARKET, BY APPLICATION, 2021-2031 (REVENUE, $THOUSAND)
- TABLE 52. UK CRISTOBALITE MARKET, BY APPLICATION, 2021-2031 (VOLUME, TONS)
- TABLE 53. FRANCE CRISTOBALITE MARKET, BY FORM, 2021-2031 (REVENUE, $THOUSAND)
- TABLE 54. FRANCE CRISTOBALITE MARKET, BY FORM, 2021-2031 (VOLUME, TONS)
- TABLE 55. FRANCE CRISTOBALITE MARKET, BY APPLICATION, 2021-2031 (REVENUE, $THOUSAND)
- TABLE 56. FRANCE CRISTOBALITE MARKET, BY APPLICATION, 2021-2031 (VOLUME, TONS)
- TABLE 57. SPAIN CRISTOBALITE MARKET, BY FORM, 2021-2031 (REVENUE, $THOUSAND)
- TABLE 58. SPAIN CRISTOBALITE MARKET, BY FORM, 2021-2031 (VOLUME, TONS)
- TABLE 59. SPAIN CRISTOBALITE MARKET, BY APPLICATION, 2021-2031 (REVENUE, $THOUSAND)
- TABLE 60. SPAIN CRISTOBALITE MARKET, BY APPLICATION, 2021-2031 (VOLUME, TONS)
- TABLE 61. ITALY CRISTOBALITE MARKET, BY FORM, 2021-2031 (REVENUE, $THOUSAND)
- TABLE 62. ITALY CRISTOBALITE MARKET, BY FORM, 2021-2031 (VOLUME, TONS)
- TABLE 63. ITALY CRISTOBALITE MARKET, BY APPLICATION, 2021-2031 (REVENUE, $THOUSAND)
- TABLE 64. ITALY CRISTOBALITE MARKET, BY APPLICATION, 2021-2031 (VOLUME, TONS)
- TABLE 65. REST OF EUROPE CRISTOBALITE MARKET, BY FORM, 2021-2031 (REVENUE, $THOUSAND)
- TABLE 66. REST OF EUROPE CRISTOBALITE MARKET, BY FORM, 2021-2031 (VOLUME, TONS)
- TABLE 67. REST OF EUROPE CRISTOBALITE MARKET, BY APPLICATION, 2021-2031 (REVENUE, $THOUSAND)
- TABLE 68. REST OF EUROPE CRISTOBALITE MARKET, BY APPLICATION, 2021-2031 (VOLUME, TONS)
- TABLE 69. ASIA-PACIFIC CRISTOBALITE MARKET, BY FORM, 2021-2031 (REVENUE, $THOUSAND)
- TABLE 70. ASIA-PACIFIC CRISTOBALITE MARKET, BY FORM, 2021-2031 (VOLUME, TONS)
- TABLE 71. ASIA-PACIFIC CRISTOBALITE MARKET, BY APPLICATION, 2021-2031 (REVENUE, $THOUSAND)
- TABLE 72. ASIA-PACIFIC CRISTOBALITE MARKET, BY APPLICATION, 2021-2031 (VOLUME, TONS)
- TABLE 73. ASIA-PACIFIC CRISTOBALITE MARKET, BY COUNTRY, 2021-2031 (REVENUE, $THOUSAND)
- TABLE 74. ASIA-PACIFIC CRISTOBALITE MARKET, BY COUNTRY, 2021-2031 (VOLUME, TONS)
- TABLE 75. CHINA CRISTOBALITE MARKET, BY FORM, 2021-2031 (REVENUE, $THOUSAND)
- TABLE 76. CHINA CRISTOBALITE MARKET, BY FORM, 2021-2031 (VOLUME, TONS)
- TABLE 77. CHINA CRISTOBALITE MARKET, BY APPLICATION, 2021-2031 (REVENUE, $THOUSAND)
- TABLE 78. CHINA CRISTOBALITE MARKET, BY APPLICATION, 2021-2031 (VOLUME, TONS)
- TABLE 79. INDIA CRISTOBALITE MARKET, BY FORM, 2021-2031 (REVENUE, $THOUSAND)
- TABLE 80. INDIA CRISTOBALITE MARKET, BY FORM, 2021-2031 (VOLUME, TONS)
- TABLE 81. INDIA CRISTOBALITE MARKET, BY APPLICATION, 2021-2031 (REVENUE, $THOUSAND)
- TABLE 82. INDIA CRISTOBALITE MARKET, BY APPLICATION, 2021-2031 (VOLUME, TONS)
- TABLE 83. JAPAN CRISTOBALITE MARKET, BY FORM, 2021-2031 (REVENUE, $THOUSAND)
- TABLE 84. JAPAN CRISTOBALITE MARKET, BY FORM, 2021-2031 (VOLUME, TONS)
- TABLE 85. JAPAN CRISTOBALITE MARKET, BY APPLICATION, 2021-2031 (REVENUE, $THOUSAND)
- TABLE 86. JAPAN CRISTOBALITE MARKET, BY APPLICATION, 2021-2031 (VOLUME, TONS)
- TABLE 87. SOUTH KOREA CRISTOBALITE MARKET, BY FORM, 2021-2031 (REVENUE, $THOUSAND)
- TABLE 88. SOUTH KOREA CRISTOBALITE MARKET, BY FORM, 2021-2031 (VOLUME, TONS)
- TABLE 89. SOUTH KOREA CRISTOBALITE MARKET, BY APPLICATION, 2021-2031 (REVENUE, $THOUSAND)
- TABLE 90. SOUTH KOREA CRISTOBALITE MARKET, BY APPLICATION, 2021-2031 (VOLUME, TONS)
- TABLE 91. AUSTRALIA CRISTOBALITE MARKET, BY FORM, 2021-2031 (REVENUE, $THOUSAND)
- TABLE 92. AUSTRALIA CRISTOBALITE MARKET, BY FORM, 2021-2031 (VOLUME, TONS)
- TABLE 93. AUSTRALIA CRISTOBALITE MARKET, BY APPLICATION, 2021-2031 (REVENUE, $THOUSAND)
- TABLE 94. AUSTRALIA CRISTOBALITE MARKET, BY APPLICATION, 2021-2031 (VOLUME, TONS)
- TABLE 95. REST OF ASIA-PACIFIC CRISTOBALITE MARKET, BY FORM, 2021-2031 (REVENUE, $THOUSAND)
- TABLE 96. REST OF ASIA-PACIFIC CRISTOBALITE MARKET, BY FORM, 2021-2031 (VOLUME, TONS)
- TABLE 97. REST OF ASIA-PACIFIC CRISTOBALITE MARKET, BY APPLICATION, 2021-2031 (REVENUE, $THOUSAND)
- TABLE 98. REST OF ASIA-PACIFIC CRISTOBALITE MARKET, BY APPLICATION, 2021-2031 (VOLUME, TONS)
- TABLE 99. LAMEA CRISTOBALITE MARKET, BY FORM, 2021-2031 (REVENUE, $THOUSAND)
- TABLE 100. LAMEA CRISTOBALITE MARKET, BY FORM, 2021-2031 (VOLUME, TONS)
- TABLE 101. LAMEA CRISTOBALITE MARKET, BY APPLICATION, 2021-2031 (REVENUE, $THOUSAND)
- TABLE 102. LAMEA CRISTOBALITE MARKET, BY APPLICATION, 2021-2031 (VOLUME, TONS)
- TABLE 103. LAMEA CRISTOBALITE MARKET, BY COUNTRY, 2021-2031 (REVENUE, $THOUSAND)
- TABLE 104. LAMEA CRISTOBALITE MARKET, BY COUNTRY, 2021-2031 (VOLUME, TONS)
- TABLE 105. BRAZIL CRISTOBALITE MARKET, BY FORM, 2021-2031 (REVENUE, $THOUSAND)
- TABLE 106. BRAZIL CRISTOBALITE MARKET, BY FORM, 2021-2031 (VOLUME, TONS)
- TABLE 107. BRAZIL CRISTOBALITE MARKET, BY APPLICATION, 2021-2031 (REVENUE, $THOUSAND)
- TABLE 108. BRAZIL CRISTOBALITE MARKET, BY APPLICATION, 2021-2031 (VOLUME, TONS)
- TABLE 109. SAUDI ARABIA CRISTOBALITE MARKET, BY FORM, 2021-2031 (REVENUE, $THOUSAND)
- TABLE 110. SAUDI ARABIA CRISTOBALITE MARKET, BY FORM, 2021-2031 (VOLUME, TONS)
- TABLE 111. SAUDI ARABIA CRISTOBALITE MARKET, BY APPLICATION, 2021-2031 (REVENUE, $THOUSAND)
- TABLE 112. SAUDI ARABIA CRISTOBALITE MARKET, BY APPLICATION, 2021-2031 (VOLUME, TONS)
- TABLE 113. SOUTH AFRICA CRISTOBALITE MARKET, BY FORM, 2021-2031 (REVENUE, $THOUSAND)
- TABLE 114. SOUTH AFRICA CRISTOBALITE MARKET, BY FORM, 2021-2031 (VOLUME, TONS)
- TABLE 115. SOUTH AFRICA CRISTOBALITE MARKET, BY APPLICATION, 2021-2031 (REVENUE, $THOUSAND)
- TABLE 116. SOUTH AFRICA CRISTOBALITE MARKET, BY APPLICATION, 2021-2031 (VOLUME, TONS)
- TABLE 117. REST OF LAMEA CRISTOBALITE MARKET, BY FORM, 2021-2031 (REVENUE, $THOUSAND)
- TABLE 118. REST OF LAMEA CRISTOBALITE MARKET, BY FORM, 2021-2031 (VOLUME, TONS)
- TABLE 119. REST OF LAMEA CRISTOBALITE MARKET, BY APPLICATION, 2021-2031 (REVENUE, $THOUSAND)
- TABLE 120. REST OF LAMEA CRISTOBALITE MARKET, BY APPLICATION, 2021-2031 (VOLUME, TONS)
- TABLE 121.C.E.D. PROCESS MINERALS, INC: KEY EXECUTIVES
- TABLE 121.C.E.D. PROCESS MINERALS, INC: COMPANY SNAPSHOT
- TABLE 122.C.E.D. PROCESS MINERALS, INC: OPERATING SEGMENTS
- TABLE 123.C.E.D. PROCESS MINERALS, INC: PRODUCT PORTFOLIO
- TABLE 124.C.E.D. PROCESS MINERALS, INC: NET SALES
- TABLE 125.C.E.D. PROCESS MINERALS, INC: KEY STRATERGIES
- TABLE 127.GOYAL GROUP OF MINERALS: KEY EXECUTIVES
- TABLE 127.GOYAL GROUP OF MINERALS: COMPANY SNAPSHOT
- TABLE 128.GOYAL GROUP OF MINERALS: OPERATING SEGMENTS
- TABLE 129.GOYAL GROUP OF MINERALS: PRODUCT PORTFOLIO
- TABLE 130.GOYAL GROUP OF MINERALS: NET SALES
- TABLE 131.GOYAL GROUP OF MINERALS: KEY STRATERGIES
- TABLE 133.GRENZEBACH GROUP: KEY EXECUTIVES
- TABLE 133.GRENZEBACH GROUP: COMPANY SNAPSHOT
- TABLE 134.GRENZEBACH GROUP: OPERATING SEGMENTS
- TABLE 135.GRENZEBACH GROUP: PRODUCT PORTFOLIO
- TABLE 136.GRENZEBACH GROUP: NET SALES
- TABLE 137.GRENZEBACH GROUP: KEY STRATERGIES
- TABLE 139.MOMENTIVE TECHNOLOGIES: KEY EXECUTIVES
- TABLE 139.MOMENTIVE TECHNOLOGIES: COMPANY SNAPSHOT
- TABLE 140.MOMENTIVE TECHNOLOGIES: OPERATING SEGMENTS
- TABLE 141.MOMENTIVE TECHNOLOGIES: PRODUCT PORTFOLIO
- TABLE 142.MOMENTIVE TECHNOLOGIES: NET SALES
- TABLE 143.MOMENTIVE TECHNOLOGIES: KEY STRATERGIES
- TABLE 145.HOBEN INTERNATIONAL LIMITED: KEY EXECUTIVES
- TABLE 145.HOBEN INTERNATIONAL LIMITED: COMPANY SNAPSHOT
- TABLE 146.HOBEN INTERNATIONAL LIMITED: OPERATING SEGMENTS
- TABLE 147.HOBEN INTERNATIONAL LIMITED: PRODUCT PORTFOLIO
- TABLE 148.HOBEN INTERNATIONAL LIMITED: NET SALES
- TABLE 149.HOBEN INTERNATIONAL LIMITED: KEY STRATERGIES
- TABLE 151.QUARTZ WORKS GMBH: KEY EXECUTIVES
- TABLE 151.QUARTZ WORKS GMBH: COMPANY SNAPSHOT
- TABLE 152.QUARTZ WORKS GMBH: OPERATING SEGMENTS
- TABLE 153.QUARTZ WORKS GMBH: PRODUCT PORTFOLIO
- TABLE 154.QUARTZ WORKS GMBH: NET SALES
- TABLE 155.QUARTZ WORKS GMBH: KEY STRATERGIES
- TABLE 157.SIBELCO,: KEY EXECUTIVES
- TABLE 157.SIBELCO,: COMPANY SNAPSHOT
- TABLE 158.SIBELCO,: OPERATING SEGMENTS
- TABLE 159.SIBELCO,: PRODUCT PORTFOLIO
- TABLE 160.SIBELCO,: NET SALES
- TABLE 161.SIBELCO,: KEY STRATERGIES
- TABLE 163.GOLDSTAR POWDERS PVT. LTD: KEY EXECUTIVES
- TABLE 163.GOLDSTAR POWDERS PVT. LTD: COMPANY SNAPSHOT
- TABLE 164.GOLDSTAR POWDERS PVT. LTD: OPERATING SEGMENTS
- TABLE 165.GOLDSTAR POWDERS PVT. LTD: PRODUCT PORTFOLIO
- TABLE 166.GOLDSTAR POWDERS PVT. LTD: NET SALES
- TABLE 167.GOLDSTAR POWDERS PVT. LTD: KEY STRATERGIES
- TABLE 169.DINGLONG QUARTZ LIMITED: KEY EXECUTIVES
- TABLE 169.DINGLONG QUARTZ LIMITED: COMPANY SNAPSHOT
- TABLE 170.DINGLONG QUARTZ LIMITED: OPERATING SEGMENTS
- TABLE 171.DINGLONG QUARTZ LIMITED: PRODUCT PORTFOLIO
- TABLE 172.DINGLONG QUARTZ LIMITED: NET SALES
- TABLE 173.DINGLONG QUARTZ LIMITED: KEY STRATERGIES
- TABLE 175.SILMER: KEY EXECUTIVES
- TABLE 175.SILMER: COMPANY SNAPSHOT
- TABLE 176.SILMER: OPERATING SEGMENTS
- TABLE 177.SILMER: PRODUCT PORTFOLIO
- TABLE 178.SILMER: NET SALES
- TABLE 179.SILMER: KEY STRATERGIES
LIST OF FIGURES
- FIGURE 1. SEGMENTATION OF CRISTOBALITE MARKET,2021-2031
- FIGURE 2.CRISTOBALITE MARKET,2021-2031
- FIGURE 3. TOP INVESTMENT POCKETS, BY REGION
- FIGURE 4.PORTER FIVE-1
- FIGURE 5.PORTER FIVE-2
- FIGURE 6.PORTER FIVE-3
- FIGURE 7.PORTER FIVE-4
- FIGURE 8.PORTER FIVE-5
- FIGURE 9.CRISTOBALITE MARKET:DRIVERS, RESTRAINTS AND OPPORTUNITIES
- FIGURE 10.PRICING ANALYSIS
- FIGURE 11.VALUE CHAIN ANALYSIS
- FIGURE 12.PATENT ANALYSIS BY COMPANY
- FIGURE 13.PATENT ANALYSIS BY COUNTRY
- FIGURE 14.CRISTOBALITE MARKET,BY FORM,2021(%)
- FIGURE 15.COMPARATIVE SHARE ANALYSIS OF GRANULAR CRISTOBALITE MARKET, 2021 AND 2031(%)
- FIGURE 16.COMPARATIVE SHARE ANALYSIS OF POWDER CRISTOBALITE MARKET, 2021 AND 2031(%)
- FIGURE 17.CRISTOBALITE MARKET,BY APPLICATION,2021(%)
- FIGURE 18.COMPARATIVE SHARE ANALYSIS OF GLASS AND CERMAIC CRISTOBALITE MARKET, 2021 AND 2031(%)
- FIGURE 19.COMPARATIVE SHARE ANALYSIS OF BUILDING AND CONSTRUCTION ACTIVITIES CRISTOBALITE MARKET, 2021 AND 2031(%)
- FIGURE 20.COMPARATIVE SHARE ANALYSIS OF PAINTS AND COATINGS CRISTOBALITE MARKET, 2021 AND 2031(%)
- FIGURE 21.COMPARATIVE SHARE ANALYSIS OF FOUNDRY CRISTOBALITE MARKET, 2021 AND 2031(%)
- FIGURE 22.COMPARATIVE SHARE ANALYSIS OF OTHERS CRISTOBALITE MARKET, 2021 AND 2031(%)
- FIGURE 23.CRISTOBALITE MARKET BY REGION,2021
- FIGURE 24.U.S. CRISTOBALITE MARKET,2021-2031($THOUSAND)
- FIGURE 25.CANADA CRISTOBALITE MARKET,2021-2031($THOUSAND)
- FIGURE 26.MEXICO CRISTOBALITE MARKET,2021-2031($THOUSAND)
- FIGURE 27.GERMANY CRISTOBALITE MARKET,2021-2031($THOUSAND)
- FIGURE 28.UK CRISTOBALITE MARKET,2021-2031($THOUSAND)
- FIGURE 29.FRANCE CRISTOBALITE MARKET,2021-2031($THOUSAND)
- FIGURE 30.SPAIN CRISTOBALITE MARKET,2021-2031($THOUSAND)
- FIGURE 31.ITALY CRISTOBALITE MARKET,2021-2031($THOUSAND)
- FIGURE 32.REST OF EUROPE CRISTOBALITE MARKET,2021-2031($THOUSAND)
- FIGURE 33.CHINA CRISTOBALITE MARKET,2021-2031($THOUSAND)
- FIGURE 34.INDIA CRISTOBALITE MARKET,2021-2031($THOUSAND)
- FIGURE 35.JAPAN CRISTOBALITE MARKET,2021-2031($THOUSAND)
- FIGURE 36.SOUTH KOREA CRISTOBALITE MARKET,2021-2031($THOUSAND)
- FIGURE 37.AUSTRALIA CRISTOBALITE MARKET,2021-2031($THOUSAND)
- FIGURE 38.REST OF ASIA-PACIFIC CRISTOBALITE MARKET,2021-2031($THOUSAND)
- FIGURE 39.BRAZIL CRISTOBALITE MARKET,2021-2031($THOUSAND)
- FIGURE 40.SAUDI ARABIA CRISTOBALITE MARKET,2021-2031($THOUSAND)
- FIGURE 41.SOUTH AFRICA CRISTOBALITE MARKET,2021-2031($THOUSAND)
- FIGURE 42.REST OF LAMEA CRISTOBALITE MARKET,2021-2031($THOUSAND)
- FIGURE 43. TOP WINNING STRATEGIES, BY YEAR
- FIGURE 44. TOP WINNING STRATEGIES, BY DEVELOPMENT
- FIGURE 45. TOP WINNING STRATEGIES, BY COMPANY
- FIGURE 46.PRODUCT MAPPING OF TOP 10 PLAYERS
- FIGURE 47.COMPETITIVE DASHBOARD
- FIGURE 48.COMPETITIVE HEATMAP OF TOP 10 KEY PLAYERS
- FIGURE 49.TOP PLAYER POSITIONING, 2021
- FIGURE 50.C.E.D. PROCESS MINERALS, INC.: NET SALES ($THOUSAND)
- FIGURE 51.GOYAL GROUP OF MINERALS.: NET SALES ($THOUSAND)
- FIGURE 52.GRENZEBACH GROUP.: NET SALES ($THOUSAND)
- FIGURE 53.MOMENTIVE TECHNOLOGIES.: NET SALES ($THOUSAND)
- FIGURE 54.HOBEN INTERNATIONAL LIMITED.: NET SALES ($THOUSAND)
- FIGURE 55.QUARTZ WORKS GMBH.: NET SALES ($THOUSAND)
- FIGURE 56.SIBELCO,.: NET SALES ($THOUSAND)
- FIGURE 57.GOLDSTAR POWDERS PVT. LTD.: NET SALES ($THOUSAND)
- FIGURE 58.DINGLONG QUARTZ LIMITED.: NET SALES ($THOUSAND)
- FIGURE 59.SILMER.: NET SALES ($THOUSAND)
The global cristobalite market was valued at $36.3 million in 2021, and is projected to reach $56.6 million by 2031, growing at a CAGR of 4.6% from 2022 to 2031.
Cristobalite is a mineral polymorph of silica that is obtained at 1,500°C through calcination and iron-free grinding process. Cristobalite is found in sufficient quantities in nature mainly in volcanic rocks. It is synthetically produced from sand by heating a kiln at 1500 degree centigrade for commercial purposes. It is mainly offered in the form of powered/ sand and grain form. Cristobalite has a wide range of applications in various end-use industries including architecture, paints and coatings, metal casting, industrial, ceramic, and fiberglass industries, and others.
Increase in global population, improvement in standard of living, rise in purchasing power of consumer have led them to seek for unique construction material for designing their homes. Ceramics are one of the distinctive materials used in both residential and commercial construction including tiles, washbasins, kitchen countertops, and others where grounded cristobalite is used extensively as glassifying and melting agent. In addition, it helps in maintaining the melting point in respectable ranges and gives hardness to ceramics and helps in decrease their thermal expansion capacity. Therefore, the demand for cristobalite has increased in the growing ceramic industry.
However, workers and manufacturers get habitual exposure to powder form of cristobalite in industrial sector that may lead to risk of developing acute and chronic disease such as silicosis, lungs disease, cancer, and others. For instance, according to an article published by the National Institute for Occupational Safety and Health (NIOSH) in April 2022, it has set some standards and regulation on use of cristobalite due to which manufacturers have switched their production capacities to lower extent. This is predicted to hamper the growth of the cristobalite market.
On the contrary, production of cristobalite consumes high energy hence, the company named as Grenzebach Group follows tailor-made technology, and state-of-the-art technology for energy efficiency processes where energy costs can be cut and resource consumption can be sustainably reduced. The adoption of sustainable technology will boost the potential sales of the cristobalite market; thus, offering lucrative opportunities for the market.
The cristobalite market is segmented on the basis of form, application, and region. On the basis of type, the market is categorized into granular and powder. On the basis of applications, it is divided into glass and ceramic, building and construction activities, paints and coatings, foundry, and others. Region-wise, the market is studied across North America, Europe, Asia-Pacific, and LAMEA. The major companies profiled in this report include C.E.D. Process Minerals, Inc., Dinglong Quartz Limited, Goldstar Powders Pvt. Ltd, Goyal Group Of Minerals, GRENZEBACH GROUP, Hoben International Limited, Momentive Technologies, Quartz work GmbH, Sibelco, and SILMER.
Report key highlighters
The granular form of segment is projected to grow faster and account for 40% of the major share in cristobalite market during 2031.
The paints and coatings application segment is the second fastest growing application segment in the cristobalite market and growing at CAGR of 4.3%.
North America accounts for 25% of the total market share in 2021 and it is projected to grow at CAGR of 4.0% during the forecast period.
Countries such as China, U.S., India, Germany, and Brazil hold a significant share in the global cristobalite market.
Key Benefits For Stakeholders
- This report provides a quantitative analysis of the market segments, current trends, estimations, and dynamics of the cristobalite market analysis from 2021 to 2031 to identify the prevailing cristobalite market opportunities.
- The market research is offered along with information related to key drivers, restraints, and opportunities.
- Porter's five forces analysis highlights the potency of buyers and suppliers to enable stakeholders make profit-oriented business decisions and strengthen their supplier-buyer network.
- In-depth analysis of the cristobalite market segmentation assists to determine the prevailing market opportunities.
- Major countries in each region are mapped according to their revenue contribution to the global market.
- Market player positioning facilitates benchmarking and provides a clear understanding of the present position of the market players.
- The report includes the analysis of the regional as well as global cristobalite market trends, key players, market segments, application areas, and market growth strategies.
Key Market Segments
By Form
- Granular
- Powder
By Application
- Glass and Cermaic
- Building and Construction activities
- Paints and Coatings
- Foundry
- Others
By Region
- North America
- U.S.
- Canada
- Mexico
- Europe
- Germany
- UK
- France
- Spain
- Italy
- Rest of Europe
- Asia-Pacific
- China
- India
- Japan
- South Korea
- Australia
- Rest of Asia-Pacific
- LAMEA
- Brazil
- Saudi Arabia
- South Africa
- Rest of LAMEA
- Key Market Players
- C.E.D. Process Minerals, Inc
- Momentive Technologies
- Goyal Group Of Minerals
- GRENZEBACH GROUP
- Hoben International Limited
- Quartz Works GmbH
- Sibelco,
- Goldstar Powders Pvt. Ltd
- Dinglong Quartz Limited
- SILMER
TABLE OF CONTENTS
CHAPTER 1:INTRODUCTION
- 1.1.Report description
- 1.2.Key market segments
- 1.3.Key benefits to the stakeholders
- 1.4.Research Methodology
- 1.4.1.Secondary research
- 1.4.2.Primary research
- 1.4.3.Analyst tools and models
CHAPTER 2:EXECUTIVE SUMMARY
- 2.1.Key findings of the study
- 2.2.CXO Perspective
CHAPTER 3:MARKET OVERVIEW
- 3.1.Market definition and scope
- 3.2.Key findings
- 3.2.1.Top investment pockets
- 3.3.Porter's five forces analysis
- 3.4.Market dynamics
- 3.4.1.Drivers
- 3.4.1.1. bcnsghaafasf
- 3.4.1.2. jzsvjxhvjhv
- 3.4.2.Restraints
- 3.4.2.1. smdvbdsjvh
- 3.4.3.Opportunities
- 3.4.3.1. zjnbfjsdbdskj
- 3.4.3.2. mcbzjhzjkhvd
- 3.4.1.Drivers
- 3.5.COVID-19 Impact Analysis on the market
- 3.6.Pricing Analysis
- 3.7.Value Chain Analysis
- 3.8.Patent Landscape
CHAPTER 4: CRISTOBALITE MARKET, BY FORM
- 4.1 Overview
- 4.1.1 Market size and forecast
- 4.2 Granular
- 4.2.1 Key market trends, growth factors and opportunities
- 4.2.2 Market size and forecast, by region
- 4.2.3 Market share analysis by country
- 4.3 Powder
- 4.3.1 Key market trends, growth factors and opportunities
- 4.3.2 Market size and forecast, by region
- 4.3.3 Market share analysis by country
CHAPTER 5: CRISTOBALITE MARKET, BY APPLICATION
- 5.1 Overview
- 5.1.1 Market size and forecast
- 5.2 Glass and Cermaic
- 5.2.1 Key market trends, growth factors and opportunities
- 5.2.2 Market size and forecast, by region
- 5.2.3 Market share analysis by country
- 5.3 Building and Construction activities
- 5.3.1 Key market trends, growth factors and opportunities
- 5.3.2 Market size and forecast, by region
- 5.3.3 Market share analysis by country
- 5.4 Paints and Coatings
- 5.4.1 Key market trends, growth factors and opportunities
- 5.4.2 Market size and forecast, by region
- 5.4.3 Market share analysis by country
- 5.5 Foundry
- 5.5.1 Key market trends, growth factors and opportunities
- 5.5.2 Market size and forecast, by region
- 5.5.3 Market share analysis by country
- 5.6 Others
- 5.6.1 Key market trends, growth factors and opportunities
- 5.6.2 Market size and forecast, by region
- 5.6.3 Market share analysis by country
CHAPTER 6: CRISTOBALITE MARKET, BY REGION
- 6.1 Overview
- 6.1.1 Market size and forecast
- 6.2 North America
- 6.2.1 Key trends and opportunities
- 6.2.2 North America Market size and forecast, by Form
- 6.2.3 North America Market size and forecast, by Application
- 6.2.4 North America Market size and forecast, by country
- 6.2.4.1 U.S.
- 6.2.4.1.1 Key market trends, growth factors and opportunities
- 6.2.4.1.2 Market size and forecast, by Form
- 6.2.4.1.3 Market size and forecast, by Application
- 6.2.4.2 Canada
- 6.2.4.2.1 Key market trends, growth factors and opportunities
- 6.2.4.2.2 Market size and forecast, by Form
- 6.2.4.2.3 Market size and forecast, by Application
- 6.2.4.3 Mexico
- 6.2.4.3.1 Key market trends, growth factors and opportunities
- 6.2.4.3.2 Market size and forecast, by Form
- 6.2.4.3.3 Market size and forecast, by Application
- 6.3 Europe
- 6.3.1 Key trends and opportunities
- 6.3.2 Europe Market size and forecast, by Form
- 6.3.3 Europe Market size and forecast, by Application
- 6.3.4 Europe Market size and forecast, by country
- 6.3.4.1 Germany
- 6.3.4.1.1 Key market trends, growth factors and opportunities
- 6.3.4.1.2 Market size and forecast, by Form
- 6.3.4.1.3 Market size and forecast, by Application
- 6.3.4.2 UK
- 6.3.4.2.1 Key market trends, growth factors and opportunities
- 6.3.4.2.2 Market size and forecast, by Form
- 6.3.4.2.3 Market size and forecast, by Application
- 6.3.4.3 France
- 6.3.4.3.1 Key market trends, growth factors and opportunities
- 6.3.4.3.2 Market size and forecast, by Form
- 6.3.4.3.3 Market size and forecast, by Application
- 6.3.4.4 Spain
- 6.3.4.4.1 Key market trends, growth factors and opportunities
- 6.3.4.4.2 Market size and forecast, by Form
- 6.3.4.4.3 Market size and forecast, by Application
- 6.3.4.5 Italy
- 6.3.4.5.1 Key market trends, growth factors and opportunities
- 6.3.4.5.2 Market size and forecast, by Form
- 6.3.4.5.3 Market size and forecast, by Application
- 6.3.4.6 Rest of Europe
- 6.3.4.6.1 Key market trends, growth factors and opportunities
- 6.3.4.6.2 Market size and forecast, by Form
- 6.3.4.6.3 Market size and forecast, by Application
- 6.4 Asia-Pacific
- 6.4.1 Key trends and opportunities
- 6.4.2 Asia-Pacific Market size and forecast, by Form
- 6.4.3 Asia-Pacific Market size and forecast, by Application
- 6.4.4 Asia-Pacific Market size and forecast, by country
- 6.4.4.1 China
- 6.4.4.1.1 Key market trends, growth factors and opportunities
- 6.4.4.1.2 Market size and forecast, by Form
- 6.4.4.1.3 Market size and forecast, by Application
- 6.4.4.2 India
- 6.4.4.2.1 Key market trends, growth factors and opportunities
- 6.4.4.2.2 Market size and forecast, by Form
- 6.4.4.2.3 Market size and forecast, by Application
- 6.4.4.3 Japan
- 6.4.4.3.1 Key market trends, growth factors and opportunities
- 6.4.4.3.2 Market size and forecast, by Form
- 6.4.4.3.3 Market size and forecast, by Application
- 6.4.4.4 South Korea
- 6.4.4.4.1 Key market trends, growth factors and opportunities
- 6.4.4.4.2 Market size and forecast, by Form
- 6.4.4.4.3 Market size and forecast, by Application
- 6.4.4.5 Australia
- 6.4.4.5.1 Key market trends, growth factors and opportunities
- 6.4.4.5.2 Market size and forecast, by Form
- 6.4.4.5.3 Market size and forecast, by Application
- 6.4.4.6 Rest of Asia-Pacific
- 6.4.4.6.1 Key market trends, growth factors and opportunities
- 6.4.4.6.2 Market size and forecast, by Form
- 6.4.4.6.3 Market size and forecast, by Application
- 6.5 LAMEA
- 6.5.1 Key trends and opportunities
- 6.5.2 LAMEA Market size and forecast, by Form
- 6.5.3 LAMEA Market size and forecast, by Application
- 6.5.4 LAMEA Market size and forecast, by country
- 6.5.4.1 Brazil
- 6.5.4.1.1 Key market trends, growth factors and opportunities
- 6.5.4.1.2 Market size and forecast, by Form
- 6.5.4.1.3 Market size and forecast, by Application
- 6.5.4.2 Saudi Arabia
- 6.5.4.2.1 Key market trends, growth factors and opportunities
- 6.5.4.2.2 Market size and forecast, by Form
- 6.5.4.2.3 Market size and forecast, by Application
- 6.5.4.3 South Africa
- 6.5.4.3.1 Key market trends, growth factors and opportunities
- 6.5.4.3.2 Market size and forecast, by Form
- 6.5.4.3.3 Market size and forecast, by Application
- 6.5.4.4 Rest of LAMEA
- 6.5.4.4.1 Key market trends, growth factors and opportunities
- 6.5.4.4.2 Market size and forecast, by Form
- 6.5.4.4.3 Market size and forecast, by Application
CHAPTER 7: COMPANY LANDSCAPE
- 7.1. Introduction
- 7.2. Top winning strategies
- 7.3. Product Mapping of Top 10 Player
- 7.4. Competitive Dashboard
- 7.5. Competitive Heatmap
- 7.5. Top player positioning, 2021
CHAPTER 8: COMPANY PROFILES
- 8.1 C.E.D. Process Minerals, Inc
- 8.1.1 Company overview
- 8.1.2 Key Executives
- 8.1.3 Company snapshot
- 8.1.4 Operating business segments
- 8.1.5 Product portfolio
- 8.1.6 Business performance
- 8.1.7 Key strategic moves and developments
- 8.2 Goyal Group Of Minerals
- 8.2.1 Company overview
- 8.2.2 Key Executives
- 8.2.3 Company snapshot
- 8.2.4 Operating business segments
- 8.2.5 Product portfolio
- 8.2.6 Business performance
- 8.2.7 Key strategic moves and developments
- 8.3 GRENZEBACH GROUP
- 8.3.1 Company overview
- 8.3.2 Key Executives
- 8.3.3 Company snapshot
- 8.3.4 Operating business segments
- 8.3.5 Product portfolio
- 8.3.6 Business performance
- 8.3.7 Key strategic moves and developments
- 8.4 Momentive Technologies
- 8.4.1 Company overview
- 8.4.2 Key Executives
- 8.4.3 Company snapshot
- 8.4.4 Operating business segments
- 8.4.5 Product portfolio
- 8.4.6 Business performance
- 8.4.7 Key strategic moves and developments
- 8.5 Hoben International Limited
- 8.5.1 Company overview
- 8.5.2 Key Executives
- 8.5.3 Company snapshot
- 8.5.4 Operating business segments
- 8.5.5 Product portfolio
- 8.5.6 Business performance
- 8.5.7 Key strategic moves and developments
- 8.6 Quartz Works GmbH
- 8.6.1 Company overview
- 8.6.2 Key Executives
- 8.6.3 Company snapshot
- 8.6.4 Operating business segments
- 8.6.5 Product portfolio
- 8.6.6 Business performance
- 8.6.7 Key strategic moves and developments
- 8.7 Sibelco,
- 8.7.1 Company overview
- 8.7.2 Key Executives
- 8.7.3 Company snapshot
- 8.7.4 Operating business segments
- 8.7.5 Product portfolio
- 8.7.6 Business performance
- 8.7.7 Key strategic moves and developments
- 8.8 Goldstar Powders Pvt. Ltd
- 8.8.1 Company overview
- 8.8.2 Key Executives
- 8.8.3 Company snapshot
- 8.8.4 Operating business segments
- 8.8.5 Product portfolio
- 8.8.6 Business performance
- 8.8.7 Key strategic moves and developments
- 8.9 Dinglong Quartz Limited
- 8.9.1 Company overview
- 8.9.2 Key Executives
- 8.9.3 Company snapshot
- 8.9.4 Operating business segments
- 8.9.5 Product portfolio
- 8.9.6 Business performance
- 8.9.7 Key strategic moves and developments
- 8.10 SILMER
- 8.10.1 Company overview
- 8.10.2 Key Executives
- 8.10.3 Company snapshot
- 8.10.4 Operating business segments
- 8.10.5 Product portfolio
- 8.10.6 Business performance
- 8.10.7 Key strategic moves and developments