|
|
市場調査レポート
商品コード
1140228
建物建設市場:タイプ別(住宅、非住宅)、建設タイプ別(新築、改築)、用途別(所有、賃貸)、エンドユーザー別(民間、公共) - 世界の機会分析および産業予測、2021-2031年Building Construction Market By Type (Residential, Non-residential), By Construction Type (New Construction, Renovation), By Application (Owned, Rental), By End User (Private, Public): Global Opportunity Analysis and Industry Forecast, 2021-2031 |
||||||
|
|
|||||||


| 建物建設市場:タイプ別(住宅、非住宅)、建設タイプ別(新築、改築)、用途別(所有、賃貸)、エンドユーザー別(民間、公共) - 世界の機会分析および産業予測、2021-2031年 |
|
出版日: 2022年07月01日
発行: Allied Market Research
ページ情報: 英文 242 Pages
納期: 2~3営業日
|
- 全表示
- 概要
- 図表
- 目次
世界の建物建設市場は、2021年に5兆4128億米ドル、2031年には11兆1219億米ドルに達し、2022年から2031年までのCAGRは7.4%を記録すると予測されています。
建築建設市場の範囲は、建物やその他のインフラストラクチャの建設に必要な生コン、プレキャスト製品、部品の販売によって得られる収益が含まれます。建物建設には、新しい建物の建設、建物の解体、既存の建物に必要な改造を行うことが含まれます。
新築プロジェクトや古い建物の再開発・修繕の増加は、建物建設市場の成長の主な原動力となっています。また、特定のグリーン建材の採用は、建設時間の多くを節約するだけでなく、さらに費用対効果の高いソリューションを与え、材料の無駄を回避することができます。さらに、新しい高度な機械とともに製造技術の開拓は、世界中の建物建設市場を牽引しています。
しかし、建設資材の新しい製造施設を最初にセットアップするための高い投資は、市場の成長の抑制要因として作用します。さらに、持続可能な建築資材の使用増加が、建物建設市場の成長を阻害しています。
一方、新興国の市場開拓は、予測期間中、建物建設市場の成長にとって好機となることが期待されます。
目次
第1章 イントロダクション
第2章 エグゼクティブサマリー
第3章 市場の概要
- 市場の定義と範囲
- 主な調査結果
- 主な投資機会
- ポーターのファイブフォース分析
- 主要企業のポジショニング
- 市場力学
- 促進要因
- 抑制要因
- 機会
- COVID-19 影響分析
第4章 建物建設市場:タイプ別
- 概要
- 市場規模・予測
- 住宅分野
- 主な市場動向、成長要因、機会
- 市場規模・予測:地域別
- 市場分析:国別
- 非住宅分野
- 主な市場動向、成長要因、機会
- 市場規模・予測:地域別
- 市場分析:国別
第5章 建物建設市場:建築タイプ別
- 概要
- 市場規模・予測
- 新築工事
- 主な市場動向、成長要因、機会
- 市場規模・予測:地域別
- 市場分析:国別
- リノベーション
- 主な市場動向、成長要因、機会
- 市場規模・予測:地域別
- 市場分析:国別
第6章 建物建設市場:用途別
- 概要
- 市場規模・予測
- 自社保有
- 主な市場動向、成長要因、機会
- 市場規模・予測:地域別
- 市場分析:国別
- レンタル
- 主な市場動向、成長要因、機会
- 市場規模・予測:地域別
- 市場分析:国別
第7章 建物建設市場:エンドユーザー別
- 概要
- 市場規模・予測
- 民間
- 主な市場動向、成長要因と機会
- 市場規模・予測:地域別
- 市場分析:国別分析
- 公共
- 主な市場動向、成長要因、機会
- 市場規模・予測:地域別
- 市場分析:国別
第8章 建物建設市場:地域別
- 概要
- 市場規模・予測
- 北米
- 主な動向と機会
- 北米市場規模推移・予測:タイプ別
- 北米市場規模・予測:建設タイプ別
- 北米市場の市場規模・予測:用途別
- 北米市場の市場規模・予測:エンドユーザー別
- 北米市場の市場規模・予測:国別
- 米国
- カナダ
- メキシコ
- 欧州
- 主な動向と機会
- 欧州の市場規模・予測:タイプ別
- 欧州の市場規模・予測:建設タイプ別
- 欧州市場規模・予測:アプリケーション別
- 欧州市場規模・予測:エンドユーザー別
- 欧州市場規模・予測:国別
- ドイツ
- 英国
- フランス
- イタリア
- その他の欧州地域
- アジア太平洋地域
- 主な動向と機会
- アジア太平洋地域の市場規模・予測:タイプ別
- アジア太平洋地域の市場規模・予測:建設タイプ別
- アジア太平洋地域の市場規模・予測:用途別
- アジア太平洋地域の市場規模・予測:エンドユーザー別
- アジア太平洋地域の市場規模・予測:国別
- 中国
- 日本
- 韓国
- インド
- その他アジア太平洋地域
- LAMEA
- 主な動向と機会
- LAMEAの市場規模・予測:タイプ別
- LAMEAの市場規模・予測:建設タイプ別
- LAMEAの市場規模・予測:アプリケーション別
- LAMEAの市場規模・予測:エンドユーザー別
- LAMEAの市場規模・予測:国別
- ラテンアメリカ
- 中東
- アフリカ
第9章 企業情勢
- イントロダクション
- 主要成功戦略
- 主要10社の製品マッピング
- 競合ダッシュボード
- 競合のヒートマップ
- 主な発展
第10章 企業プロファイル
- ACS
- Bouygues Group
- China State Construction Engineering Corporation Limited
- country garden holdings company limited
- Daiwa House Industry Co., Ltd.
- DLF
- Evergrande Group
- Fluor Corporation
- Godrej Group
- Hochtief AG
- Lennar Corporation
- Metallurgical Corporation of China
- Power Construction Corp. of China
- Shapoorji Pallonji
- Sunac China Holdings Limited
- Vinci
- Skanksa Group
LIST OF TABLES
- TABLE 1. GLOBAL BUILDING CONSTRUCTION MARKET, BY TYPE, 2021-2031 ($BILLION)
- TABLE 2. BUILDING CONSTRUCTION MARKET SIZE, FOR RESIDENTIAL, BY REGION, 2021-2031 ($BILLION)
- TABLE 3. BUILDING CONSTRUCTION MARKET FOR RESIDENTIAL BY COUNTRY, 2021-2031 ($BILLION)
- TABLE 4. BUILDING CONSTRUCTION MARKET SIZE, FOR NON-RESIDENTIAL, BY REGION, 2021-2031 ($BILLION)
- TABLE 5. BUILDING CONSTRUCTION MARKET FOR NON-RESIDENTIAL BY COUNTRY, 2021-2031 ($BILLION)
- TABLE 6. GLOBAL BUILDING CONSTRUCTION MARKET, BY CONSTRUCTION TYPE, 2021-2031 ($BILLION)
- TABLE 7. BUILDING CONSTRUCTION MARKET SIZE, FOR NEW CONSTRUCTION, BY REGION, 2021-2031 ($BILLION)
- TABLE 8. BUILDING CONSTRUCTION MARKET FOR NEW CONSTRUCTION BY COUNTRY, 2021-2031 ($BILLION)
- TABLE 9. BUILDING CONSTRUCTION MARKET SIZE, FOR RENOVATION, BY REGION, 2021-2031 ($BILLION)
- TABLE 10. BUILDING CONSTRUCTION MARKET FOR RENOVATION BY COUNTRY, 2021-2031 ($BILLION)
- TABLE 11. GLOBAL BUILDING CONSTRUCTION MARKET, BY APPLICATION, 2021-2031 ($BILLION)
- TABLE 12. BUILDING CONSTRUCTION MARKET SIZE, FOR OWNED, BY REGION, 2021-2031 ($BILLION)
- TABLE 13. BUILDING CONSTRUCTION MARKET FOR OWNED BY COUNTRY, 2021-2031 ($BILLION)
- TABLE 14. BUILDING CONSTRUCTION MARKET SIZE, FOR RENTAL, BY REGION, 2021-2031 ($BILLION)
- TABLE 15. BUILDING CONSTRUCTION MARKET FOR RENTAL BY COUNTRY, 2021-2031 ($BILLION)
- TABLE 16. GLOBAL BUILDING CONSTRUCTION MARKET, BY END USER, 2021-2031 ($BILLION)
- TABLE 17. BUILDING CONSTRUCTION MARKET SIZE, FOR PRIVATE, BY REGION, 2021-2031 ($BILLION)
- TABLE 18. BUILDING CONSTRUCTION MARKET FOR PRIVATE BY COUNTRY, 2021-2031 ($BILLION)
- TABLE 19. BUILDING CONSTRUCTION MARKET SIZE, FOR PUBLIC, BY REGION, 2021-2031 ($BILLION)
- TABLE 20. BUILDING CONSTRUCTION MARKET FOR PUBLIC BY COUNTRY, 2021-2031 ($BILLION)
- TABLE 21. BUILDING CONSTRUCTION MARKET, BY REGION, 2021-2031 ($BILLION)
- TABLE 22. NORTH AMERICA BUILDING CONSTRUCTION MARKET, BY TYPE, 2021-2031 ($BILLION)
- TABLE 23. NORTH AMERICA BUILDING CONSTRUCTION MARKET, BY CONSTRUCTION TYPE, 2021-2031 ($BILLION)
- TABLE 24. NORTH AMERICA BUILDING CONSTRUCTION MARKET, BY APPLICATION, 2021-2031 ($BILLION)
- TABLE 25. NORTH AMERICA BUILDING CONSTRUCTION MARKET, BY END USER, 2021-2031 ($BILLION)
- TABLE 26. NORTH AMERICA BUILDING CONSTRUCTION MARKET, BY COUNTRY, 2021-2031 ($BILLION)
- TABLE 27. U.S. BUILDING CONSTRUCTION MARKET, BY TYPE, 2021-2031 ($BILLION)
- TABLE 28. U.S. BUILDING CONSTRUCTION MARKET, BY CONSTRUCTION TYPE, 2021-2031 ($BILLION)
- TABLE 29. U.S. BUILDING CONSTRUCTION MARKET, BY APPLICATION, 2021-2031 ($BILLION)
- TABLE 30. U.S. BUILDING CONSTRUCTION MARKET, BY END USER, 2021-2031 ($BILLION)
- TABLE 31. CANADA BUILDING CONSTRUCTION MARKET, BY TYPE, 2021-2031 ($BILLION)
- TABLE 32. CANADA BUILDING CONSTRUCTION MARKET, BY CONSTRUCTION TYPE, 2021-2031 ($BILLION)
- TABLE 33. CANADA BUILDING CONSTRUCTION MARKET, BY APPLICATION, 2021-2031 ($BILLION)
- TABLE 34. CANADA BUILDING CONSTRUCTION MARKET, BY END USER, 2021-2031 ($BILLION)
- TABLE 35. MEXICO BUILDING CONSTRUCTION MARKET, BY TYPE, 2021-2031 ($BILLION)
- TABLE 36. MEXICO BUILDING CONSTRUCTION MARKET, BY CONSTRUCTION TYPE, 2021-2031 ($BILLION)
- TABLE 37. MEXICO BUILDING CONSTRUCTION MARKET, BY APPLICATION, 2021-2031 ($BILLION)
- TABLE 38. MEXICO BUILDING CONSTRUCTION MARKET, BY END USER, 2021-2031 ($BILLION)
- TABLE 39. EUROPE BUILDING CONSTRUCTION MARKET, BY TYPE, 2021-2031 ($BILLION)
- TABLE 40. EUROPE BUILDING CONSTRUCTION MARKET, BY CONSTRUCTION TYPE, 2021-2031 ($BILLION)
- TABLE 41. EUROPE BUILDING CONSTRUCTION MARKET, BY APPLICATION, 2021-2031 ($BILLION)
- TABLE 42. EUROPE BUILDING CONSTRUCTION MARKET, BY END USER, 2021-2031 ($BILLION)
- TABLE 43. EUROPE BUILDING CONSTRUCTION MARKET, BY COUNTRY, 2021-2031 ($BILLION)
- TABLE 44. GERMANY BUILDING CONSTRUCTION MARKET, BY TYPE, 2021-2031 ($BILLION)
- TABLE 45. GERMANY BUILDING CONSTRUCTION MARKET, BY CONSTRUCTION TYPE, 2021-2031 ($BILLION)
- TABLE 46. GERMANY BUILDING CONSTRUCTION MARKET, BY APPLICATION, 2021-2031 ($BILLION)
- TABLE 47. GERMANY BUILDING CONSTRUCTION MARKET, BY END USER, 2021-2031 ($BILLION)
- TABLE 48. U.K. BUILDING CONSTRUCTION MARKET, BY TYPE, 2021-2031 ($BILLION)
- TABLE 49. U.K. BUILDING CONSTRUCTION MARKET, BY CONSTRUCTION TYPE, 2021-2031 ($BILLION)
- TABLE 50. U.K. BUILDING CONSTRUCTION MARKET, BY APPLICATION, 2021-2031 ($BILLION)
- TABLE 51. U.K. BUILDING CONSTRUCTION MARKET, BY END USER, 2021-2031 ($BILLION)
- TABLE 52. FRANCE BUILDING CONSTRUCTION MARKET, BY TYPE, 2021-2031 ($BILLION)
- TABLE 53. FRANCE BUILDING CONSTRUCTION MARKET, BY CONSTRUCTION TYPE, 2021-2031 ($BILLION)
- TABLE 54. FRANCE BUILDING CONSTRUCTION MARKET, BY APPLICATION, 2021-2031 ($BILLION)
- TABLE 55. FRANCE BUILDING CONSTRUCTION MARKET, BY END USER, 2021-2031 ($BILLION)
- TABLE 56. ITALY BUILDING CONSTRUCTION MARKET, BY TYPE, 2021-2031 ($BILLION)
- TABLE 57. ITALY BUILDING CONSTRUCTION MARKET, BY CONSTRUCTION TYPE, 2021-2031 ($BILLION)
- TABLE 58. ITALY BUILDING CONSTRUCTION MARKET, BY APPLICATION, 2021-2031 ($BILLION)
- TABLE 59. ITALY BUILDING CONSTRUCTION MARKET, BY END USER, 2021-2031 ($BILLION)
- TABLE 60. REST OF EUROPE BUILDING CONSTRUCTION MARKET, BY TYPE, 2021-2031 ($BILLION)
- TABLE 61. REST OF EUROPE BUILDING CONSTRUCTION MARKET, BY CONSTRUCTION TYPE, 2021-2031 ($BILLION)
- TABLE 62. REST OF EUROPE BUILDING CONSTRUCTION MARKET, BY APPLICATION, 2021-2031 ($BILLION)
- TABLE 63. REST OF EUROPE BUILDING CONSTRUCTION MARKET, BY END USER, 2021-2031 ($BILLION)
- TABLE 64. ASIA-PACIFIC BUILDING CONSTRUCTION MARKET, BY TYPE, 2021-2031 ($BILLION)
- TABLE 65. ASIA-PACIFIC BUILDING CONSTRUCTION MARKET, BY CONSTRUCTION TYPE, 2021-2031 ($BILLION)
- TABLE 66. ASIA-PACIFIC BUILDING CONSTRUCTION MARKET, BY APPLICATION, 2021-2031 ($BILLION)
- TABLE 67. ASIA-PACIFIC BUILDING CONSTRUCTION MARKET, BY END USER, 2021-2031 ($BILLION)
- TABLE 68. ASIA-PACIFIC BUILDING CONSTRUCTION MARKET, BY COUNTRY, 2021-2031 ($BILLION)
- TABLE 69. CHINA BUILDING CONSTRUCTION MARKET, BY TYPE, 2021-2031 ($BILLION)
- TABLE 70. CHINA BUILDING CONSTRUCTION MARKET, BY CONSTRUCTION TYPE, 2021-2031 ($BILLION)
- TABLE 71. CHINA BUILDING CONSTRUCTION MARKET, BY APPLICATION, 2021-2031 ($BILLION)
- TABLE 72. CHINA BUILDING CONSTRUCTION MARKET, BY END USER, 2021-2031 ($BILLION)
- TABLE 73. JAPAN BUILDING CONSTRUCTION MARKET, BY TYPE, 2021-2031 ($BILLION)
- TABLE 74. JAPAN BUILDING CONSTRUCTION MARKET, BY CONSTRUCTION TYPE, 2021-2031 ($BILLION)
- TABLE 75. JAPAN BUILDING CONSTRUCTION MARKET, BY APPLICATION, 2021-2031 ($BILLION)
- TABLE 76. JAPAN BUILDING CONSTRUCTION MARKET, BY END USER, 2021-2031 ($BILLION)
- TABLE 77. SOUTH KOREA BUILDING CONSTRUCTION MARKET, BY TYPE, 2021-2031 ($BILLION)
- TABLE 78. SOUTH KOREA BUILDING CONSTRUCTION MARKET, BY CONSTRUCTION TYPE, 2021-2031 ($BILLION)
- TABLE 79. SOUTH KOREA BUILDING CONSTRUCTION MARKET, BY APPLICATION, 2021-2031 ($BILLION)
- TABLE 80. SOUTH KOREA BUILDING CONSTRUCTION MARKET, BY END USER, 2021-2031 ($BILLION)
- TABLE 81. INDIA BUILDING CONSTRUCTION MARKET, BY TYPE, 2021-2031 ($BILLION)
- TABLE 82. INDIA BUILDING CONSTRUCTION MARKET, BY CONSTRUCTION TYPE, 2021-2031 ($BILLION)
- TABLE 83. INDIA BUILDING CONSTRUCTION MARKET, BY APPLICATION, 2021-2031 ($BILLION)
- TABLE 84. INDIA BUILDING CONSTRUCTION MARKET, BY END USER, 2021-2031 ($BILLION)
- TABLE 85. REST OF ASIA-PACIFIC BUILDING CONSTRUCTION MARKET, BY TYPE, 2021-2031 ($BILLION)
- TABLE 86. REST OF ASIA-PACIFIC BUILDING CONSTRUCTION MARKET, BY CONSTRUCTION TYPE, 2021-2031 ($BILLION)
- TABLE 87. REST OF ASIA-PACIFIC BUILDING CONSTRUCTION MARKET, BY APPLICATION, 2021-2031 ($BILLION)
- TABLE 88. REST OF ASIA-PACIFIC BUILDING CONSTRUCTION MARKET, BY END USER, 2021-2031 ($BILLION)
- TABLE 89. LAMEA BUILDING CONSTRUCTION MARKET, BY TYPE, 2021-2031 ($BILLION)
- TABLE 90. LAMEA BUILDING CONSTRUCTION MARKET, BY CONSTRUCTION TYPE, 2021-2031 ($BILLION)
- TABLE 91. LAMEA BUILDING CONSTRUCTION MARKET, BY APPLICATION, 2021-2031 ($BILLION)
- TABLE 92. LAMEA BUILDING CONSTRUCTION MARKET, BY END USER, 2021-2031 ($BILLION)
- TABLE 93. LAMEA BUILDING CONSTRUCTION MARKET, BY COUNTRY, 2021-2031 ($BILLION)
- TABLE 94. LATIN AMERICA BUILDING CONSTRUCTION MARKET, BY TYPE, 2021-2031 ($BILLION)
- TABLE 95. LATIN AMERICA BUILDING CONSTRUCTION MARKET, BY CONSTRUCTION TYPE, 2021-2031 ($BILLION)
- TABLE 96. LATIN AMERICA BUILDING CONSTRUCTION MARKET, BY APPLICATION, 2021-2031 ($BILLION)
- TABLE 97. LATIN AMERICA BUILDING CONSTRUCTION MARKET, BY END USER, 2021-2031 ($BILLION)
- TABLE 98. MIDDLE EAST BUILDING CONSTRUCTION MARKET, BY TYPE, 2021-2031 ($BILLION)
- TABLE 99. MIDDLE EAST BUILDING CONSTRUCTION MARKET, BY CONSTRUCTION TYPE, 2021-2031 ($BILLION)
- TABLE 100. MIDDLE EAST BUILDING CONSTRUCTION MARKET, BY APPLICATION, 2021-2031 ($BILLION)
- TABLE 101. MIDDLE EAST BUILDING CONSTRUCTION MARKET, BY END USER, 2021-2031 ($BILLION)
- TABLE 102. AFRICA BUILDING CONSTRUCTION MARKET, BY TYPE, 2021-2031 ($BILLION)
- TABLE 103. AFRICA BUILDING CONSTRUCTION MARKET, BY CONSTRUCTION TYPE, 2021-2031 ($BILLION)
- TABLE 104. AFRICA BUILDING CONSTRUCTION MARKET, BY APPLICATION, 2021-2031 ($BILLION)
- TABLE 105. AFRICA BUILDING CONSTRUCTION MARKET, BY END USER, 2021-2031 ($BILLION)
- TABLE 106.ACS: COMPANY SNAPSHOT
- TABLE 107.ACS: OPERATING SEGMENTS
- TABLE 108.ACS: PRODUCT PORTFOLIO
- TABLE 109.ACS: NET SALES,
- TABLE 110.ACS: KEY STRATERGIES
- TABLE 111.BOUYGUES GROUP: COMPANY SNAPSHOT
- TABLE 112.BOUYGUES GROUP: OPERATING SEGMENTS
- TABLE 113.BOUYGUES GROUP: PRODUCT PORTFOLIO
- TABLE 114.BOUYGUES GROUP: NET SALES,
- TABLE 115.BOUYGUES GROUP: KEY STRATERGIES
- TABLE 116.CHINA STATE CONSTRUCTION ENGINEERING CORPORATION LIMITED: COMPANY SNAPSHOT
- TABLE 117.CHINA STATE CONSTRUCTION ENGINEERING CORPORATION LIMITED: OPERATING SEGMENTS
- TABLE 118.CHINA STATE CONSTRUCTION ENGINEERING CORPORATION LIMITED: PRODUCT PORTFOLIO
- TABLE 119.CHINA STATE CONSTRUCTION ENGINEERING CORPORATION LIMITED: NET SALES,
- TABLE 120.CHINA STATE CONSTRUCTION ENGINEERING CORPORATION LIMITED: KEY STRATERGIES
- TABLE 121.COUNTRY GARDEN HOLDINGS COMPANY LIMITED: COMPANY SNAPSHOT
- TABLE 122.COUNTRY GARDEN HOLDINGS COMPANY LIMITED: OPERATING SEGMENTS
- TABLE 123.COUNTRY GARDEN HOLDINGS COMPANY LIMITED: PRODUCT PORTFOLIO
- TABLE 124.COUNTRY GARDEN HOLDINGS COMPANY LIMITED: NET SALES,
- TABLE 125.COUNTRY GARDEN HOLDINGS COMPANY LIMITED: KEY STRATERGIES
- TABLE 126.DAIWA HOUSE INDUSTRY CO., LTD.: COMPANY SNAPSHOT
- TABLE 127.DAIWA HOUSE INDUSTRY CO., LTD.: OPERATING SEGMENTS
- TABLE 128.DAIWA HOUSE INDUSTRY CO., LTD.: PRODUCT PORTFOLIO
- TABLE 129.DAIWA HOUSE INDUSTRY CO., LTD.: NET SALES,
- TABLE 130.DAIWA HOUSE INDUSTRY CO., LTD.: KEY STRATERGIES
- TABLE 131.DLF: COMPANY SNAPSHOT
- TABLE 132.DLF: OPERATING SEGMENTS
- TABLE 133.DLF: PRODUCT PORTFOLIO
- TABLE 134.DLF: NET SALES,
- TABLE 135.DLF: KEY STRATERGIES
- TABLE 136.EVERGRANDE GROUP: COMPANY SNAPSHOT
- TABLE 137.EVERGRANDE GROUP: OPERATING SEGMENTS
- TABLE 138.EVERGRANDE GROUP: PRODUCT PORTFOLIO
- TABLE 139.EVERGRANDE GROUP: NET SALES,
- TABLE 140.EVERGRANDE GROUP: KEY STRATERGIES
- TABLE 141.FLUOR CORPORATION: COMPANY SNAPSHOT
- TABLE 142.FLUOR CORPORATION: OPERATING SEGMENTS
- TABLE 143.FLUOR CORPORATION: PRODUCT PORTFOLIO
- TABLE 144.FLUOR CORPORATION: NET SALES,
- TABLE 145.FLUOR CORPORATION: KEY STRATERGIES
- TABLE 146.GODREJ GROUP: COMPANY SNAPSHOT
- TABLE 147.GODREJ GROUP: OPERATING SEGMENTS
- TABLE 148.GODREJ GROUP: PRODUCT PORTFOLIO
- TABLE 149.GODREJ GROUP: NET SALES,
- TABLE 150.GODREJ GROUP: KEY STRATERGIES
- TABLE 151.HOCHTIEF AG: COMPANY SNAPSHOT
- TABLE 152.HOCHTIEF AG: OPERATING SEGMENTS
- TABLE 153.HOCHTIEF AG: PRODUCT PORTFOLIO
- TABLE 154.HOCHTIEF AG: NET SALES,
- TABLE 155.HOCHTIEF AG: KEY STRATERGIES
- TABLE 156.LENNAR CORPORATION: COMPANY SNAPSHOT
- TABLE 157.LENNAR CORPORATION: OPERATING SEGMENTS
- TABLE 158.LENNAR CORPORATION: PRODUCT PORTFOLIO
- TABLE 159.LENNAR CORPORATION: NET SALES,
- TABLE 160.LENNAR CORPORATION: KEY STRATERGIES
- TABLE 161.METALLURGICAL CORPORATION OF CHINA: COMPANY SNAPSHOT
- TABLE 162.METALLURGICAL CORPORATION OF CHINA: OPERATING SEGMENTS
- TABLE 163.METALLURGICAL CORPORATION OF CHINA: PRODUCT PORTFOLIO
- TABLE 164.METALLURGICAL CORPORATION OF CHINA: NET SALES,
- TABLE 165.METALLURGICAL CORPORATION OF CHINA: KEY STRATERGIES
- TABLE 166.POWER CONSTRUCTION CORP. OF CHINA: COMPANY SNAPSHOT
- TABLE 167.POWER CONSTRUCTION CORP. OF CHINA: OPERATING SEGMENTS
- TABLE 168.POWER CONSTRUCTION CORP. OF CHINA: PRODUCT PORTFOLIO
- TABLE 169.POWER CONSTRUCTION CORP. OF CHINA: NET SALES,
- TABLE 170.POWER CONSTRUCTION CORP. OF CHINA: KEY STRATERGIES
- TABLE 171.SHAPOORJI PALLONJI: COMPANY SNAPSHOT
- TABLE 172.SHAPOORJI PALLONJI: OPERATING SEGMENTS
- TABLE 173.SHAPOORJI PALLONJI: PRODUCT PORTFOLIO
- TABLE 174.SHAPOORJI PALLONJI: NET SALES,
- TABLE 175.SHAPOORJI PALLONJI: KEY STRATERGIES
- TABLE 176.SUNAC CHINA HOLDINGS LIMITED: COMPANY SNAPSHOT
- TABLE 177.SUNAC CHINA HOLDINGS LIMITED: OPERATING SEGMENTS
- TABLE 178.SUNAC CHINA HOLDINGS LIMITED: PRODUCT PORTFOLIO
- TABLE 179.SUNAC CHINA HOLDINGS LIMITED: NET SALES,
- TABLE 180.SUNAC CHINA HOLDINGS LIMITED: KEY STRATERGIES
- TABLE 181.VINCI: COMPANY SNAPSHOT
- TABLE 182.VINCI: OPERATING SEGMENTS
- TABLE 183.VINCI: PRODUCT PORTFOLIO
- TABLE 184.VINCI: NET SALES,
- TABLE 185.VINCI: KEY STRATERGIES
- TABLE 186.SKANKSA GROUP: COMPANY SNAPSHOT
- TABLE 187.SKANKSA GROUP: OPERATING SEGMENTS
- TABLE 188.SKANKSA GROUP: PRODUCT PORTFOLIO
- TABLE 189.SKANKSA GROUP: NET SALES,
- TABLE 190.SKANKSA GROUP: KEY STRATERGIES
LIST OF FIGURES
- FIGURE 1.BUILDING CONSTRUCTION MARKET SEGMENTATION
- FIGURE 2.BUILDING CONSTRUCTION MARKET,2021-2031
- FIGURE 3.BUILDING CONSTRUCTION MARKET,2021-2031
- FIGURE 4. TOP INVESTMENT POCKETS, BY REGION
- FIGURE 5.PORTER FIVE-1
- FIGURE 6.PORTER FIVE-2
- FIGURE 7.PORTER FIVE-3
- FIGURE 8.PORTER FIVE-4
- FIGURE 9.PORTER FIVE-5
- FIGURE 10.TOP PLAYER POSITIONING
- FIGURE 11.BUILDING CONSTRUCTION MARKET:DRIVERS, RESTRAINTS AND OPPORTUNITIES
- FIGURE 12.BUILDING CONSTRUCTION MARKET,BY TYPE,2021(%)
- FIGURE 13.COMPARATIVE SHARE ANALYSIS OF RESIDENTIAL BUILDING CONSTRUCTION MARKET,2021-2031(%)
- FIGURE 14.COMPARATIVE SHARE ANALYSIS OF NON-RESIDENTIAL BUILDING CONSTRUCTION MARKET,2021-2031(%)
- FIGURE 15.BUILDING CONSTRUCTION MARKET,BY CONSTRUCTION TYPE,2021(%)
- FIGURE 16.COMPARATIVE SHARE ANALYSIS OF NEW CONSTRUCTION BUILDING CONSTRUCTION MARKET,2021-2031(%)
- FIGURE 17.COMPARATIVE SHARE ANALYSIS OF RENOVATION BUILDING CONSTRUCTION MARKET,2021-2031(%)
- FIGURE 18.BUILDING CONSTRUCTION MARKET,BY APPLICATION,2021(%)
- FIGURE 19.COMPARATIVE SHARE ANALYSIS OF OWNED BUILDING CONSTRUCTION MARKET,2021-2031(%)
- FIGURE 20.COMPARATIVE SHARE ANALYSIS OF RENTAL BUILDING CONSTRUCTION MARKET,2021-2031(%)
- FIGURE 21.BUILDING CONSTRUCTION MARKET,BY END USER,2021(%)
- FIGURE 22.COMPARATIVE SHARE ANALYSIS OF PRIVATE BUILDING CONSTRUCTION MARKET,2021-2031(%)
- FIGURE 23.COMPARATIVE SHARE ANALYSIS OF PUBLIC BUILDING CONSTRUCTION MARKET,2021-2031(%)
- FIGURE 24.BUILDING CONSTRUCTION MARKET BY REGION,2021
- FIGURE 25.U.S. BUILDING CONSTRUCTION MARKET,2021-2031($BILLION)
- FIGURE 26.CANADA BUILDING CONSTRUCTION MARKET,2021-2031($BILLION)
- FIGURE 27.MEXICO BUILDING CONSTRUCTION MARKET,2021-2031($BILLION)
- FIGURE 28.GERMANY BUILDING CONSTRUCTION MARKET,2021-2031($BILLION)
- FIGURE 29.U.K. BUILDING CONSTRUCTION MARKET,2021-2031($BILLION)
- FIGURE 30.FRANCE BUILDING CONSTRUCTION MARKET,2021-2031($BILLION)
- FIGURE 31.ITALY BUILDING CONSTRUCTION MARKET,2021-2031($BILLION)
- FIGURE 32.REST OF EUROPE BUILDING CONSTRUCTION MARKET,2021-2031($BILLION)
- FIGURE 33.CHINA BUILDING CONSTRUCTION MARKET,2021-2031($BILLION)
- FIGURE 34.JAPAN BUILDING CONSTRUCTION MARKET,2021-2031($BILLION)
- FIGURE 35.SOUTH KOREA BUILDING CONSTRUCTION MARKET,2021-2031($BILLION)
- FIGURE 36.INDIA BUILDING CONSTRUCTION MARKET,2021-2031($BILLION)
- FIGURE 37.REST OF ASIA-PACIFIC BUILDING CONSTRUCTION MARKET,2021-2031($BILLION)
- FIGURE 38.LATIN AMERICA BUILDING CONSTRUCTION MARKET,2021-2031($BILLION)
- FIGURE 39.MIDDLE EAST BUILDING CONSTRUCTION MARKET,2021-2031($BILLION)
- FIGURE 40.AFRICA BUILDING CONSTRUCTION MARKET,2021-2031($BILLION)
- FIGURE 41. TOP WINNING STRATEGIES, BY YEAR
- FIGURE 42. TOP WINNING STRATEGIES, BY DEVELOPMENT
- FIGURE 43. TOP WINNING STRATEGIES, BY COMPANY
- FIGURE 44.PRODUCT MAPPING OF TOP 10 PLAYERS
- FIGURE 45.COMPETITIVE DASHBOARD
- FIGURE 46.COMPETITIVE HEATMAP OF TOP 10 KEY PLAYERS
- FIGURE 47.ACS.: NET SALES ,($BILLION)
- FIGURE 48.BOUYGUES GROUP.: NET SALES ,($BILLION)
- FIGURE 49.CHINA STATE CONSTRUCTION ENGINEERING CORPORATION LIMITED.: NET SALES ,($BILLION)
- FIGURE 50.COUNTRY GARDEN HOLDINGS COMPANY LIMITED.: NET SALES ,($BILLION)
- FIGURE 51.DAIWA HOUSE INDUSTRY CO., LTD..: NET SALES ,($BILLION)
- FIGURE 52.DLF.: NET SALES ,($BILLION)
- FIGURE 53.EVERGRANDE GROUP.: NET SALES ,($BILLION)
- FIGURE 54.FLUOR CORPORATION.: NET SALES ,($BILLION)
- FIGURE 55.GODREJ GROUP.: NET SALES ,($BILLION)
- FIGURE 56.HOCHTIEF AG.: NET SALES ,($BILLION)
- FIGURE 57.LENNAR CORPORATION.: NET SALES ,($BILLION)
- FIGURE 58.METALLURGICAL CORPORATION OF CHINA.: NET SALES ,($BILLION)
- FIGURE 59.POWER CONSTRUCTION CORP. OF CHINA.: NET SALES ,($BILLION)
- FIGURE 60.SHAPOORJI PALLONJI.: NET SALES ,($BILLION)
- FIGURE 61.SUNAC CHINA HOLDINGS LIMITED.: NET SALES ,($BILLION)
- FIGURE 62.VINCI.: NET SALES ,($BILLION)
- FIGURE 63.SKANKSA GROUP.: NET SALES ,($BILLION)
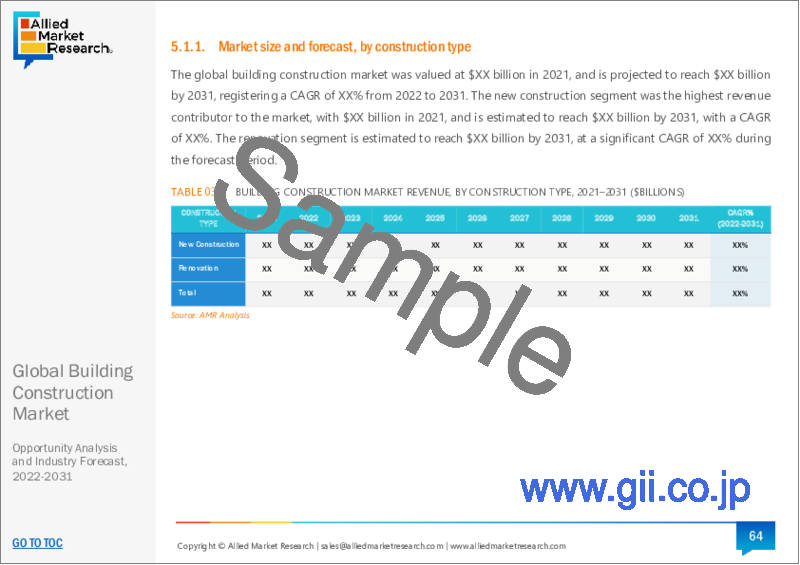
The global building construction market was valued at $5,412.8 billion in 2021, and is projected to reach $11,121.9 billion by 2031, registering a CAGR of 7.4% from 2022 to 2031. The scope of building construction market includes, revenue generated by sales of ready-mix concrete, precast product, and components for construction of buildings and other infrastructure. Building construction includes the construction of new buildings, demolition of buildings, and making necessary alterations to the existing building.
Rise in new construction projects and redevelopment or repairing of old buildings is the major driving factor for the growth of the building construction market. In addition, adoption of certain green building materials saves a lot of construction time as well as avoids wastage of material, further giving cost effective solution. Moreover, development of manufacturing technology along with new and advanced machinery drives the building construction market around the globe.
However, high investments to initially setup new manufacturing facility for construction materials acts as a restraint for the market growth. Moreover, rise in use of sustainable building material hinders the growth of the building construction market.
On the contrary, rise in development plans in emerging countries is expected to act as an opportunity for the building construction market growth during the forecast period.
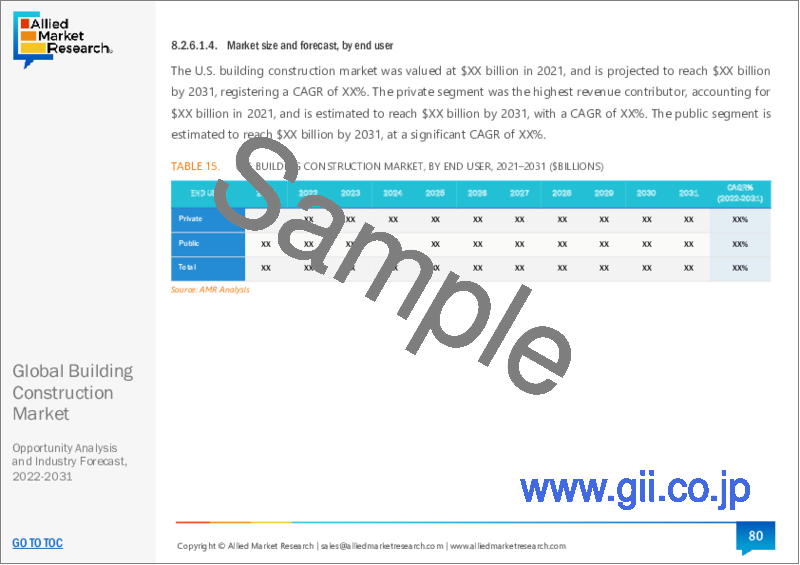
The building construction market is segmented on the basis of type, end user, construction type, application, and region. On the basis of type, it is further classified into residential and non-residential. By end user, it is divided into private and public. By construction type, it is categorized into owned and rental. Based on application, it is categorized into new construction and renovation. Region-wise, the building construction market is analyzed across North America, Europe, Asia-Pacific, and LAMEA.
The major players profiled in the global building construction market include, ACS, Actividades De Construction Services, Bouygues SA, China Evergrande Group, China State Construction Engineering Corporation Ltd., Country Garden Holdings Co. Ltd., Daiwa House Group, D.R. Horton Inc., Greenland Holding Group, HOCHTIEF, Lennar Corporation, Power Construction Corp of China, Skanska, Sunac China Holdings Ltd., The Metallurgical Corp of China, and VINCI.
Key Benefits For Stakeholders
- This report provides a quantitative analysis of the market segments, current trends, estimations, and dynamics of the building construction market by type analysis from 2021 to 2031 to identify the prevailing building construction market by type opportunities.
- The market research is offered along with information related to key drivers, restraints, and opportunities.
- Porter's five forces analysis highlights the potency of buyers and suppliers to enable stakeholders make profit-oriented business decisions and strengthen their supplier-buyer network.
- In-depth analysis of the building construction market by type segmentation assists to determine the prevailing market opportunities.
- Major countries in each region are mapped according to their revenue contribution to the global market.
- Market player positioning facilitates benchmarking and provides a clear understanding of the present position of the market players.
- The report includes the analysis of the regional as well as global building construction market by type trends, key players, market segments, application areas, and market growth strategies.
Key Market Segments
By Type
- Residential
- Non-residential
By Construction Type
- New Construction
- Renovation
By Application
- Owned
- Rental
By End User
- Private
- Public
By Region
- North America
- U.S.
- Canada
- Mexico
- Europe
- Germany
- U.K.
- France
- Italy
- Rest of Europe
- Asia-Pacific
- China
- Japan
- South Korea
- India
- Rest of Asia-Pacific
- LAMEA
- Latin America
- Middle East
- Africa
- Key Market Players
- ACS, ACTIVIDADES DE Construction Services
- Bouygues SA
- China Evergrande Group
- China State Construction Engineering Corporation Ltd.
- Country Garden Holdings Co. Ltd.
- Daiwa House Group
- D.R. Horton Inc.
- Greenland Holding Group
- HOCHTIEF
- Lennar Corporation
- Power Construction Corp of China
- SKANSKA
- Sunac China Holdings Ltd.
- The Metallurgical Corp of China
- Vinci
- DLF
- Shapoorji Pallonji
TABLE OF CONTENTS
CHAPTER 1:INTRODUCTION
- 1.1.Report description
- 1.2.Key market segments
- 1.3.Key benefits to the stakeholders
- 1.4.Research Methodology
- 1.4.1.Secondary research
- 1.4.2.Primary research
- 1.4.3.Analyst tools and models
CHAPTER 2:EXECUTIVE SUMMARY
- 2.1.Key findings of the study
- 2.2.CXO Perspective
CHAPTER 3:MARKET OVERVIEW
- 3.1.Market definition and scope
- 3.2.Key findings
- 3.2.1.Top investment pockets
- 3.3.Porter's five forces analysis
- 3.4.Top player positioning
- 3.5.Market dynamics
- 3.5.1.Drivers
- 3.5.2.Restraints
- 3.5.3.Opportunities
- 3.6.COVID-19 Impact Analysis on the market
CHAPTER 4: BUILDING CONSTRUCTION MARKET, BY TYPE
- 4.1 Overview
- 4.1.1 Market size and forecast
- 4.2 Residential
- 4.2.1 Key market trends, growth factors and opportunities
- 4.2.2 Market size and forecast, by region
- 4.2.3 Market analysis by country
- 4.3 Non-residential
- 4.3.1 Key market trends, growth factors and opportunities
- 4.3.2 Market size and forecast, by region
- 4.3.3 Market analysis by country
CHAPTER 5: BUILDING CONSTRUCTION MARKET, BY CONSTRUCTION TYPE
- 5.1 Overview
- 5.1.1 Market size and forecast
- 5.2 New Construction
- 5.2.1 Key market trends, growth factors and opportunities
- 5.2.2 Market size and forecast, by region
- 5.2.3 Market analysis by country
- 5.3 Renovation
- 5.3.1 Key market trends, growth factors and opportunities
- 5.3.2 Market size and forecast, by region
- 5.3.3 Market analysis by country
CHAPTER 6: BUILDING CONSTRUCTION MARKET, BY APPLICATION
- 6.1 Overview
- 6.1.1 Market size and forecast
- 6.2 Owned
- 6.2.1 Key market trends, growth factors and opportunities
- 6.2.2 Market size and forecast, by region
- 6.2.3 Market analysis by country
- 6.3 Rental
- 6.3.1 Key market trends, growth factors and opportunities
- 6.3.2 Market size and forecast, by region
- 6.3.3 Market analysis by country
CHAPTER 7: BUILDING CONSTRUCTION MARKET, BY END USER
- 7.1 Overview
- 7.1.1 Market size and forecast
- 7.2 Private
- 7.2.1 Key market trends, growth factors and opportunities
- 7.2.2 Market size and forecast, by region
- 7.2.3 Market analysis by country
- 7.3 Public
- 7.3.1 Key market trends, growth factors and opportunities
- 7.3.2 Market size and forecast, by region
- 7.3.3 Market analysis by country
CHAPTER 8: BUILDING CONSTRUCTION MARKET, BY REGION
- 8.1 Overview
- 8.1.1 Market size and forecast
- 8.2 North America
- 8.2.1 Key trends and opportunities
- 8.2.2 North America Market size and forecast, by Type
- 8.2.3 North America Market size and forecast, by Construction Type
- 8.2.4 North America Market size and forecast, by Application
- 8.2.5 North America Market size and forecast, by End User
- 8.2.6 North America Market size and forecast, by country
- 8.2.6.1 U.S.
- 8.2.6.1.1 Market size and forecast, by Type
- 8.2.6.1.2 Market size and forecast, by Construction Type
- 8.2.6.1.3 Market size and forecast, by Application
- 8.2.6.1.4 Market size and forecast, by End User
- 8.2.6.2 Canada
- 8.2.6.2.1 Market size and forecast, by Type
- 8.2.6.2.2 Market size and forecast, by Construction Type
- 8.2.6.2.3 Market size and forecast, by Application
- 8.2.6.2.4 Market size and forecast, by End User
- 8.2.6.3 Mexico
- 8.2.6.3.1 Market size and forecast, by Type
- 8.2.6.3.2 Market size and forecast, by Construction Type
- 8.2.6.3.3 Market size and forecast, by Application
- 8.2.6.3.4 Market size and forecast, by End User
- 8.3 Europe
- 8.3.1 Key trends and opportunities
- 8.3.2 Europe Market size and forecast, by Type
- 8.3.3 Europe Market size and forecast, by Construction Type
- 8.3.4 Europe Market size and forecast, by Application
- 8.3.5 Europe Market size and forecast, by End User
- 8.3.6 Europe Market size and forecast, by country
- 8.3.6.1 Germany
- 8.3.6.1.1 Market size and forecast, by Type
- 8.3.6.1.2 Market size and forecast, by Construction Type
- 8.3.6.1.3 Market size and forecast, by Application
- 8.3.6.1.4 Market size and forecast, by End User
- 8.3.6.2 U.K.
- 8.3.6.2.1 Market size and forecast, by Type
- 8.3.6.2.2 Market size and forecast, by Construction Type
- 8.3.6.2.3 Market size and forecast, by Application
- 8.3.6.2.4 Market size and forecast, by End User
- 8.3.6.3 France
- 8.3.6.3.1 Market size and forecast, by Type
- 8.3.6.3.2 Market size and forecast, by Construction Type
- 8.3.6.3.3 Market size and forecast, by Application
- 8.3.6.3.4 Market size and forecast, by End User
- 8.3.6.4 Italy
- 8.3.6.4.1 Market size and forecast, by Type
- 8.3.6.4.2 Market size and forecast, by Construction Type
- 8.3.6.4.3 Market size and forecast, by Application
- 8.3.6.4.4 Market size and forecast, by End User
- 8.3.6.5 Rest of Europe
- 8.3.6.5.1 Market size and forecast, by Type
- 8.3.6.5.2 Market size and forecast, by Construction Type
- 8.3.6.5.3 Market size and forecast, by Application
- 8.3.6.5.4 Market size and forecast, by End User
- 8.4 Asia-Pacific
- 8.4.1 Key trends and opportunities
- 8.4.2 Asia-Pacific Market size and forecast, by Type
- 8.4.3 Asia-Pacific Market size and forecast, by Construction Type
- 8.4.4 Asia-Pacific Market size and forecast, by Application
- 8.4.5 Asia-Pacific Market size and forecast, by End User
- 8.4.6 Asia-Pacific Market size and forecast, by country
- 8.4.6.1 China
- 8.4.6.1.1 Market size and forecast, by Type
- 8.4.6.1.2 Market size and forecast, by Construction Type
- 8.4.6.1.3 Market size and forecast, by Application
- 8.4.6.1.4 Market size and forecast, by End User
- 8.4.6.2 Japan
- 8.4.6.2.1 Market size and forecast, by Type
- 8.4.6.2.2 Market size and forecast, by Construction Type
- 8.4.6.2.3 Market size and forecast, by Application
- 8.4.6.2.4 Market size and forecast, by End User
- 8.4.6.3 South Korea
- 8.4.6.3.1 Market size and forecast, by Type
- 8.4.6.3.2 Market size and forecast, by Construction Type
- 8.4.6.3.3 Market size and forecast, by Application
- 8.4.6.3.4 Market size and forecast, by End User
- 8.4.6.4 India
- 8.4.6.4.1 Market size and forecast, by Type
- 8.4.6.4.2 Market size and forecast, by Construction Type
- 8.4.6.4.3 Market size and forecast, by Application
- 8.4.6.4.4 Market size and forecast, by End User
- 8.4.6.5 Rest of Asia-Pacific
- 8.4.6.5.1 Market size and forecast, by Type
- 8.4.6.5.2 Market size and forecast, by Construction Type
- 8.4.6.5.3 Market size and forecast, by Application
- 8.4.6.5.4 Market size and forecast, by End User
- 8.5 LAMEA
- 8.5.1 Key trends and opportunities
- 8.5.2 LAMEA Market size and forecast, by Type
- 8.5.3 LAMEA Market size and forecast, by Construction Type
- 8.5.4 LAMEA Market size and forecast, by Application
- 8.5.5 LAMEA Market size and forecast, by End User
- 8.5.6 LAMEA Market size and forecast, by country
- 8.5.6.1 Latin America
- 8.5.6.1.1 Market size and forecast, by Type
- 8.5.6.1.2 Market size and forecast, by Construction Type
- 8.5.6.1.3 Market size and forecast, by Application
- 8.5.6.1.4 Market size and forecast, by End User
- 8.5.6.2 Middle East
- 8.5.6.2.1 Market size and forecast, by Type
- 8.5.6.2.2 Market size and forecast, by Construction Type
- 8.5.6.2.3 Market size and forecast, by Application
- 8.5.6.2.4 Market size and forecast, by End User
- 8.5.6.3 Africa
- 8.5.6.3.1 Market size and forecast, by Type
- 8.5.6.3.2 Market size and forecast, by Construction Type
- 8.5.6.3.3 Market size and forecast, by Application
- 8.5.6.3.4 Market size and forecast, by End User
CHAPTER 9: COMPANY LANDSCAPE
- 9.1. Introduction
- 9.2. Top winning strategies
- 9.3. Product Mapping of Top 10 Player
- 9.4. Competitive Dashboard
- 9.5. Competitive Heatmap
- 9.6. Key developments
CHAPTER 10: COMPANY PROFILES
- 10.1 ACS
- 10.1.1 Company overview
- 10.1.2 Company snapshot
- 10.1.3 Operating business segments
- 10.1.4 Product portfolio
- 10.1.5 Business performance
- 10.1.6 Key strategic moves and developments
- 10.2 Bouygues Group
- 10.2.1 Company overview
- 10.2.2 Company snapshot
- 10.2.3 Operating business segments
- 10.2.4 Product portfolio
- 10.2.5 Business performance
- 10.2.6 Key strategic moves and developments
- 10.3 China State Construction Engineering Corporation Limited
- 10.3.1 Company overview
- 10.3.2 Company snapshot
- 10.3.3 Operating business segments
- 10.3.4 Product portfolio
- 10.3.5 Business performance
- 10.3.6 Key strategic moves and developments
- 10.4 country garden holdings company limited
- 10.4.1 Company overview
- 10.4.2 Company snapshot
- 10.4.3 Operating business segments
- 10.4.4 Product portfolio
- 10.4.5 Business performance
- 10.4.6 Key strategic moves and developments
- 10.5 Daiwa House Industry Co., Ltd.
- 10.5.1 Company overview
- 10.5.2 Company snapshot
- 10.5.3 Operating business segments
- 10.5.4 Product portfolio
- 10.5.5 Business performance
- 10.5.6 Key strategic moves and developments
- 10.6 DLF
- 10.6.1 Company overview
- 10.6.2 Company snapshot
- 10.6.3 Operating business segments
- 10.6.4 Product portfolio
- 10.6.5 Business performance
- 10.6.6 Key strategic moves and developments
- 10.7 Evergrande Group
- 10.7.1 Company overview
- 10.7.2 Company snapshot
- 10.7.3 Operating business segments
- 10.7.4 Product portfolio
- 10.7.5 Business performance
- 10.7.6 Key strategic moves and developments
- 10.8 Fluor Corporation
- 10.8.1 Company overview
- 10.8.2 Company snapshot
- 10.8.3 Operating business segments
- 10.8.4 Product portfolio
- 10.8.5 Business performance
- 10.8.6 Key strategic moves and developments
- 10.9 Godrej Group
- 10.9.1 Company overview
- 10.9.2 Company snapshot
- 10.9.3 Operating business segments
- 10.9.4 Product portfolio
- 10.9.5 Business performance
- 10.9.6 Key strategic moves and developments
- 10.10 Hochtief AG
- 10.10.1 Company overview
- 10.10.2 Company snapshot
- 10.10.3 Operating business segments
- 10.10.4 Product portfolio
- 10.10.5 Business performance
- 10.10.6 Key strategic moves and developments
- 10.11 Lennar Corporation
- 10.11.1 Company overview
- 10.11.2 Company snapshot
- 10.11.3 Operating business segments
- 10.11.4 Product portfolio
- 10.11.5 Business performance
- 10.11.6 Key strategic moves and developments
- 10.12 Metallurgical Corporation of China
- 10.12.1 Company overview
- 10.12.2 Company snapshot
- 10.12.3 Operating business segments
- 10.12.4 Product portfolio
- 10.12.5 Business performance
- 10.12.6 Key strategic moves and developments
- 10.13 Power Construction Corp. of China
- 10.13.1 Company overview
- 10.13.2 Company snapshot
- 10.13.3 Operating business segments
- 10.13.4 Product portfolio
- 10.13.5 Business performance
- 10.13.6 Key strategic moves and developments
- 10.14 Shapoorji Pallonji
- 10.14.1 Company overview
- 10.14.2 Company snapshot
- 10.14.3 Operating business segments
- 10.14.4 Product portfolio
- 10.14.5 Business performance
- 10.14.6 Key strategic moves and developments
- 10.15 Sunac China Holdings Limited
- 10.15.1 Company overview
- 10.15.2 Company snapshot
- 10.15.3 Operating business segments
- 10.15.4 Product portfolio
- 10.15.5 Business performance
- 10.15.6 Key strategic moves and developments
- 10.16 Vinci
- 10.16.1 Company overview
- 10.16.2 Company snapshot
- 10.16.3 Operating business segments
- 10.16.4 Product portfolio
- 10.16.5 Business performance
- 10.16.6 Key strategic moves and developments
- 10.17 Skanksa Group
- 10.17.1 Company overview
- 10.17.2 Company snapshot
- 10.17.3 Operating business segments
- 10.17.4 Product portfolio
- 10.17.5 Business performance
- 10.17.6 Key strategic moves and developments