
|
市場調査レポート
商品コード
1414699
電動モーターの世界市場:モータータイプ別、コンポーネント別、用途別:機会分析と産業予測(2023年~2032年)Electric Motor Market By Motor type (Alternate Current Motor, Direct Current Motor), By Component, By Application : Global Opportunity Analysis and Industry Forecast, 2023-2032 |
||||||
|
|||||||

| 電動モーターの世界市場:モータータイプ別、コンポーネント別、用途別:機会分析と産業予測(2023年~2032年) |
|
出版日: 2023年11月30日
発行: Allied Market Research
ページ情報: 英文 439 Pages
納期: 2~3営業日
|

- 全表示
- 概要
- 図表
- 目次
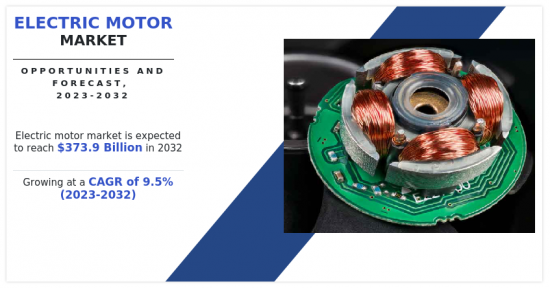
世界の電動モーターの市場規模は、2022年に1,422億米ドルに達し、2023年~2032年にCAGR9.5%で成長し、2032年には3,739億米ドルに達すると予測されています。
電動モーターは、その多目的な用途により、産業および非産業部門からの需要が増加しています。
高効率、高トルク、耐久性、卓越した制御性、信頼性など、適切に設計された電動モーターの特長が、多くの産業用途での採用を後押ししています。ここ数年、産業部門は特に発展途上国で大幅な伸びを見せています。さらに、持続可能な開発の動向は、環境に優しい製品の使用を促進し、それが最終的にエネルギー効率の高いモーターの需要を後押ししています。
しかし、専用モーターは初期費用が高く、メンテナンス費用も高いため、市場の成長は抑制されています。さらに、ロボット工学や自動ロボット技術向けの電動モーター需要の増加は、電動モーター市場の成長に有利な機会を提供すると予想されます。
電動モーター市場は、モータータイプ、コンポーネント、用途、地域に区分されます。モータータイプ別では、市場は交流(AC)モーターと直流(DC)モーターに分けられます。コンポーネント別では、市場はローター、ステーター、ベアリング、フレーム、エンドブラケット、その他に分類されます。用途別では、自動車用トラクションモーター、自動車用非トラクションモーター、HVAC、医療機器、産業機械、家電製品、その他に分類されます。
地域別では、北米(米国、カナダ、メキシコ)、欧州(ドイツ、フランス、イタリア、英国、その他欧州)、アジア太平洋(中国、インド、日本、韓国、その他アジア太平洋)、ラテンアメリカ・中東・アフリカで分析されています。
目次
第1章 イントロダクション
第2章 エグゼクティブサマリー
第3章 市場概要
- 市場の定義と範囲
- 主な調査結果
- 影響要因
- 主な投資機会
- ポーターのファイブフォース分析
- 市場力学
- 促進要因
- エネルギー効率の高い電動モーター需要の増加
- 新興諸国における家電・電化製品の販売拡大
- 電気自動車需要の増加
- 抑制要因
- 電動モーターの初期コストの高さ
- 機会
- 技術の進歩
- 促進要因
第4章 電動モーター市場:モータータイプ別
- 概要
- 交流(AC)モーター
- 直流(DC)モーター
第5章 電動モーター市場:コンポーネント別
- 概要
- ローター
- ステーター
- ベアリング
- フレーム
- エンドブラケット
- その他
第6章 電動モーター市場:用途別
- 概要
- 自動車用トラクションモーター
- 自動車用非トラクションモーター
- HVAC
- 医療機器
- 産業機械
- 家電製品
- その他
第7章 電動モーター市場:地域別
- 概要
- 北米
- 米国
- カナダ
- メキシコ
- 欧州
- ドイツ
- フランス
- イタリア
- 英国
- その他
- アジア太平洋
- 中国
- 日本
- インド
- 韓国
- その他
- ラテンアメリカ・中東・アフリカ
- ラテンアメリカ
- 中東
- アフリカ
第8章 競合情勢
- イントロダクション
- 主要成功戦略
- 主要10社の製品マッピング
- 競合ダッシュボード
- 競合ヒートマップ
- 主要企業のポジショニング(2020年)
第9章 企業プロファイル
- ABB
- Arc Systems Inc.
- Denso Corporation
- Emerson Electric Co.
- Johnson Electric Holdings Limited
- Maxon
- NIDEC CORPORATION
- Regal Rexnord Corporation
- Rockwell Automation Inc.
- Siemens AG
LIST OF TABLES
- TABLE 01. GLOBAL ELECTRIC MOTOR MARKET, BY MOTOR TYPE, 2020-2032 ($MILLION)
- TABLE 02. GLOBAL ELECTRIC MOTOR MARKET, BY MOTOR TYPE, 2020-2032 (MILLION UNITS)
- TABLE 03. ELECTRIC MOTOR MARKET FOR ALTERNATE CURRENT (AC) MOTOR, BY REGION, 2020-2032 ($MILLION)
- TABLE 04. ELECTRIC MOTOR MARKET FOR ALTERNATE CURRENT (AC) MOTOR, BY REGION, 2020-2032 (MILLION UNITS)
- TABLE 05. ELECTRIC MOTOR MARKET FOR DIRECT CURRENT (DC) MOTOR, BY REGION, 2020-2032 ($MILLION)
- TABLE 06. ELECTRIC MOTOR MARKET FOR DIRECT CURRENT (DC) MOTOR, BY REGION, 2020-2032 (MILLION UNITS)
- TABLE 07. GLOBAL ELECTRIC MOTOR MARKET, BY COMPONENT, 2020-2032 ($MILLION)
- TABLE 08. GLOBAL ELECTRIC MOTOR MARKET, BY COMPONENT, 2020-2032 (MILLION UNITS)
- TABLE 09. ELECTRIC MOTOR MARKET FOR ROTOR, BY REGION, 2020-2032 ($MILLION)
- TABLE 10. ELECTRIC MOTOR MARKET FOR ROTOR, BY REGION, 2020-2032 (MILLION UNITS)
- TABLE 11. ELECTRIC MOTOR MARKET FOR STATOR, BY REGION, 2020-2032 ($MILLION)
- TABLE 12. ELECTRIC MOTOR MARKET FOR STATOR, BY REGION, 2020-2032 (MILLION UNITS)
- TABLE 13. ELECTRIC MOTOR MARKET FOR BEARINGS, BY REGION, 2020-2032 ($MILLION)
- TABLE 14. ELECTRIC MOTOR MARKET FOR BEARINGS, BY REGION, 2020-2032 (MILLION UNITS)
- TABLE 15. ELECTRIC MOTOR MARKET FOR FRAME, BY REGION, 2020-2032 ($MILLION)
- TABLE 16. ELECTRIC MOTOR MARKET FOR FRAME, BY REGION, 2020-2032 (MILLION UNITS)
- TABLE 17. ELECTRIC MOTOR MARKET FOR END-BRACKET, BY REGION, 2020-2032 ($MILLION)
- TABLE 18. ELECTRIC MOTOR MARKET FOR END-BRACKET, BY REGION, 2020-2032 (MILLION UNITS)
- TABLE 19. ELECTRIC MOTOR MARKET FOR OTHERS, BY REGION, 2020-2032 ($MILLION)
- TABLE 20. ELECTRIC MOTOR MARKET FOR OTHERS, BY REGION, 2020-2032 (MILLION UNITS)
- TABLE 21. GLOBAL ELECTRIC MOTOR MARKET, BY APPLICATION, 2020-2032 ($MILLION)
- TABLE 22. GLOBAL ELECTRIC MOTOR MARKET, BY APPLICATION, 2020-2032 (MILLION UNITS)
- TABLE 23. ELECTRIC MOTOR MARKET FOR AUTOMOBILE - TRACTION MOTOR, BY REGION, 2020-2032 ($MILLION)
- TABLE 24. ELECTRIC MOTOR MARKET FOR AUTOMOBILE - TRACTION MOTOR, BY REGION, 2020-2032 (MILLION UNITS)
- TABLE 25. ELECTRIC MOTOR MARKET FOR AUTOMOBILE - NON TRACTION MOTOR, BY REGION, 2020-2032 ($MILLION)
- TABLE 26. ELECTRIC MOTOR MARKET FOR AUTOMOBILE - NON TRACTION MOTOR, BY REGION, 2020-2032 (MILLION UNITS)
- TABLE 27. ELECTRIC MOTOR MARKET FOR HVAC, BY REGION, 2020-2032 ($MILLION)
- TABLE 28. ELECTRIC MOTOR MARKET FOR HVAC, BY REGION, 2020-2032 (MILLION UNITS)
- TABLE 29. ELECTRIC MOTOR MARKET FOR MEDICAL EQUIPMENT, BY REGION, 2020-2032 ($MILLION)
- TABLE 30. ELECTRIC MOTOR MARKET FOR MEDICAL EQUIPMENT, BY REGION, 2020-2032 (MILLION UNITS)
- TABLE 31. ELECTRIC MOTOR MARKET FOR INDUSTRIAL MACHINERY, BY REGION, 2020-2032 ($MILLION)
- TABLE 32. ELECTRIC MOTOR MARKET FOR INDUSTRIAL MACHINERY, BY REGION, 2020-2032 (MILLION UNITS)
- TABLE 33. ELECTRIC MOTOR MARKET FOR HOUSEHOLD APPLIANCES, BY REGION, 2020-2032 ($MILLION)
- TABLE 34. ELECTRIC MOTOR MARKET FOR HOUSEHOLD APPLIANCES, BY REGION, 2020-2032 (MILLION UNITS)
- TABLE 35. ELECTRIC MOTOR MARKET FOR OTHERS, BY REGION, 2020-2032 ($MILLION)
- TABLE 36. ELECTRIC MOTOR MARKET FOR OTHERS, BY REGION, 2020-2032 (MILLION UNITS)
- TABLE 37. ELECTRIC MOTOR MARKET, BY REGION, 2020-2032 ($MILLION)
- TABLE 38. ELECTRIC MOTOR MARKET, BY REGION, 2020-2032 (MILLION UNITS)
- TABLE 39. NORTH AMERICA ELECTRIC MOTOR MARKET, BY MOTOR TYPE, 2020-2032 ($MILLION)
- TABLE 40. NORTH AMERICA ELECTRIC MOTOR MARKET, BY MOTOR TYPE, 2020-2032 (MILLION UNITS)
- TABLE 41. NORTH AMERICA ELECTRIC MOTOR MARKET, BY COMPONENT, 2020-2032 ($MILLION)
- TABLE 42. NORTH AMERICA ELECTRIC MOTOR MARKET, BY COMPONENT, 2020-2032 (MILLION UNITS)
- TABLE 43. NORTH AMERICA ELECTRIC MOTOR MARKET, BY APPLICATION, 2020-2032 ($MILLION)
- TABLE 44. NORTH AMERICA ELECTRIC MOTOR MARKET, BY APPLICATION, 2020-2032 (MILLION UNITS)
- TABLE 45. NORTH AMERICA ELECTRIC MOTOR MARKET, BY COUNTRY, 2020-2032 ($MILLION)
- TABLE 46. NORTH AMERICA ELECTRIC MOTOR MARKET, BY COUNTRY, 2020-2032 (MILLION UNITS)
- TABLE 47. U.S. ELECTRIC MOTOR MARKET, BY MOTOR TYPE, 2020-2032 ($MILLION)
- TABLE 48. U.S. ELECTRIC MOTOR MARKET, BY MOTOR TYPE, 2020-2032 (MILLION UNITS)
- TABLE 49. U.S. ELECTRIC MOTOR MARKET, BY COMPONENT, 2020-2032 ($MILLION)
- TABLE 50. U.S. ELECTRIC MOTOR MARKET, BY COMPONENT, 2020-2032 (MILLION UNITS)
- TABLE 51. U.S. ELECTRIC MOTOR MARKET, BY APPLICATION, 2020-2032 ($MILLION)
- TABLE 52. U.S. ELECTRIC MOTOR MARKET, BY APPLICATION, 2020-2032 (MILLION UNITS)
- TABLE 53. CANADA ELECTRIC MOTOR MARKET, BY MOTOR TYPE, 2020-2032 ($MILLION)
- TABLE 54. CANADA ELECTRIC MOTOR MARKET, BY MOTOR TYPE, 2020-2032 (MILLION UNITS)
- TABLE 55. CANADA ELECTRIC MOTOR MARKET, BY COMPONENT, 2020-2032 ($MILLION)
- TABLE 56. CANADA ELECTRIC MOTOR MARKET, BY COMPONENT, 2020-2032 (MILLION UNITS)
- TABLE 57. CANADA ELECTRIC MOTOR MARKET, BY APPLICATION, 2020-2032 ($MILLION)
- TABLE 58. CANADA ELECTRIC MOTOR MARKET, BY APPLICATION, 2020-2032 (MILLION UNITS)
- TABLE 59. MEXICO ELECTRIC MOTOR MARKET, BY MOTOR TYPE, 2020-2032 ($MILLION)
- TABLE 60. MEXICO ELECTRIC MOTOR MARKET, BY MOTOR TYPE, 2020-2032 (MILLION UNITS)
- TABLE 61. MEXICO ELECTRIC MOTOR MARKET, BY COMPONENT, 2020-2032 ($MILLION)
- TABLE 62. MEXICO ELECTRIC MOTOR MARKET, BY COMPONENT, 2020-2032 (MILLION UNITS)
- TABLE 63. MEXICO ELECTRIC MOTOR MARKET, BY APPLICATION, 2020-2032 ($MILLION)
- TABLE 64. MEXICO ELECTRIC MOTOR MARKET, BY APPLICATION, 2020-2032 (MILLION UNITS)
- TABLE 65. EUROPE ELECTRIC MOTOR MARKET, BY MOTOR TYPE, 2020-2032 ($MILLION)
- TABLE 66. EUROPE ELECTRIC MOTOR MARKET, BY MOTOR TYPE, 2020-2032 (MILLION UNITS)
- TABLE 67. EUROPE ELECTRIC MOTOR MARKET, BY COMPONENT, 2020-2032 ($MILLION)
- TABLE 68. EUROPE ELECTRIC MOTOR MARKET, BY COMPONENT, 2020-2032 (MILLION UNITS)
- TABLE 69. EUROPE ELECTRIC MOTOR MARKET, BY APPLICATION, 2020-2032 ($MILLION)
- TABLE 70. EUROPE ELECTRIC MOTOR MARKET, BY APPLICATION, 2020-2032 (MILLION UNITS)
- TABLE 71. EUROPE ELECTRIC MOTOR MARKET, BY COUNTRY, 2020-2032 ($MILLION)
- TABLE 72. EUROPE ELECTRIC MOTOR MARKET, BY COUNTRY, 2020-2032 (MILLION UNITS)
- TABLE 73. GERMANY ELECTRIC MOTOR MARKET, BY MOTOR TYPE, 2020-2032 ($MILLION)
- TABLE 74. GERMANY ELECTRIC MOTOR MARKET, BY MOTOR TYPE, 2020-2032 (MILLION UNITS)
- TABLE 75. GERMANY ELECTRIC MOTOR MARKET, BY COMPONENT, 2020-2032 ($MILLION)
- TABLE 76. GERMANY ELECTRIC MOTOR MARKET, BY COMPONENT, 2020-2032 (MILLION UNITS)
- TABLE 77. GERMANY ELECTRIC MOTOR MARKET, BY APPLICATION, 2020-2032 ($MILLION)
- TABLE 78. GERMANY ELECTRIC MOTOR MARKET, BY APPLICATION, 2020-2032 (MILLION UNITS)
- TABLE 79. FRANCE ELECTRIC MOTOR MARKET, BY MOTOR TYPE, 2020-2032 ($MILLION)
- TABLE 80. FRANCE ELECTRIC MOTOR MARKET, BY MOTOR TYPE, 2020-2032 (MILLION UNITS)
- TABLE 81. FRANCE ELECTRIC MOTOR MARKET, BY COMPONENT, 2020-2032 ($MILLION)
- TABLE 82. FRANCE ELECTRIC MOTOR MARKET, BY COMPONENT, 2020-2032 (MILLION UNITS)
- TABLE 83. FRANCE ELECTRIC MOTOR MARKET, BY APPLICATION, 2020-2032 ($MILLION)
- TABLE 84. FRANCE ELECTRIC MOTOR MARKET, BY APPLICATION, 2020-2032 (MILLION UNITS)
- TABLE 85. ITALY ELECTRIC MOTOR MARKET, BY MOTOR TYPE, 2020-2032 ($MILLION)
- TABLE 86. ITALY ELECTRIC MOTOR MARKET, BY MOTOR TYPE, 2020-2032 (MILLION UNITS)
- TABLE 87. ITALY ELECTRIC MOTOR MARKET, BY COMPONENT, 2020-2032 ($MILLION)
- TABLE 88. ITALY ELECTRIC MOTOR MARKET, BY COMPONENT, 2020-2032 (MILLION UNITS)
- TABLE 89. ITALY ELECTRIC MOTOR MARKET, BY APPLICATION, 2020-2032 ($MILLION)
- TABLE 90. ITALY ELECTRIC MOTOR MARKET, BY APPLICATION, 2020-2032 (MILLION UNITS)
- TABLE 91. UK ELECTRIC MOTOR MARKET, BY MOTOR TYPE, 2020-2032 ($MILLION)
- TABLE 92. UK ELECTRIC MOTOR MARKET, BY MOTOR TYPE, 2020-2032 (MILLION UNITS)
- TABLE 93. UK ELECTRIC MOTOR MARKET, BY COMPONENT, 2020-2032 ($MILLION)
- TABLE 94. UK ELECTRIC MOTOR MARKET, BY COMPONENT, 2020-2032 (MILLION UNITS)
- TABLE 95. UK ELECTRIC MOTOR MARKET, BY APPLICATION, 2020-2032 ($MILLION)
- TABLE 96. UK ELECTRIC MOTOR MARKET, BY APPLICATION, 2020-2032 (MILLION UNITS)
- TABLE 97. REST OF EUROPE ELECTRIC MOTOR MARKET, BY MOTOR TYPE, 2020-2032 ($MILLION)
- TABLE 98. REST OF EUROPE ELECTRIC MOTOR MARKET, BY MOTOR TYPE, 2020-2032 (MILLION UNITS)
- TABLE 99. REST OF EUROPE ELECTRIC MOTOR MARKET, BY COMPONENT, 2020-2032 ($MILLION)
- TABLE 100. REST OF EUROPE ELECTRIC MOTOR MARKET, BY COMPONENT, 2020-2032 (MILLION UNITS)
- TABLE 101. REST OF EUROPE ELECTRIC MOTOR MARKET, BY APPLICATION, 2020-2032 ($MILLION)
- TABLE 102. REST OF EUROPE ELECTRIC MOTOR MARKET, BY APPLICATION, 2020-2032 (MILLION UNITS)
- TABLE 103. ASIA-PACIFIC ELECTRIC MOTOR MARKET, BY MOTOR TYPE, 2020-2032 ($MILLION)
- TABLE 104. ASIA-PACIFIC ELECTRIC MOTOR MARKET, BY MOTOR TYPE, 2020-2032 (MILLION UNITS)
- TABLE 105. ASIA-PACIFIC ELECTRIC MOTOR MARKET, BY COMPONENT, 2020-2032 ($MILLION)
- TABLE 106. ASIA-PACIFIC ELECTRIC MOTOR MARKET, BY COMPONENT, 2020-2032 (MILLION UNITS)
- TABLE 107. ASIA-PACIFIC ELECTRIC MOTOR MARKET, BY APPLICATION, 2020-2032 ($MILLION)
- TABLE 108. ASIA-PACIFIC ELECTRIC MOTOR MARKET, BY APPLICATION, 2020-2032 (MILLION UNITS)
- TABLE 109. ASIA-PACIFIC ELECTRIC MOTOR MARKET, BY COUNTRY, 2020-2032 ($MILLION)
- TABLE 110. ASIA-PACIFIC ELECTRIC MOTOR MARKET, BY COUNTRY, 2020-2032 (MILLION UNITS)
- TABLE 111. CHINA ELECTRIC MOTOR MARKET, BY MOTOR TYPE, 2020-2032 ($MILLION)
- TABLE 112. CHINA ELECTRIC MOTOR MARKET, BY MOTOR TYPE, 2020-2032 (MILLION UNITS)
- TABLE 113. CHINA ELECTRIC MOTOR MARKET, BY COMPONENT, 2020-2032 ($MILLION)
- TABLE 114. CHINA ELECTRIC MOTOR MARKET, BY COMPONENT, 2020-2032 (MILLION UNITS)
- TABLE 115. CHINA ELECTRIC MOTOR MARKET, BY APPLICATION, 2020-2032 ($MILLION)
- TABLE 116. CHINA ELECTRIC MOTOR MARKET, BY APPLICATION, 2020-2032 (MILLION UNITS)
- TABLE 117. JAPAN ELECTRIC MOTOR MARKET, BY MOTOR TYPE, 2020-2032 ($MILLION)
- TABLE 118. JAPAN ELECTRIC MOTOR MARKET, BY MOTOR TYPE, 2020-2032 (MILLION UNITS)
- TABLE 119. JAPAN ELECTRIC MOTOR MARKET, BY COMPONENT, 2020-2032 ($MILLION)
- TABLE 120. JAPAN ELECTRIC MOTOR MARKET, BY COMPONENT, 2020-2032 (MILLION UNITS)
- TABLE 121. JAPAN ELECTRIC MOTOR MARKET, BY APPLICATION, 2020-2032 ($MILLION)
- TABLE 122. JAPAN ELECTRIC MOTOR MARKET, BY APPLICATION, 2020-2032 (MILLION UNITS)
- TABLE 123. INDIA ELECTRIC MOTOR MARKET, BY MOTOR TYPE, 2020-2032 ($MILLION)
- TABLE 124. INDIA ELECTRIC MOTOR MARKET, BY MOTOR TYPE, 2020-2032 (MILLION UNITS)
- TABLE 125. INDIA ELECTRIC MOTOR MARKET, BY COMPONENT, 2020-2032 ($MILLION)
- TABLE 126. INDIA ELECTRIC MOTOR MARKET, BY COMPONENT, 2020-2032 (MILLION UNITS)
- TABLE 127. INDIA ELECTRIC MOTOR MARKET, BY APPLICATION, 2020-2032 ($MILLION)
- TABLE 128. INDIA ELECTRIC MOTOR MARKET, BY APPLICATION, 2020-2032 (MILLION UNITS)
- TABLE 129. SOUTH KOREA ELECTRIC MOTOR MARKET, BY MOTOR TYPE, 2020-2032 ($MILLION)
- TABLE 130. SOUTH KOREA ELECTRIC MOTOR MARKET, BY MOTOR TYPE, 2020-2032 (MILLION UNITS)
- TABLE 131. SOUTH KOREA ELECTRIC MOTOR MARKET, BY COMPONENT, 2020-2032 ($MILLION)
- TABLE 132. SOUTH KOREA ELECTRIC MOTOR MARKET, BY COMPONENT, 2020-2032 (MILLION UNITS)
- TABLE 133. SOUTH KOREA ELECTRIC MOTOR MARKET, BY APPLICATION, 2020-2032 ($MILLION)
- TABLE 134. SOUTH KOREA ELECTRIC MOTOR MARKET, BY APPLICATION, 2020-2032 (MILLION UNITS)
- TABLE 135. REST OF ASIA-PACIFIC ELECTRIC MOTOR MARKET, BY MOTOR TYPE, 2020-2032 ($MILLION)
- TABLE 136. REST OF ASIA-PACIFIC ELECTRIC MOTOR MARKET, BY MOTOR TYPE, 2020-2032 (MILLION UNITS)
- TABLE 137. REST OF ASIA-PACIFIC ELECTRIC MOTOR MARKET, BY COMPONENT, 2020-2032 ($MILLION)
- TABLE 138. REST OF ASIA-PACIFIC ELECTRIC MOTOR MARKET, BY COMPONENT, 2020-2032 (MILLION UNITS)
- TABLE 139. REST OF ASIA-PACIFIC ELECTRIC MOTOR MARKET, BY APPLICATION, 2020-2032 ($MILLION)
- TABLE 140. REST OF ASIA-PACIFIC ELECTRIC MOTOR MARKET, BY APPLICATION, 2020-2032 (MILLION UNITS)
- TABLE 141. LAMEA ELECTRIC MOTOR MARKET, BY MOTOR TYPE, 2020-2032 ($MILLION)
- TABLE 142. LAMEA ELECTRIC MOTOR MARKET, BY MOTOR TYPE, 2020-2032 (MILLION UNITS)
- TABLE 143. LAMEA ELECTRIC MOTOR MARKET, BY COMPONENT, 2020-2032 ($MILLION)
- TABLE 144. LAMEA ELECTRIC MOTOR MARKET, BY COMPONENT, 2020-2032 (MILLION UNITS)
- TABLE 145. LAMEA ELECTRIC MOTOR MARKET, BY APPLICATION, 2020-2032 ($MILLION)
- TABLE 146. LAMEA ELECTRIC MOTOR MARKET, BY APPLICATION, 2020-2032 (MILLION UNITS)
- TABLE 147. LAMEA ELECTRIC MOTOR MARKET, BY COUNTRY, 2020-2032 ($MILLION)
- TABLE 148. LAMEA ELECTRIC MOTOR MARKET, BY COUNTRY, 2020-2032 (MILLION UNITS)
- TABLE 149. LATIN AMERICA ELECTRIC MOTOR MARKET, BY MOTOR TYPE, 2020-2032 ($MILLION)
- TABLE 150. LATIN AMERICA ELECTRIC MOTOR MARKET, BY MOTOR TYPE, 2020-2032 (MILLION UNITS)
- TABLE 151. LATIN AMERICA ELECTRIC MOTOR MARKET, BY COMPONENT, 2020-2032 ($MILLION)
- TABLE 152. LATIN AMERICA ELECTRIC MOTOR MARKET, BY COMPONENT, 2020-2032 (MILLION UNITS)
- TABLE 153. LATIN AMERICA ELECTRIC MOTOR MARKET, BY APPLICATION, 2020-2032 ($MILLION)
- TABLE 154. LATIN AMERICA ELECTRIC MOTOR MARKET, BY APPLICATION, 2020-2032 (MILLION UNITS)
- TABLE 155. MIDDLE EAST ELECTRIC MOTOR MARKET, BY MOTOR TYPE, 2020-2032 ($MILLION)
- TABLE 156. MIDDLE EAST ELECTRIC MOTOR MARKET, BY MOTOR TYPE, 2020-2032 (MILLION UNITS)
- TABLE 157. MIDDLE EAST ELECTRIC MOTOR MARKET, BY COMPONENT, 2020-2032 ($MILLION)
- TABLE 158. MIDDLE EAST ELECTRIC MOTOR MARKET, BY COMPONENT, 2020-2032 (MILLION UNITS)
- TABLE 159. MIDDLE EAST ELECTRIC MOTOR MARKET, BY APPLICATION, 2020-2032 ($MILLION)
- TABLE 160. MIDDLE EAST ELECTRIC MOTOR MARKET, BY APPLICATION, 2020-2032 (MILLION UNITS)
- TABLE 161. AFRICA ELECTRIC MOTOR MARKET, BY MOTOR TYPE, 2020-2032 ($MILLION)
- TABLE 162. AFRICA ELECTRIC MOTOR MARKET, BY MOTOR TYPE, 2020-2032 (MILLION UNITS)
- TABLE 163. AFRICA ELECTRIC MOTOR MARKET, BY COMPONENT, 2020-2032 ($MILLION)
- TABLE 164. AFRICA ELECTRIC MOTOR MARKET, BY COMPONENT, 2020-2032 (MILLION UNITS)
- TABLE 165. AFRICA ELECTRIC MOTOR MARKET, BY APPLICATION, 2020-2032 ($MILLION)
- TABLE 166. AFRICA ELECTRIC MOTOR MARKET, BY APPLICATION, 2020-2032 (MILLION UNITS)
- TABLE 167. ABB: KEY EXECUTIVES
- TABLE 168. ABB: COMPANY SNAPSHOT
- TABLE 169. ABB: PRODUCT SEGMENTS
- TABLE 170. ABB: PRODUCT PORTFOLIO
- TABLE 171. ABB: KEY STRATERGIES
- TABLE 172. ARC SYSTEMS INC.: KEY EXECUTIVES
- TABLE 173. ARC SYSTEMS INC.: COMPANY SNAPSHOT
- TABLE 174. ARC SYSTEMS INC.: PRODUCT SEGMENTS
- TABLE 175. ARC SYSTEMS INC.: PRODUCT PORTFOLIO
- TABLE 176. DENSO CORPORATION: KEY EXECUTIVES
- TABLE 177. DENSO CORPORATION: COMPANY SNAPSHOT
- TABLE 178. DENSO CORPORATION: PRODUCT SEGMENTS
- TABLE 179. DENSO CORPORATION: PRODUCT PORTFOLIO
- TABLE 180. EMERSON ELECTRIC CO.: KEY EXECUTIVES
- TABLE 181. EMERSON ELECTRIC CO.: COMPANY SNAPSHOT
- TABLE 182. EMERSON ELECTRIC CO.: PRODUCT SEGMENTS
- TABLE 183. EMERSON ELECTRIC CO.: PRODUCT PORTFOLIO
- TABLE 184. JOHNSON ELECTRIC HOLDINGS LIMITED: KEY EXECUTIVES
- TABLE 185. JOHNSON ELECTRIC HOLDINGS LIMITED: COMPANY SNAPSHOT
- TABLE 186. JOHNSON ELECTRIC HOLDINGS LIMITED: PRODUCT SEGMENTS
- TABLE 187. JOHNSON ELECTRIC HOLDINGS LIMITED: PRODUCT PORTFOLIO
- TABLE 188. JOHNSON ELECTRIC HOLDINGS LIMITED: KEY STRATERGIES
- TABLE 189. MAXON: KEY EXECUTIVES
- TABLE 190. MAXON: COMPANY SNAPSHOT
- TABLE 191. MAXON: PRODUCT SEGMENTS
- TABLE 192. MAXON: PRODUCT PORTFOLIO
- TABLE 193. MAXON: KEY STRATERGIES
- TABLE 194. NIDEC CORPORATION: KEY EXECUTIVES
- TABLE 195. NIDEC CORPORATION: COMPANY SNAPSHOT
- TABLE 196. NIDEC CORPORATION: PRODUCT SEGMENTS
- TABLE 197. NIDEC CORPORATION: PRODUCT PORTFOLIO
- TABLE 198. NIDEC CORPORATION: KEY STRATERGIES
- TABLE 199. REGAL REXNORD CORPORATION: KEY EXECUTIVES
- TABLE 200. REGAL REXNORD CORPORATION: COMPANY SNAPSHOT
- TABLE 201. REGAL REXNORD CORPORATION: PRODUCT SEGMENTS
- TABLE 202. REGAL REXNORD CORPORATION: PRODUCT PORTFOLIO
- TABLE 203. REGAL REXNORD CORPORATION: KEY STRATERGIES
- TABLE 204. ROCKWELL AUTOMATION INC.: KEY EXECUTIVES
- TABLE 205. ROCKWELL AUTOMATION INC.: COMPANY SNAPSHOT
- TABLE 206. ROCKWELL AUTOMATION INC.: SERVICE SEGMENTS
- TABLE 207. ROCKWELL AUTOMATION INC.: PRODUCT PORTFOLIO
- TABLE 208. ROCKWELL AUTOMATION INC.: KEY STRATERGIES
- TABLE 209. SIEMENS AG: KEY EXECUTIVES
- TABLE 210. SIEMENS AG: COMPANY SNAPSHOT
- TABLE 211. SIEMENS AG: PRODUCT SEGMENTS
- TABLE 212. SIEMENS AG: PRODUCT PORTFOLIO
- TABLE 213. SIEMENS AG: KEY STRATERGIES
LIST OF FIGURES
- FIGURE 01. ELECTRIC MOTOR MARKET, 2020-2032
- FIGURE 02. SEGMENTATION OF ELECTRIC MOTOR MARKET,2020-2032
- FIGURE 03. TOP IMPACTING FACTORS IN ELECTRIC MOTOR MARKET (2022 TO 2032)
- FIGURE 04. TOP INVESTMENT POCKETS IN ELECTRIC MOTOR MARKET (2023-2032)
- FIGURE 05. LOW BARGAINING POWER OF SUPPLIERS
- FIGURE 06. LOW THREAT OF NEW ENTRANTS
- FIGURE 07. LOW THREAT OF SUBSTITUTES
- FIGURE 08. LOW INTENSITY OF RIVALRY
- FIGURE 09. LOW BARGAINING POWER OF BUYERS
- FIGURE 10. GLOBAL ELECTRIC MOTOR MARKET:DRIVERS, RESTRAINTS AND OPPORTUNITIES
- FIGURE 11. ELECTRIC MOTOR MARKET, BY MOTOR TYPE, 2020 AND 2032(%)
- FIGURE 12. COMPARATIVE SHARE ANALYSIS OF ELECTRIC MOTOR MARKET FOR ALTERNATE CURRENT (AC) MOTOR, BY COUNTRY 2020 AND 2032(%)
- FIGURE 13. COMPARATIVE SHARE ANALYSIS OF ELECTRIC MOTOR MARKET FOR DIRECT CURRENT (DC) MOTOR, BY COUNTRY 2020 AND 2032(%)
- FIGURE 14. ELECTRIC MOTOR MARKET, BY COMPONENT, 2020 AND 2032(%)
- FIGURE 15. COMPARATIVE SHARE ANALYSIS OF ELECTRIC MOTOR MARKET FOR ROTOR, BY COUNTRY 2020 AND 2032(%)
- FIGURE 16. COMPARATIVE SHARE ANALYSIS OF ELECTRIC MOTOR MARKET FOR STATOR, BY COUNTRY 2020 AND 2032(%)
- FIGURE 17. COMPARATIVE SHARE ANALYSIS OF ELECTRIC MOTOR MARKET FOR BEARINGS, BY COUNTRY 2020 AND 2032(%)
- FIGURE 18. COMPARATIVE SHARE ANALYSIS OF ELECTRIC MOTOR MARKET FOR FRAME, BY COUNTRY 2020 AND 2032(%)
- FIGURE 19. COMPARATIVE SHARE ANALYSIS OF ELECTRIC MOTOR MARKET FOR END-BRACKET, BY COUNTRY 2020 AND 2032(%)
- FIGURE 20. COMPARATIVE SHARE ANALYSIS OF ELECTRIC MOTOR MARKET FOR OTHERS, BY COUNTRY 2020 AND 2032(%)
- FIGURE 21. ELECTRIC MOTOR MARKET, BY APPLICATION, 2020 AND 2032(%)
- FIGURE 22. COMPARATIVE SHARE ANALYSIS OF ELECTRIC MOTOR MARKET FOR AUTOMOBILE - TRACTION MOTOR, BY COUNTRY 2020 AND 2032(%)
- FIGURE 23. COMPARATIVE SHARE ANALYSIS OF ELECTRIC MOTOR MARKET FOR AUTOMOBILE - NON TRACTION MOTOR, BY COUNTRY 2020 AND 2032(%)
- FIGURE 24. COMPARATIVE SHARE ANALYSIS OF ELECTRIC MOTOR MARKET FOR HVAC, BY COUNTRY 2020 AND 2032(%)
- FIGURE 25. COMPARATIVE SHARE ANALYSIS OF ELECTRIC MOTOR MARKET FOR MEDICAL EQUIPMENT, BY COUNTRY 2020 AND 2032(%)
- FIGURE 26. COMPARATIVE SHARE ANALYSIS OF ELECTRIC MOTOR MARKET FOR INDUSTRIAL MACHINERY, BY COUNTRY 2020 AND 2032(%)
- FIGURE 27. COMPARATIVE SHARE ANALYSIS OF ELECTRIC MOTOR MARKET FOR HOUSEHOLD APPLIANCES, BY COUNTRY 2020 AND 2032(%)
- FIGURE 28. COMPARATIVE SHARE ANALYSIS OF ELECTRIC MOTOR MARKET FOR OTHERS, BY COUNTRY 2020 AND 2032(%)
- FIGURE 29. ELECTRIC MOTOR MARKET BY REGION, 2020 AND 2032(%)
- FIGURE 30. U.S. ELECTRIC MOTOR MARKET, 2020-2032 ($MILLION)
- FIGURE 31. CANADA ELECTRIC MOTOR MARKET, 2020-2032 ($MILLION)
- FIGURE 32. MEXICO ELECTRIC MOTOR MARKET, 2020-2032 ($MILLION)
- FIGURE 33. GERMANY ELECTRIC MOTOR MARKET, 2020-2032 ($MILLION)
- FIGURE 34. FRANCE ELECTRIC MOTOR MARKET, 2020-2032 ($MILLION)
- FIGURE 35. ITALY ELECTRIC MOTOR MARKET, 2020-2032 ($MILLION)
- FIGURE 36. UK ELECTRIC MOTOR MARKET, 2020-2032 ($MILLION)
- FIGURE 37. REST OF EUROPE ELECTRIC MOTOR MARKET, 2020-2032 ($MILLION)
- FIGURE 38. CHINA ELECTRIC MOTOR MARKET, 2020-2032 ($MILLION)
- FIGURE 39. JAPAN ELECTRIC MOTOR MARKET, 2020-2032 ($MILLION)
- FIGURE 40. INDIA ELECTRIC MOTOR MARKET, 2020-2032 ($MILLION)
- FIGURE 41. SOUTH KOREA ELECTRIC MOTOR MARKET, 2020-2032 ($MILLION)
- FIGURE 42. REST OF ASIA-PACIFIC ELECTRIC MOTOR MARKET, 2020-2032 ($MILLION)
- FIGURE 43. LATIN AMERICA ELECTRIC MOTOR MARKET, 2020-2032 ($MILLION)
- FIGURE 44. MIDDLE EAST ELECTRIC MOTOR MARKET, 2020-2032 ($MILLION)
- FIGURE 45. AFRICA ELECTRIC MOTOR MARKET, 2020-2032 ($MILLION)
- FIGURE 46. TOP WINNING STRATEGIES, BY YEAR (2021-2023)
- FIGURE 47. TOP WINNING STRATEGIES, BY DEVELOPMENT (2021-2023)
- FIGURE 48. TOP WINNING STRATEGIES, BY COMPANY (2021-2023)
- FIGURE 49. PRODUCT MAPPING OF TOP 10 PLAYERS
- FIGURE 50. COMPETITIVE DASHBOARD
- FIGURE 51. COMPETITIVE HEATMAP: ELECTRIC MOTOR MARKET
- FIGURE 52. TOP PLAYER POSITIONING, 2020
- FIGURE 53. ABB: NET REVENUE, 2020-2022 ($MILLION)
- FIGURE 54. ABB: RESEARCH & DEVELOPMENT EXPENDITURE, 2020-2022 ($MILLION)
- FIGURE 55. ABB: REVENUE SHARE BY SEGMENT, 2022 (%)
- FIGURE 56. ABB: REVENUE SHARE BY REGION, 2022 (%)
- FIGURE 57. DENSO CORPORATION: NET REVENUE, 2020-2022 ($MILLION)
- FIGURE 58. EMERSON ELECTRIC CO.: NET SALES, 2020-2022 ($MILLION)
- FIGURE 59. EMERSON ELECTRIC CO.: REVENUE SHARE BY REGION, 2022 (%)
- FIGURE 60. JOHNSON ELECTRIC HOLDINGS LIMITED: NET SALES, 2020-2022 ($MILLION)
- FIGURE 61. JOHNSON ELECTRIC HOLDINGS LIMITED: REVENUE SHARE BY SEGMENT, 2022 (%)
- FIGURE 62. JOHNSON ELECTRIC HOLDINGS LIMITED: REVENUE SHARE BY REGION, 2022 (%)
- FIGURE 63. MAXON: NET REVENUE, 2020-2022 ($MILLION)
- FIGURE 64. NIDEC CORPORATION: NET REVENUE, 2020-2022 ($MILLION)
- FIGURE 65. NIDEC CORPORATION: RESEARCH & DEVELOPMENT EXPENDITURE, 2020-2022 ($MILLION)
- FIGURE 66. NIDEC CORPORATION: REVENUE SHARE BY SEGMENT, 2022 (%)
- FIGURE 67. NIDEC CORPORATION: REVENUE SHARE BY REGION, 2022 (%)
- FIGURE 68. REGAL REXNORD CORPORATION: NET SALES, 2020-2022 ($MILLION)
- FIGURE 69. REGAL REXNORD CORPORATION: RESEARCH & DEVELOPMENT EXPENDITURE, 2020-2022 ($MILLION)
- FIGURE 70. REGAL REXNORD CORPORATION: REVENUE SHARE BY REGION, 2022 (%)
- FIGURE 71. REGAL REXNORD CORPORATION: REVENUE SHARE BY SEGMENT, 2022 (%)
- FIGURE 72. ROCKWELL AUTOMATION INC.: NET SALES, 2020-2022 ($MILLION)
- FIGURE 73. ROCKWELL AUTOMATION INC.: REVENUE SHARE BY SEGMENT, 2022 (%)
- FIGURE 74. ROCKWELL AUTOMATION INC.: REVENUE SHARE BY REGION, 2022 (%)
- FIGURE 75. SIEMENS AG: NET REVENUE, 2020-2022 ($MILLION)
- FIGURE 76. SIEMENS AG: RESEARCH & DEVELOPMENT EXPENDITURE, 2020-2022 ($MILLION)
- FIGURE 77. SIEMENS AG: REVENUE SHARE BY SEGMENT, 2022 (%)
- FIGURE 78. SIEMENS AG: REVENUE SHARE BY REGION, 2022 (%)
According to a new report published by Allied Market Research, titled, "Electric Motor Market," The electric motor market was valued at $142.2 billion in 2020, and is estimated to reach $373.9 billion by 2032, growing at a CAGR of 9.5% from 2023 to 2032.
Electric motors have witnessed an increase in demand from industrial and non-industrial sectors owing to their versatile usage. Features of a properly designed electric motor such as
1) high efficiency, high torque, durability, outstanding controllability, and reliability boost its adoption in many industrial applications. In the last few years, the industrial sector has seen a substantial rise, especially in developing countries. Moreover, rise in trend of sustainable development promotes the use of eco-friendly products, which eventually drives demand for energy-efficient motors.
However, the high upfront cost of specialized motors and their high maintenance cost restrain the market growth. Furthermore, a rise in demand for electric motors for robotics and automated robot technologies is anticipated to provide lucrative opportunities for growth of the electric motor market.
The electric motor market is segmented into motor type, component, application, and region. On the basis of motor type, the market is divided into alternate current (AC) motor and direct current (DC) motor. Depending on component, the market is categorized into rotor, stator, bearings, frame, end-bracket, and others. By application, the market is classified into automobile-traction motor, automobile-non traction motor, HVAC, medical equipment, industrial machinery, home appliances, and others.
Region-wise, it is analyzed across North America (U.S., Canada, and Mexico), Europe (Germany, France, Italy, UK, and rest of Europe), Asia-Pacific (China, India, Japan, South Korea, and rest of Asia-Pacific), and LAMEA (Latin America, Middle East, and Africa).
Competition Analysis
Key companies profiled in the electric motor market report include ABB, Denso Corporation, Emerson Electric Co., Johnson Electric Holdings Limited, Maxon, NIDEC CORPORATION, Regal Rexnord Corporation, Rockwell Automation Inc., Siemens AG, and Arc Systems Inc. The major players that operate in the global market have adopted key strategies such as
1) acquisition, business expansion, product launch, and other strategies to strengthen their market outreach and sustain the stiff competition in the market.
Key Benefits For Stakeholders
- This report provides a quantitative analysis of the market segments, current trends, estimations, and dynamics of the electric motor market analysis from 2020 to 2032 to identify the prevailing electric motor market opportunities.
- The market research is offered along with information related to key drivers, restraints, and opportunities.
- Porter's five forces analysis highlights the potency of buyers and suppliers to enable stakeholders make profit-oriented business decisions and strengthen their supplier-buyer network.
- In-depth analysis of the electric motor market segmentation assists to determine the prevailing market opportunities.
- Major countries in each region are mapped according to their revenue contribution to the global market.
- Market player positioning facilitates benchmarking and provides a clear understanding of the present position of the market players.
- The report includes the analysis of the regional as well as global electric motor market trends, key players, market segments, application areas, and market growth strategies.
Additional benefits you will get with this purchase are:
- Quarterly Update and* (only available with a corporate license, on listed price)
- 5 additional Company Profile of client Choice pre- or Post-purchase, as a free update.
- Free Upcoming Version on the Purchase of Five and Enterprise User License.
- 16 analyst hours of support* (post-purchase, if you find additional data requirements upon review of the report, you may receive support amounting to 16 analyst hours to solve questions, and post-sale queries)
- 15% Free Customization* (in case the scope or segment of the report does not match your requirements, 15% is equivalent to 3 working days of free work, applicable once)
- Free data Pack on the Five and Enterprise User License. (Excel version of the report)
- Free Updated report if the report is 6-12 months old or older.
- 24-hour priority response*
- Free Industry updates and white papers.
Possible Customization with this report (with additional cost and timeline, please talk to the sales executive to know more)
- Manufacturing Capacity
- End user preferences and pain points
- Product Benchmarking / Product specification and applications
- Product Life Cycles
- Senario Analysis & Growth Trend Comparision
- Supply Chain Analysis & Vendor Margins
- Technology Trend Analysis
- Distributor margin Analysis
- Go To Market Strategy
- Market share analysis of players by products/segments
- New Product Development/ Product Matrix of Key Players
- Regulatory Guidelines
- Strategic Recommedations
- Additional company profiles with specific to client's interest
- Additional country or region analysis- market size and forecast
- Average Selling Price Analysis / Price Point Analysis
- Brands Share Analysis
- Criss-cross segment analysis- market size and forecast
- Expanded list for Company Profiles
- Historic market data
- Import Export Analysis/Data
- Key player details (including location, contact details, supplier/vendor network etc. in excel format)
- List of customers/consumers/raw material suppliers- value chain analysis
- Market share analysis of players at global/region/country level
- Per Capita Consumption Trends
- Product Consumption Analysis
- Reimbursement Scenario
- SWOT Analysis
- Volume Market Size and Forecast
Key Market Segments
By Component
- Rotor
- Stator
- Bearings
- Frame
- End-bracket
- Others
By Motor type
- Alternate Current (AC) Motor
- Direct Current (DC) Motor
By Application
- Automobile - traction motor
- Automobile - non traction motor
- HVAC
- Medical equipment
- Industrial machinery
- Household appliances
- Others
By Region
- North America
- U.S.
- Canada
- Mexico
- Europe
- Germany
- France
- Italy
- UK
- Rest of Europe
- Asia-Pacific
- China
- Japan
- India
- South Korea
- Rest of Asia-Pacific
- LAMEA
- Latin America
- Middle East
- Africa
Key Market Players:
- Emerson Electric Co.
- NIDEC CORPORATION
- Rockwell Automation Inc.
- Siemens AG
- ABB
- Johnson Electric Holdings Limited
- Denso Corporation
- Maxon
- Regal Rexnord Corporation
- Arc Systems Inc.
TABLE OF CONTENTS
CHAPTER 1: INTRODUCTION
- 1.1. Report description
- 1.2. Key market segments
- 1.3. Key benefits to the stakeholders
- 1.4. Research methodology
- 1.4.1. Primary research
- 1.4.2. Secondary research
- 1.4.3. Analyst tools and models
CHAPTER 2: EXECUTIVE SUMMARY
- 2.1. CXO Perspective
CHAPTER 3: MARKET OVERVIEW
- 3.1. Market definition and scope
- 3.2. Key findings
- 3.2.1. Top impacting factors
- 3.2.2. Top investment pockets
- 3.3. Porter's five forces analysis
- 3.3.1. Low bargaining power of suppliers
- 3.3.2. Low threat of new entrants
- 3.3.3. Low threat of substitutes
- 3.3.4. Low intensity of rivalry
- 3.3.5. Low bargaining power of buyers
- 3.4. Market dynamics
- 3.4.1. Drivers
- 3.4.1.1. Increase in demand for energy-efficient electric motors
- 3.4.1.2. Increased sales of consumer electronics and appliances in developing countries
- 3.4.1.3. Rise in demand for electric vehicles
- 3.4.2. Restraints
- 3.4.2.1. High initial cost of electric motors
- 3.4.3. Opportunities
- 3.4.3.1. Advancements in technology
- 3.4.1. Drivers
CHAPTER 4: ELECTRIC MOTOR MARKET, BY MOTOR TYPE
- 4.1. Overview
- 4.1.1. Market size and forecast
- 4.2. Alternate Current (AC) Motor
- 4.2.1. Key market trends, growth factors and opportunities
- 4.2.2. Market size and forecast, by region
- 4.2.3. Market share analysis by country
- 4.3. Direct Current (DC) Motor
- 4.3.1. Key market trends, growth factors and opportunities
- 4.3.2. Market size and forecast, by region
- 4.3.3. Market share analysis by country
CHAPTER 5: ELECTRIC MOTOR MARKET, BY COMPONENT
- 5.1. Overview
- 5.1.1. Market size and forecast
- 5.2. Rotor
- 5.2.1. Key market trends, growth factors and opportunities
- 5.2.2. Market size and forecast, by region
- 5.2.3. Market share analysis by country
- 5.3. Stator
- 5.3.1. Key market trends, growth factors and opportunities
- 5.3.2. Market size and forecast, by region
- 5.3.3. Market share analysis by country
- 5.4. Bearings
- 5.4.1. Key market trends, growth factors and opportunities
- 5.4.2. Market size and forecast, by region
- 5.4.3. Market share analysis by country
- 5.5. Frame
- 5.5.1. Key market trends, growth factors and opportunities
- 5.5.2. Market size and forecast, by region
- 5.5.3. Market share analysis by country
- 5.6. End-bracket
- 5.6.1. Key market trends, growth factors and opportunities
- 5.6.2. Market size and forecast, by region
- 5.6.3. Market share analysis by country
- 5.7. Others
- 5.7.1. Key market trends, growth factors and opportunities
- 5.7.2. Market size and forecast, by region
- 5.7.3. Market share analysis by country
CHAPTER 6: ELECTRIC MOTOR MARKET, BY APPLICATION
- 6.1. Overview
- 6.1.1. Market size and forecast
- 6.2. Automobile - traction motor
- 6.2.1. Key market trends, growth factors and opportunities
- 6.2.2. Market size and forecast, by region
- 6.2.3. Market share analysis by country
- 6.3. Automobile - non traction motor
- 6.3.1. Key market trends, growth factors and opportunities
- 6.3.2. Market size and forecast, by region
- 6.3.3. Market share analysis by country
- 6.4. HVAC
- 6.4.1. Key market trends, growth factors and opportunities
- 6.4.2. Market size and forecast, by region
- 6.4.3. Market share analysis by country
- 6.5. Medical equipment
- 6.5.1. Key market trends, growth factors and opportunities
- 6.5.2. Market size and forecast, by region
- 6.5.3. Market share analysis by country
- 6.6. Industrial machinery
- 6.6.1. Key market trends, growth factors and opportunities
- 6.6.2. Market size and forecast, by region
- 6.6.3. Market share analysis by country
- 6.7. Household appliances
- 6.7.1. Key market trends, growth factors and opportunities
- 6.7.2. Market size and forecast, by region
- 6.7.3. Market share analysis by country
- 6.8. Others
- 6.8.1. Key market trends, growth factors and opportunities
- 6.8.2. Market size and forecast, by region
- 6.8.3. Market share analysis by country
CHAPTER 7: ELECTRIC MOTOR MARKET, BY REGION
- 7.1. Overview
- 7.1.1. Market size and forecast By Region
- 7.2. North America
- 7.2.1. Key market trends, growth factors and opportunities
- 7.2.2. Market size and forecast, by Motor type
- 7.2.3. Market size and forecast, by Component
- 7.2.4. Market size and forecast, by Application
- 7.2.5. Market size and forecast, by country
- 7.2.5.1. U.S.
- 7.2.5.1.1. Market size and forecast, by Motor type
- 7.2.5.1.2. Market size and forecast, by Component
- 7.2.5.1.3. Market size and forecast, by Application
- 7.2.5.2. Canada
- 7.2.5.2.1. Market size and forecast, by Motor type
- 7.2.5.2.2. Market size and forecast, by Component
- 7.2.5.2.3. Market size and forecast, by Application
- 7.2.5.3. Mexico
- 7.2.5.3.1. Market size and forecast, by Motor type
- 7.2.5.3.2. Market size and forecast, by Component
- 7.2.5.3.3. Market size and forecast, by Application
- 7.3. Europe
- 7.3.1. Key market trends, growth factors and opportunities
- 7.3.2. Market size and forecast, by Motor type
- 7.3.3. Market size and forecast, by Component
- 7.3.4. Market size and forecast, by Application
- 7.3.5. Market size and forecast, by country
- 7.3.5.1. Germany
- 7.3.5.1.1. Market size and forecast, by Motor type
- 7.3.5.1.2. Market size and forecast, by Component
- 7.3.5.1.3. Market size and forecast, by Application
- 7.3.5.2. France
- 7.3.5.2.1. Market size and forecast, by Motor type
- 7.3.5.2.2. Market size and forecast, by Component
- 7.3.5.2.3. Market size and forecast, by Application
- 7.3.5.3. Italy
- 7.3.5.3.1. Market size and forecast, by Motor type
- 7.3.5.3.2. Market size and forecast, by Component
- 7.3.5.3.3. Market size and forecast, by Application
- 7.3.5.4. UK
- 7.3.5.4.1. Market size and forecast, by Motor type
- 7.3.5.4.2. Market size and forecast, by Component
- 7.3.5.4.3. Market size and forecast, by Application
- 7.3.5.5. Rest of Europe
- 7.3.5.5.1. Market size and forecast, by Motor type
- 7.3.5.5.2. Market size and forecast, by Component
- 7.3.5.5.3. Market size and forecast, by Application
- 7.4. Asia-Pacific
- 7.4.1. Key market trends, growth factors and opportunities
- 7.4.2. Market size and forecast, by Motor type
- 7.4.3. Market size and forecast, by Component
- 7.4.4. Market size and forecast, by Application
- 7.4.5. Market size and forecast, by country
- 7.4.5.1. China
- 7.4.5.1.1. Market size and forecast, by Motor type
- 7.4.5.1.2. Market size and forecast, by Component
- 7.4.5.1.3. Market size and forecast, by Application
- 7.4.5.2. Japan
- 7.4.5.2.1. Market size and forecast, by Motor type
- 7.4.5.2.2. Market size and forecast, by Component
- 7.4.5.2.3. Market size and forecast, by Application
- 7.4.5.3. India
- 7.4.5.3.1. Market size and forecast, by Motor type
- 7.4.5.3.2. Market size and forecast, by Component
- 7.4.5.3.3. Market size and forecast, by Application
- 7.4.5.4. South Korea
- 7.4.5.4.1. Market size and forecast, by Motor type
- 7.4.5.4.2. Market size and forecast, by Component
- 7.4.5.4.3. Market size and forecast, by Application
- 7.4.5.5. Rest of Asia-Pacific
- 7.4.5.5.1. Market size and forecast, by Motor type
- 7.4.5.5.2. Market size and forecast, by Component
- 7.4.5.5.3. Market size and forecast, by Application
- 7.5. LAMEA
- 7.5.1. Key market trends, growth factors and opportunities
- 7.5.2. Market size and forecast, by Motor type
- 7.5.3. Market size and forecast, by Component
- 7.5.4. Market size and forecast, by Application
- 7.5.5. Market size and forecast, by country
- 7.5.5.1. Latin America
- 7.5.5.1.1. Market size and forecast, by Motor type
- 7.5.5.1.2. Market size and forecast, by Component
- 7.5.5.1.3. Market size and forecast, by Application
- 7.5.5.2. Middle East
- 7.5.5.2.1. Market size and forecast, by Motor type
- 7.5.5.2.2. Market size and forecast, by Component
- 7.5.5.2.3. Market size and forecast, by Application
- 7.5.5.3. Africa
- 7.5.5.3.1. Market size and forecast, by Motor type
- 7.5.5.3.2. Market size and forecast, by Component
- 7.5.5.3.3. Market size and forecast, by Application
CHAPTER 8: COMPETITIVE LANDSCAPE
- 8.1. Introduction
- 8.2. Top winning strategies
- 8.3. Product mapping of top 10 player
- 8.4. Competitive dashboard
- 8.5. Competitive heatmap
- 8.6. Top player positioning, 2020
CHAPTER 9: COMPANY PROFILES
- 9.1. ABB
- 9.1.1. Company overview
- 9.1.2. Key executives
- 9.1.3. Company snapshot
- 9.1.4. Operating business segments
- 9.1.5. Product portfolio
- 9.1.6. Business performance
- 9.1.7. Key strategic moves and developments
- 9.2. Arc Systems Inc.
- 9.2.1. Company overview
- 9.2.2. Key executives
- 9.2.3. Company snapshot
- 9.2.4. Operating business segments
- 9.2.5. Product portfolio
- 9.3. Denso Corporation
- 9.3.1. Company overview
- 9.3.2. Key executives
- 9.3.3. Company snapshot
- 9.3.4. Operating business segments
- 9.3.5. Product portfolio
- 9.3.6. Business performance
- 9.4. Emerson Electric Co.
- 9.4.1. Company overview
- 9.4.2. Key executives
- 9.4.3. Company snapshot
- 9.4.4. Operating business segments
- 9.4.5. Product portfolio
- 9.4.6. Business performance
- 9.5. Johnson Electric Holdings Limited
- 9.5.1. Company overview
- 9.5.2. Key executives
- 9.5.3. Company snapshot
- 9.5.4. Operating business segments
- 9.5.5. Product portfolio
- 9.5.6. Business performance
- 9.5.7. Key strategic moves and developments
- 9.6. Maxon
- 9.6.1. Company overview
- 9.6.2. Key executives
- 9.6.3. Company snapshot
- 9.6.4. Operating business segments
- 9.6.5. Product portfolio
- 9.6.6. Business performance
- 9.6.7. Key strategic moves and developments
- 9.7. NIDEC CORPORATION
- 9.7.1. Company overview
- 9.7.2. Key executives
- 9.7.3. Company snapshot
- 9.7.4. Operating business segments
- 9.7.5. Product portfolio
- 9.7.6. Business performance
- 9.7.7. Key strategic moves and developments
- 9.8. Regal Rexnord Corporation
- 9.8.1. Company overview
- 9.8.2. Key executives
- 9.8.3. Company snapshot
- 9.8.4. Operating business segments
- 9.8.5. Product portfolio
- 9.8.6. Business performance
- 9.8.7. Key strategic moves and developments
- 9.9. Rockwell Automation Inc.
- 9.9.1. Company overview
- 9.9.2. Key executives
- 9.9.3. Company snapshot
- 9.9.4. Operating business segments
- 9.9.5. Product portfolio
- 9.9.6. Business performance
- 9.9.7. Key strategic moves and developments
- 9.10. Siemens AG
- 9.10.1. Company overview
- 9.10.2. Key executives
- 9.10.3. Company snapshot
- 9.10.4. Operating business segments
- 9.10.5. Product portfolio
- 9.10.6. Business performance
- 9.10.7. Key strategic moves and developments
