概要
温室効果ガス (GHG) の限界削減費用曲線のための独自のサービス
Enerdataの長期限界削減費用曲線(MACC)によって、世界的に認められたPOLESモデルからのユニークな洞察と総合的なデータを入手することができます。 MACCは、GHG緩和方針を明確にし、目標設定を助け、将来のCO 2排出権の価格とボリュームを評価するために使用されています。
EnerdataのMACCプラットフォームでは、気候政策を評価し、コストと効率性を評価し、EU-ETSのような炭素市場をシミュレートすることができます。政策立案者、研究者、ビジネスアナリストのために用意された強力なオンラインツールです。
MACCは、 指定された年、国やセクターで様々な炭素価格水準に達する異なるレベルの排出削減の値を提供します。
主なメリット
- 世界的に認知された POLESエネルギー予測モデルで生成したMACC
- 3つのシナリオ : EnerBase、 EnerBlu、EnerGreen
- 明解なモデリング手法
- いくつかの経済セクターに対する CO 2 及び非CO 2 温室効果ガス(CH 4、N 2 O、SF 6、HFC類およびPFC類)を カバーする国と地域ごとの62のデータ系列
- 24時間オンラインアクセスが可能
- 無制限のExcelエクスポート
- 定期的な更新
サービス概要
- 対象となる65以上の国と地域
- エネルギー、産業における燃焼、産業プロセス、住宅、サービス、輸送、農業における燃焼をカバーする15のセクター
- 2025年、2030年、2040年、2050年のデータシリーズ
- 出力データ:CO2 及び他のGHG削減及び排出レベル炭素価格の予測
- 直感的なオンラインインターフェイス
- AEROオプションモジュールの追加でより詳細な技術オプションを検討可能
- Excelのエクスポート
方法論
- 実績と評判が伴う POLESモデルに基づいたシミュレーション
- 各シナリオ内で、カーボン価格(US $ 15 / tCO2)の変化に基づいて詳細な感度分析が可能
- 様々なシナリオの結果を、国とセクターによって各年の変化する炭素価格で達成される排出削減の観点から表示
MACCをお勧めする方々
MACCは、政策決定者、研究者、ビジネスアナリストが気候政策を評価、そのコストや効率を評価し、EU ETS (欧州連合域内排出量取引制度) などの炭素市場のシミュレーション時に使用できる、非常に強力なツールです。
- 政府機関:CO2削減政策の策定や目標値の設定
- エネルギー企業:将来の収益と炭素制約を評価
- 産業:炭素取引と排出削減のための戦略を策定
- エネルギートレーダー:CO2排出権、価格、量を評価
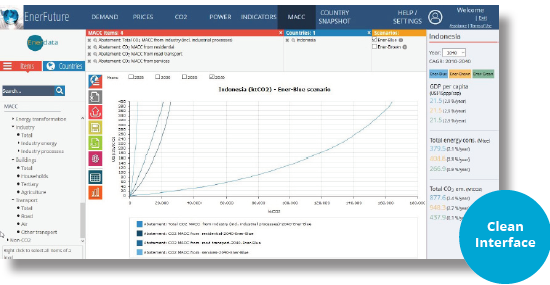
オンラインインターフェース
※画像をクリックすると拡大します
MACCセクターオプション
EnerfutureのサービスにおけるMACCは、POLES-Enerdataモデルによって生成されており、4つの期間 (2025年、2030年、2035年、2050年)、65の国/地域、15部門について、3つの対照的な基礎シナリオで提供されています。
オプション1:統合されたセクター(CO2)
- エネルギー
- 産業燃焼
- 産業プロセス
- 住宅・サービス
- 輸送
オプション2:詳細サブセクター (CO2)
- 発電、その他のエネルギー変換
- 鉄鋼、非金属鉱物、化学、その他の産業
- 世帯、第三次産業、農業
- 道路、航空、その他の交通機関
国/地域ごとの追加データシリーズは、CO2以外のGHG (CH4、N2O、SF6、HFC、PFC) を対象としています。
調査手法
※画像をクリックすると拡大します
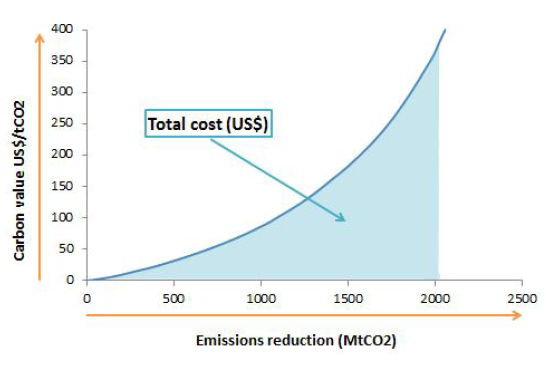
MAC曲線のX軸は排出削減量、Y軸は関連する炭素価値を表し、曲線下の領域は総削減コストを表します。
さらに詳しい情報を提供 ― Enerdata GHG Mitigation ツールボックス
将来の市場をより統合的に把握する必要がある場合、EnerdataはGHG Mitigation ツールボックスをコンサルティングサービスとして提供しています。Enerdataは、様々なツールを使用して、組織の炭素削減戦略と実施プロセスの先進段階における市場の見通しに向け、MACCを採用することができます。
- EVALUATEモデル (排出権取引の経済的評価):各国の排出削減誓約のシミュレーションを行う分析ツール。ユーザーが誓約を入力すると、ツールは強力な指標を提供します (例:削減量、排出原単位、総費用、限界費用、世界の排出量、IPCCシナリオとのギャップなど) 。
- CMTモデル (炭素市場ツール) :世界中の既存および架空の炭素市場の詳細な分析 (国別、セクター別) 。炭素市場の構成に関する複数の設計オプションを提供し、各市場における2050年までの炭素価格を算出します。
- AEROモデル (削減努力、削減オプション) :炭素価格 (または排出上限) の下で開発される技術オプションの特定に役立ちます。民間企業は市場機会を明らかにするために、政府はNAMAやINDCを分析するために使用します。
分析対象国の一覧
欧州
南北アメリカ北米
ラテンアメリカ中米カリブ海
南アメリカ
|
アジア
太平洋
CIS諸国
アフリカ
中近東
|
- 発行日
- 年間契約型情報サービス
- 発行
- ENERDATA
- ページ情報
- 英文