|
年間契約型情報サービス
商品コード
1661290
世界のエネルギー&CO2 データベースGlobal Energy & CO2 Database |
||||||
|
|||||||
| 世界のエネルギー&CO2 データベース |
|
出版日: 年間契約型情報サービス
発行: ENERDATA
ページ情報: 英文
|
全表示
- 概要
- 目次
分析・プレゼンテーション・調査に必要な唯一の情報源
複数のデータソースに悩まされる必要はありません。当データベースは、最も包括的で最新のエネルギーデータを提供し、186カ国のセクター別エネルギーと排出量のデータと傾向を提供します。当データベースは、最も評判の高い国内外の情報源を活用しています。

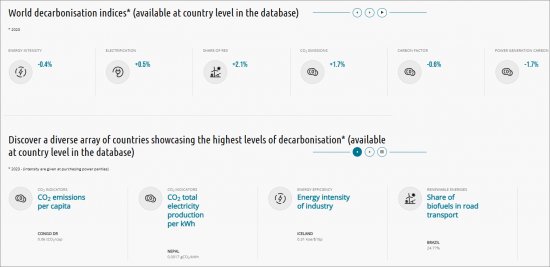
独占的な更新プロセスと定評ある専門知識により、Enerdataは、脱炭素化、電化、世界のエネルギー需給と価格、部門別温室効果ガス排出量に関する包括的な統計と指標を提供しています。
加入のメリット
- 包括的
- 1990年以降のエネルギーと温室効果ガスの年間データ
- 年間最大2000以上の国別データシリーズと指標
- 186カ国の全エネルギーをカバー
- 信頼性
- エネルギー収支と統計における30年の経験
- 最高の国際基準(エネルギー統計に関する国際勧告-IRES)に準拠したデータと指標
- 400以上の世界なプレミアムソース
- 経験豊富なデータ専門家による実証済みのデータ編集と専門知識プロセス
- 継続的な更新:早ければ2025年3月に2024年データ推定値を入手可能
- 使いやすさ:直感的なインターフェース、複数のデータエクスポートフォーマット、クエリ保存
- お客様の作業環境に対応
- すべてのデータは生フォーマットで提供され、Excelおよびcsvフォーマットでダウンロード可能*
- Excel形式とデータベース形式(行指向または列指向)の両方が利用可能
- 時系列の断絶がないため、モデリング作業が容易
- クエリー保存により、モデルや分析に定期的に燃料を供給
*125,000値まで
より多くの指標が利用可能:
CO2排出量
- GDPに対するCO2原単位
- 付加価値に対する産業のCO2原単位
- GDPに対する輸送のCO2原単位
- 家庭の個人消費に対するCO2原単位
- サービスの付加価値に対するCO2原単位
- 農業の付加価値に対するCO2原単位
- 電力生産のCO2排出係数
- 製油所のCO2排出量
再生可能エネルギー
- 電力生産における自然エネルギーのシェア(水力を含む)
- 電力生産における自然エネルギーのシェア(水力を除く)
- 総電力消費量に占める自然エネルギーの割合
- 一次消費に占める自然エネルギーの割合
- 産業消費に占めるバイオマスの割合
- 道路輸送におけるバイオ燃料のシェア
エネルギー効率
- GDPの最終エネルギー原単位
- GDPの電力原単位
- GDP構成が一定の場合のエネルギー原単位
- 産業部門のエネルギー原単位
- 家庭のエネルギー原単位
- サービスのエネルギー原単位
- 輸送のエネルギー原単位
- 農業のエネルギー原単位
- 工業の電力原単位
- 家庭の電力原単位
- サービスの電力原単位
- 農業の電力原単位
The only source you need for analyses, presentations and research.
Why bother struggling with multiple data sources? Global Energy & CO2 Data brings you the most comprehensive and up-to-date energy database, providing data and trends for all energies by sector as well as emissions for 186 countries. This database leverages the most reputable national and international information sources.

Through an exclusive update process and recognised expertise, Enerdata provides a comprehensive set of statistics and indicators on decarbonisation, electrification, global supply, demand and prices for all energies as well as GHG emissions by sector.
Why Subscribe?
- Comprehensive
- Annual energy and GHG data from 1990 onwards
- Up to 2000+ data series and indicators by country per year
- Coverage of all energies in 186 countries
- Reliable
- 30-year experience in energy balances and statistics
- Data and indicators compliant with the best international norms (International Recommendations for Energy Statistics - IRES)
- 400+ global premium sources
- Proven data compilation and expertise process by experienced data specialists
- Continuously updated: 2024 data estimates available as early as March 2025!
- Easy to use: intuitive interface, multiple data export formats and query saving
- Compatible with your work environment
- All data are available in raw format and downloadable in Excel and csv format*
- Both Excel and database formats (row-oriented or column-oriented) available
- No ruptures in time series means easier modelling work
- Query saving to regularly fuel your model or analysis
*Limited to 125 000 values.
More indicators are available:
On CO2 emissions:
- CO2 intensity to GDP
- CO2 intensity of industry to value added
- CO2 intensity of transport to GDP
- CO2 intensity of households to private consumption
- CO2 intensity of services to value added
- CO2 intensity of agriculture to value added
- CO2 emissions factor of the electricity production
- CO2 emissions from refineries
On renewable energies:
- Share of renewables in electricity production (incl. hydro)
- Share of renewables in electricity production (excl. hydro)
- Share of renewables in gross electricity consumption
- Share of renewables in primary consumption
- Share of biomass in industry consumption
- Share of biofuels in road transport
On energy efficiency:
- Final energy intensity of GDP
- Electricity intensity of GDP
- Energy intensity at constant GDP structure
- Energy intensity of industry
- Energy intensity of households
- Energy intensity of services
- Energy intensity of transport
- Energy intensity of agriculture
- Electricity intensity of industry
- Electricity intensity of households
- Electricity intensity of services
- Electricity intensity of agriculture

