|
|
市場調査レポート
商品コード
1462809
eメタノール - 世界市場のシェアとランキング、全体の売上と需要予測(2024年~2030年)E-Methanol - Global Market Share and Ranking, Overall Sales and Demand Forecast 2024-2030 |
||||||
|
|||||||
カスタマイズ可能
適宜更新あり
|
|||||||

| eメタノール - 世界市場のシェアとランキング、全体の売上と需要予測(2024年~2030年) |
|
出版日: 2024年04月13日
発行: QYResearch
ページ情報: 英文 113 Pages
納期: 2~3営業日
|

全表示
- 概要
- 図表
- 目次
世界のeメタノールの市場規模は、2023年に3億2,330万米ドルと推定され、2030年までに246億5,090万米ドルに達し、2024年~2030年の予測期間にCAGRで94.06%の成長が見込まれます。
世界のeメタノールの主要企業は、OCI、BASF、Enerkem、Methanex、Sodra、Alberta Pacific、Carbon Recycling Internationalなどです。2023年、世界の主要5社が収益で約70%のシェアを占めました。
当レポートでは、世界のeメタノール市場について調査分析し、各地域の市場規模と予測、動向と促進要因、主要企業の市場シェアなどの情報を提供しています。
目次
第1章 市場の概要
- eメタノール製品のイントロダクション
- 世界のeメタノールの市場規模の予測
- 世界のeメタノールの売上金額(2019年~2030年)
- 世界のeメタノールの売上数量(2019年~2030年)
- 世界のeメタノールの販売価格(2019年~2030年)
- eメタノール市場の動向と促進要因
- eメタノール産業の動向
- eメタノール市場の促進要因と機会
- eメタノール市場の課題
- eメタノール市場の抑制要因
- 前提条件と制限
- 調査目的
- 考慮される年数
第2章 競合分析:企業別
- 世界のeメタノールの収益:企業別(2019年~2024年)
- 世界のeメタノールの売上数量:企業別(2019年~2024年)
- 世界のeメタノールの平均価格:企業別(2019年~2024年)
- 主要メーカーのeメタノール製造拠点と本社
- eメタノール市場の競合分析
- eメタノールの市場集中度(2019年~2024年)
- 世界のeメタノール収益の5大メーカー(2023年)
- 世界の主要メーカー:企業タイプ別(Tier 1・Tier 2・Tier 3)(2023年時点のeメタノールの収益に基づく)
- 合併と買収、拡大
- 潜在的な競合企業
第3章 セグメント:タイプ別
- イントロダクション:タイプ別
- 廃棄物由来
- 副産物由来
- 世界のeメタノールの売上金額:タイプ別
- 世界のeメタノールの売上金額:タイプ別(2019年・2023年・2030年)
- 世界のeメタノールの売上金額:タイプ別(2019年~2030年)
- 世界のeメタノールの売上金額:タイプ別(2019年~2030年)
- 世界のeメタノールの売上数量:タイプ別
- 世界のeメタノールの売上数量:タイプ別(2019年・2023年・2030年)
- 世界のeメタノールの売上数量:タイプ別(2019年~2030年)
- 世界のeメタノールの売上数量:タイプ別(2019年~2030年)
- 世界のeメタノールの平均価格:タイプ別(2019年~2030年)
第4章 セグメント:用途別
- イントロダクション:用途別
- ガソリン混合
- バイオディーゼル
- その他
- 世界のeメタノールの売上金額:用途別
- 世界のeメタノールの売上金額:用途別(2019年・2023年・2030年)
- 世界のeメタノールの売上金額:用途別(2019年~2030年)
- 世界のeメタノールの売上金額:用途別(2019年~2030年)
- 世界のeメタノールの売上数量:用途別
- 世界のeメタノールの売上数量:用途別(2019年・2023年・2030年)
- 世界のeメタノールの売上数量:用途別(2019年~2030年)
- 世界のeメタノールの売上数量:用途別(2019年~2030年)
- 世界のeメタノールの平均価格:用途別(2019年~2030年)
第5章 セグメント:地域別
- 世界のeメタノールの売上金額:地域別
- 世界のeメタノールの売上金額:地域別(2019年・2023年・2030年)
- 世界のeメタノールの売上金額:地域別(2019年~2024年)
- 世界のeメタノールの売上金額:地域別(2025年~2030年)
- 世界のeメタノールの売上金額:地域別(2019年~2030年)
- 世界のeメタノールの売上数量:地域別
- 世界のeメタノールの売上数量:地域別(2019年・2023年・2030年)
- 世界のeメタノールの売上数量:地域別(2019年~2024年)
- 世界のeメタノールの売上数量:地域別(2025年~2030年)
- 世界のeメタノールの売上数量:地域別(2019年~2030年)
- 世界のeメタノールの平均価格:地域別(2019年~2030年)
- 北米
- 北米のeメタノールの売上金額(2019年~2030年)
- 北米のeメタノールの売上金額:国別(2023年・2030年)
- 欧州
- 欧州のeメタノールの売上金額(2019年~2030年)
- 欧州のeメタノールの売上金額:国別(2023年・2030年)
- アジア太平洋
- アジア太平洋のeメタノールの売上金額(2019年~2030年)
- アジア太平洋のeメタノールの売上金額:地域別(2023年・2030年)
- ラテンアメリカ
- ラテンアメリカのeメタノールの売上金額(2019年~2030年)
- ラテンアメリカのeメタノールの売上金額:国別(2023年・2030年)
- 中東・アフリカ
第6章 セグメント:主要国別、地域別
- 主要国/地域のeメタノールの売上金額の成長の動向(2019年・2023年・2030年)
- 主要国/地域のeメタノールの売上金額
- 主要国/地域のeメタノールの売上金額(2019年~2030年)
- 主要国/地域のeメタノールの売上数量(2019年~2030年)
- 米国
- 米国のeメタノールの売上金額(2019年~2030年)
- 米国のeメタノールの売上金額:タイプ別(2023年)
- 米国のeメタノールの売上金額:用途別(2023年)
- 欧州
- 欧州のeメタノールの売上金額(2019年~2030年)
- 欧州のeメタノールの売上金額:タイプ別(2023年)
- 欧州のeメタノールの売上金額:用途別(2023年)
- 中国
- 中国のeメタノールの売上金額(2019年~2030年)
- 中国のeメタノールの売上金額:タイプ別(2023年)
- 中国のeメタノールの売上金額:用途別(2023年)
第7章 企業プロファイル
- OCI
- BASF
- Enerkem
- Methanex
- Sodra
- Alberta Pacific
第8章 産業チェーン分析
- eメタノールの産業チェーン
- eメタノールの上流分析
- 主な原材料
- 原材料の主要サプライヤー
- 製造コスト構造
- 下流分析(顧客分析)
- 生産方式
- 販売モデルと販売チャネル
- eメタノールの販売業者
第9章 調査結果と結論
第10章 付録
List of Tables
- Table 1. E-Methanol Market Trends
- Table 2. E-Methanol Market Drivers & Opportunity
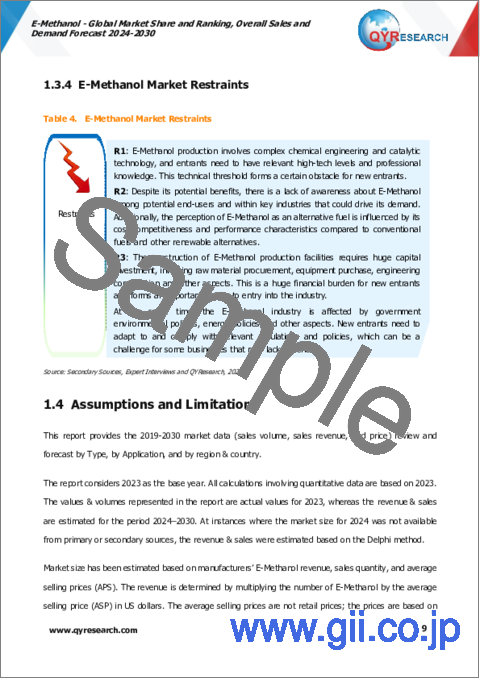
- Table 3. E-Methanol Market Challenges
- Table 4. E-Methanol Market Restraints
- Table 5. Global E-Methanol Revenue by Company (2019-2024) & (US$ Million)
- Table 6. Global E-Methanol Revenue Market Share by Company (2019-2024)
- Table 7. Global E-Methanol Sales Volume by Company (2019-2024) & (K Tons)
- Table 8. Global E-Methanol Sales Volume Market Share by Company (2019-2024)
- Table 9. Global Market E-Methanol Price by Company (2019-2024) & (US$/Ton)
- Table 10. Key Manufacturers E-Methanol Manufacturing Base and Headquarters
- Table 11. Global E-Methanol Manufacturers Market Concentration Ratio (CR5 and HHI)
- Table 12. Global Top Manufacturers Market Share by Company Type (Tier 1, Tier 2, and Tier 3) & (based on the Revenue in E-Methanol as of 2023)
- Table 13. Mergers & Acquisitions, Expansion Plans
- Table 14. Potential Competitors
- Table 15. Global E-Methanol Sales Value by Type: 2019 VS 2023 VS 2030 (US$ Million)
- Table 16. Global E-Methanol Sales Value by Type (2019-2024) & (US$ Million)
- Table 17. Global E-Methanol Sales Value by Type (2025-2030) & (US$ Million)
- Table 18. Global E-Methanol Sales Market Share in Value by Type (2019-2024)
- Table 19. Global E-Methanol Sales Market Share in Value by Type (2025-2030)
- Table 20. Global E-Methanol Sales Volume by Type: 2019 VS 2023 VS 2030 (K Tons)
- Table 21. Global E-Methanol Sales Volume by Type (2019-2024) & (K Tons)
- Table 22. Global E-Methanol Sales Volume by Type (2025-2030) & (K Tons)
- Table 23. Global E-Methanol Sales Market Share in Value by Type (2019-2024)
- Table 24. Global E-Methanol Sales Market Share in Value by Type (2025-2030)
- Table 25. Global E-Methanol Price by Type (2019-2024) & (US$/Ton)
- Table 26. Global E-Methanol Price by Type (2025-2030) & (US$/Ton)
- Table 27. Global E-Methanol Sales Value by Application: 2019 VS 2023 VS 2030 (US$ Million)
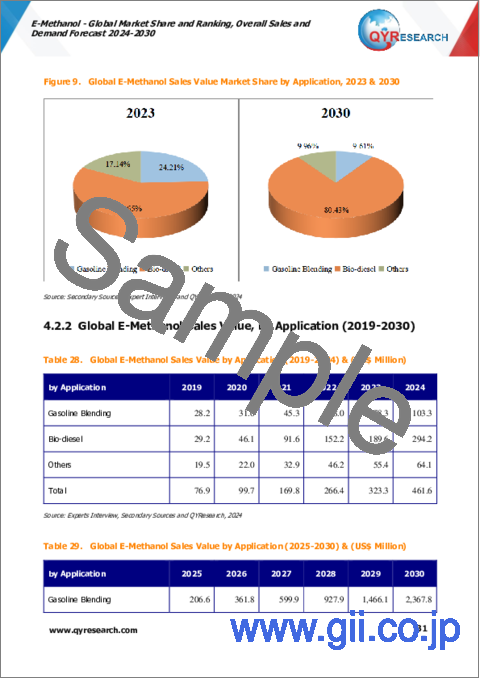
- Table 28. Global E-Methanol Sales Value by Application (2019-2024) & (US$ Million)
- Table 29. Global E-Methanol Sales Value by Application (2025-2030) & (US$ Million)
- Table 30. Global E-Methanol Sales Market Share in Value by Application (2019-2024)
- Table 31. Global E-Methanol Sales Market Share in Value by Application (2025-2030)
- Table 32. Global E-Methanol Sales Volume by Application: 2019 VS 2023 VS 2030 (K Tons)
- Table 33. Global E-Methanol Sales Volume by Application (2019-2024) & (K Tons)
- Table 34. Global E-Methanol Sales Volume by Application (2025-2030) & (K Tons)
- Table 35. Global E-Methanol Sales Market Share in Value by Application (2019-2024)
- Table 36. Global E-Methanol Sales Market Share in Value by Application (2025-2030)
- Table 37. Global E-Methanol Price by Application (2019-2024) & (US$/Ton)
- Table 38. Global E-Methanol Price by Application (2025-2030) & (US$/Ton)
- Table 39. Global E-Methanol Sales Value by Region, (2019 VS 2023 VS 2030) & (US$ Million)
- Table 40. Global E-Methanol Sales Value by Region (2019-2024) & (US$ Million)
- Table 41. Global E-Methanol Sales Value by Region (2025-2030) & (US$ Million)
- Table 42. Global E-Methanol Sales Value by Region (2019-2024) & (%)
- Table 43. Global E-Methanol Sales Value by Region (2025-2030) & (%)
- Table 44. Global E-Methanol Sales Volume by Region (K Tons): 2019 VS 2023 VS 2030
- Table 45. Global E-Methanol Sales Volume by Region (2019-2024) & (K Tons)
- Table 46. Global E-Methanol Sales Volume by Region (2025-2030) & (K Tons)
- Table 47. Global E-Methanol Sales Volume by Region (2019-2024) & (%)
- Table 48. Global E-Methanol Sales Volume by Region (2025-2030) & (%)
- Table 49. Global E-Methanol Average Price by Region (2019-2024) & (US$/Ton)
- Table 50. Global E-Methanol Average Price by Region (2025-2030) & (US$/Ton)
- Table 51. Key Countries/Regions E-Methanol Sales Value Growth Trends, (US$ Million): 2019 VS 2023 VS 2030
- Table 52. Key Countries/Regions E-Methanol Sales Value, (2019-2024) & (US$ Million)
- Table 53. Key Countries/Regions E-Methanol Sales Value, (2025-2030) & (US$ Million)
- Table 54. Key Countries/Regions E-Methanol Sales Volume, (2019-2024) & (K Tons)
- Table 55. Key Countries/Regions E-Methanol Sales Volume, (2025-2030) & (K Tons)
- Table 56. OCI Company Information
- Table 57. OCI E-Methanol Sales (K Tons), Revenue (US$ Million), Price (US$/Ton) and Gross Margin (2019-2024)
- Table 58. BASF Company Information
- Table 59. BASF E-Methanol Sales (K Tons), Revenue (US$ Million), Price (US$/Ton) and Gross Margin (2019-2024)
- Table 60. Enerkem Company Information
- Table 61. Enerkem E-Methanol Sales (K Tons), Revenue (US$ Million), Price (US$/Ton) and Gross Margin (2019-2024)
- Table 62. Methanex Company Information
- Table 63. Methanex E-Methanol Sales (K Tons), Revenue (US$ Million), Price (US$/Ton) and Gross Margin (2019-2024)
- Table 64. Sodra Company Information
- Table 65. Sodra E-Methanol Sales (K Tons), Revenue (US$ Million), Price (US$/Ton) and Gross Margin (2019-2024)
- Table 66. Alberta Pacific Company Information
- Table 67. Alberta Pacific E-Methanol Sales (K Tons), Revenue (US$ Million), Price (US$/Ton) and Gross Margin (2019-2024)
- Table 68. Key Raw Materials Lists
- Table 69. Raw Materials Key Suppliers Lists
- Table 70. E-Methanol Downstream Customers
- Table 71. E-Methanol Distributors List
- Table 72. Research Programs/Design for This Report
- Table 73. Key Data Information from Secondary Sources
- Table 74. Key Data Information from Primary Sources
List of Figures
- Figure 1. E-Methanol Product Picture
- Figure 2. Global E-Methanol Sales Value, 2019 VS 2023 VS 2030 (US$ Million)
- Figure 3. Global E-Methanol Sales Value (2019-2030) & (US$ Million)
- Figure 4. Global E-Methanol Sales Volume (2019-2030) & (K Tons)
- Figure 5. Global E-Methanol Sales Price (2019-2030) & (US$/Ton)
- Figure 6. E-Methanol Report Years Considered
- Figure 7. The 5 Largest Manufacturers in the World: Market Share by E-Methanol Revenue in 2023
- Figure 8. Global E-Methanol Sales Value Market Share by Type, 2023 & 2030
- Figure 9. Global E-Methanol Sales Value Market Share by Application, 2023 & 2030
- Figure 10. North America E-Methanol Sales Value (2019-2030) & (US$ Million)
- Figure 11. North America E-Methanol Sales Value by Country (%), 2023 VS 2030
- Figure 12. Europe E-Methanol Sales Value, (2019-2030) & (US$ Million)
- Figure 13. Europe E-Methanol Sales Value by Country (%), 2023 VS 2030
- Figure 14. Asia Pacific E-Methanol Sales Value, (2019-2030) & (US$ Million)
- Figure 15. Asia Pacific E-Methanol Sales Value by Region (%), 2023 VS 2030
- Figure 16. Latin America E-Methanol Sales Value, (2019-2030) & (US$ Million)
- Figure 17. Latin America E-Methanol Sales Value by Country (%), 2023 VS 2030
- Figure 18. Middle East & Africa E-Methanol Sales Value, (2019-2030) & (US$ Million)
- Figure 19. Middle East & Africa E-Methanol Sales Value by Country (%), 2023 VS 2030
- Figure 20. United States E-Methanol Sales Value, (2019-2030) & (US$ Million)
- Figure 21. United States E-Methanol Sales Value by Type (%), 2023
- Figure 22. United States E-Methanol Sales Value by Application (%), 2023
- Figure 23. Europe E-Methanol Sales Value, (2019-2030) & (US$ Million)
- Figure 24. Europe E-Methanol Sales Value by Type (%), 2023
- Figure 25. Europe E-Methanol Sales Value by Application (%), 2023
- Figure 26. China E-Methanol Sales Value, (2019-2030) & (US$ Million)
- Figure 27. China E-Methanol Sales Value by Type (%), 2023
- Figure 28. China E-Methanol Sales Value by Application (%), 2023
- Figure 29. E-Methanol Industrial Chain
- Figure 30. Global E-Methanol Manufacturing Cost Structure in 2023
- Figure 31. Bottom-up and Top-down Approaches for This Report
- Figure 32. Data Triangulation
- Figure 33. Key Executives Interviewed
The global market for E-Methanol was estimated to be worth US$ 323.3 million in 2023 and is forecast to a readjusted size of US$ 24,650.9 million by 2030 with a CAGR of 94.06% during the forecast period 2024-2030.
The global key companies of E-Methanol include OCI, BASF, Enerkem, Methanex, Sodra, Alberta Pacific, Carbon Recycling International, and etc. In 2023, the global five largest players hold a share approximately 70% in terms of revenue.
This report aims to provide a comprehensive presentation of the global market for E-Methanol, focusing on the total sales volume, sales revenue, price, key companies market share and ranking, together with an analysis of E-Methanol by region & country, by Type, and by Application.
The E-Methanol market size, estimations, and forecasts are provided in terms of sales volume (K Tons) and sales revenue ($ millions), considering 2023 as the base year, with history and forecast data for the period from 2019 to 2030. With both quantitative and qualitative analysis, to help readers develop business/growth strategies, assess the market competitive situation, analyze their position in the current marketplace, and make informed business decisions regarding E-Methanol.
Market Segmentation
By Company
- OCI
- BASF
- Enerkem
- Methanex
- Sodra
- Alberta Pacific
Segment by Type
- Waste Sourced
- By-Product Sourced
Segment by Application
- Gasoline Blending
- Bio-diesel
- Others
By Region
- North America
- United States
- Canada
- Asia-Pacific
- China
- Japan
- South Korea
- Southeast Asia
- Australia
- Rest of Asia-Pacific
- Europe
- Germany
- France
- U.K.
- Sweden
- Netherlands
- Rest of Europe
- Latin America
- Mexico
- Brazil
- Rest of Latin America
- Middle East & Africa
Chapter Outline
Chapter 1: Introduces the report scope of the report, global total market size (valve, volume and price). This chapter also provides the market dynamics, latest developments of the market, the driving factors and restrictive factors of the market, the challenges and risks faced by manufacturers in the industry, and the analysis of relevant policies in the industry.
Chapter 2: Detailed analysis of E-Methanol manufacturers competitive landscape, price, sales and revenue market share, latest development plan, merger, and acquisition information, etc.
Chapter 3: Provides the analysis of various market segments by Type, covering the market size and development potential of each market segment, to help readers find the blue ocean market in different market segments.
Chapter 4: Provides the analysis of various market segments by Application, covering the market size and development potential of each market segment, to help readers find the blue ocean market in different downstream markets.
Chapter 5: Sales, revenue of E-Methanol in regional level. It provides a quantitative analysis of the market size and development potential of each region and introduces the market development, future development prospects, market space, and market size of each country in the world.
Chapter 6: Sales, revenue of E-Methanol in country level. It provides sigmate data by Type, and by Application for each country/region.
Chapter 7: Provides profiles of key players, introducing the basic situation of the main companies in the market in detail, including product sales, revenue, price, gross margin, product introduction, etc.
Chapter 8: Analysis of industrial chain, including the upstream and downstream of the industry.
Chapter 9: Conclusion.
Table of Contents
1 Market Overview
- 1.1 E-Methanol Product Introduction
- 1.2 Global E-Methanol Market Size Forecast
- 1.2.1 Global E-Methanol Sales Value (2019-2030)
- 1.2.2 Global E-Methanol Sales Volume (2019-2030)
- 1.2.3 Global E-Methanol Sales Price (2019-2030)
- 1.3 E-Methanol Market Trends & Drivers
- 1.3.1 E-Methanol Industry Trends
- 1.3.2 E-Methanol Market Drivers & Opportunity
- 1.3.3 E-Methanol Market Challenges
- 1.3.4 E-Methanol Market Restraints
- 1.4 Assumptions and Limitations
- 1.5 Study Objectives
- 1.6 Years Considered
2 Competitive Analysis by Company
- 2.1 Global E-Methanol Revenue by Company (2019-2024)
- 2.2 Global E-Methanol Sales Volume by Company Players (2019-2024)
- 2.3 Global E-Methanol Average Price by Company (2019-2024)
- 2.4 Key Manufacturers E-Methanol Manufacturing Base and Headquarters
- 2.5 E-Methanol Market Competitive Analysis
- 2.5.1 E-Methanol Market Concentration Rate (2019-2024)
- 2.5.2 Global 5 Largest Manufacturers by E-Methanol Revenue in 2023
- 2.5.3 Global Top Manufacturers by Company Type (Tier 1, Tier 2, and Tier 3) & (based on the Revenue in E-Methanol as of 2023)
- 2.6 Mergers & Acquisitions, Expansion
- 2.7 Potential Competitors
3 Segmentation by Type
- 3.1 Introduction by Type
- 3.1.1 Waste Sourced
- 3.1.2 By-Product Sourced
- 3.2 Global E-Methanol Sales Value by Type
- 3.2.1 Global E-Methanol Sales Value by Type (2019 VS 2023 VS 2030)
- 3.2.2 Global E-Methanol Sales Value, by Type (2019-2030)
- 3.2.3 Global E-Methanol Sales Value, by Type (%) (2019-2030)
- 3.3 Global E-Methanol Sales Volume by Type
- 3.3.1 Global E-Methanol Sales Volume by Type (2019 VS 2023 VS 2030)
- 3.3.2 Global E-Methanol Sales Volume, by Type (2019-2030)
- 3.3.3 Global E-Methanol Sales Volume, by Type (%) (2019-2030)
- 3.4 Global E-Methanol Average Price by Type (2019-2030)
4 Segmentation by Application
- 4.1 Introduction by Application
- 4.1.1 Gasoline Blending
- 4.1.2 Bio-diesel
- 4.1.3 Others
- 4.2 Global E-Methanol Sales Value by Application
- 4.2.1 Global E-Methanol Sales Value by Application (2019 VS 2023 VS 2030)
- 4.2.2 Global E-Methanol Sales Value, by Application (2019-2030)
- 4.2.3 Global E-Methanol Sales Value, by Application (%) (2019-2030)
- 4.3 Global E-Methanol Sales Volume by Application
- 4.3.1 Global E-Methanol Sales Volume by Application (2019 VS 2023 VS 2030)
- 4.3.2 Global E-Methanol Sales Volume, by Application (2019-2030)
- 4.3.3 Global E-Methanol Sales Volume, by Application (%) (2019-2030)
- 4.4 Global E-Methanol Average Price by Application (2019-2030)
5 Segmentation by Region
- 5.1 Global E-Methanol Sales Value by Region
- 5.1.1 Global E-Methanol Sales Value by Region: 2019 VS 2023 VS 2030
- 5.1.2 Global E-Methanol Sales Value by Region (2019-2024)
- 5.1.3 Global E-Methanol Sales Value by Region (2025-2030)
- 5.1.4 Global E-Methanol Sales Value by Region (%), (2019-2030)
- 5.2 Global E-Methanol Sales Volume by Region
- 5.2.1 Global E-Methanol Sales Volume by Region: 2019 VS 2023 VS 2030
- 5.2.2 Global E-Methanol Sales Volume by Region (2019-2024)
- 5.2.3 Global E-Methanol Sales Volume by Region (2025-2030)
- 5.2.4 Global E-Methanol Sales Volume by Region (%), (2019-2030)
- 5.3 Global E-Methanol Average Price by Region (2019-2030)
- 5.4 North America
- 5.4.1 North America E-Methanol Sales Value, 2019-2030
- 5.4.2 North America E-Methanol Sales Value by Country (%), 2023 VS 2030
- 5.5 Europe
- 5.5.1 Europe E-Methanol Sales Value, 2019-2030
- 5.5.2 Europe E-Methanol Sales Value by Country (%), 2023 VS 2030
- 5.6 Asia Pacific
- 5.6.1 Asia Pacific E-Methanol Sales Value, 2019-2030
- 5.6.2 Asia Pacific E-Methanol Sales Value by Region (%), 2023 VS 2030
- 5.7 Latin America
- 5.7.1 Latin America E-Methanol Sales Value, 2019-2030
- 5.7.2 Latin America E-Methanol Sales Value by Country (%), 2023 VS 2030
- 5.8 Middle East & Africa
- 5.8.1 Middle East & Africa E-Methanol Sales Value, 2019-2030
- 5.8.2 Middle East & Africa E-Methanol Sales Value by Country (%), 2023 VS 2030
6 Segmentation by Key Countries/Regions
- 6.1 Key Countries/Regions E-Methanol Sales Value Growth Trends, 2019 VS 2023 VS 2030
- 6.2 Key Countries/Regions E-Methanol Sales Value
- 6.2.1 Key Countries/Regions E-Methanol Sales Value, 2019-2030
- 6.2.2 Key Countries/Regions E-Methanol Sales Volume, 2019-2030
- 6.3 United States
- 6.3.1 United States E-Methanol Sales Value, 2019-2030
- 6.3.2 United States E-Methanol Sales Value by Type (%), 2023
- 6.3.3 United States E-Methanol Sales Value by Application, 2023
- 6.4 Europe
- 6.4.1 Europe E-Methanol Sales Value, 2019-2030
- 6.4.2 Europe E-Methanol Sales Value by Type (%), 2023
- 6.4.3 Europe E-Methanol Sales Value by Application, 2023
- 6.5 China
- 6.5.1 China E-Methanol Sales Value, 2019-2030
- 6.5.2 China E-Methanol Sales Value by Type (%), 2023
- 6.5.3 China E-Methanol Sales Value by Application, 2023
7 Company Profiles
- 7.1 OCI
- 7.1.1 OCI Company Information
- 7.1.2 OCI Introduction and Business Overview
- 7.1.3 CI N.V. E-Methanol Sales, Revenue, Price and Gross Margin (2019-2024)
- 7.1.4 OCI E-Methanol Product Offerings
- 7.2 BASF
- 7.2.1 BASF Company Information
- 7.2.2 BASF Introduction and Business Overview
- 7.2.3 BASF E-Methanol Sales, Revenue, Price and Gross Margin (2019-2024)
- 7.2.4 BASF E-Methanol Product Offerings
- 7.3 Enerkem
- 7.3.1 Enerkem Company Information
- 7.3.2 Enerkem Introduction and Business Overview
- 7.3.3 Enerkem E-Methanol Sales, Revenue, Price and Gross Margin (2019-2024)
- 7.3.4 Enerkem E-Methanol Product Offerings
- 7.4 Methanex
- 7.4.1 Methanex Company Information
- 7.4.2 Methanex Introduction and Business Overview
- 7.4.3 Methanex E-Methanol Sales, Revenue, Price and Gross Margin (2019-2024)
- 7.4.4 Methanex E-Methanol Product Offerings
- 7.5 Sodra
- 7.5.1 Sodra Company Information
- 7.5.2 Sodra Introduction and Business Overview
- 7.5.3 Sodra E-Methanol Sales, Revenue, Price and Gross Margin (2019-2024)
- 7.5.4 Sodra E-Methanol Product Offerings
- 7.6 Alberta Pacific
- 7.6.1 Alberta Pacific Company Information
- 7.6.2 Alberta Pacific Introduction and Business Overview
- 7.6.3 Alberta Pacific E-Methanol Sales, Revenue, Price and Gross Margin (2019-2024)
- 7.6.4 Alberta Pacific E-Methanol Product Offerings
8 Industry Chain Analysis
- 8.1 E-Methanol Industrial Chain
- 8.2 E-Methanol Upstream Analysis
- 8.2.1 Key Raw Materials
- 8.2.2 Raw Materials Key Suppliers
- 8.2.3 Manufacturing Cost Structure
- 8.3 Downstream Analysis (Customers Analysis)
- 8.4 Production Mode
- 8.5 Sales Model and Sales Channels
- 8.6 E-Methanol Distributors
9 Research Findings and Conclusion
10 Appendix
- 10.1 Research Methodology
- 10.1.1 Methodology/Research Approach
- 10.1.2 Data Source
- 10.2 Author Details
- 10.3 Disclaimer

