|
|
市場調査レポート
商品コード
1398363
タイヤの世界市場:2023年Global Tires Market Research Report 2023 |
||||||
|
|
|||||||
|
● お客様のご希望に応じて、既存データの加工や未掲載情報(例:国別セグメント)の追加などの対応が可能です。 詳細はお問い合わせください。 |
|||||||


| タイヤの世界市場:2023年 |
|
出版日: 2023年12月22日
発行: QYResearch
ページ情報: 英文 146 Pages
納期: 2~3営業日
|
- 全表示
- 概要
- 図表
- 目次
世界のタイヤの市場規模は2022年に1,674億460万米ドルとなり、2023年から2029年にかけて4.51%のCAGRで拡大し、2029年末には2,252億5,770万米ドルに達すると予測されています。
中国のタイヤ生産額は2022年に389億4,580万米ドルで、2029年には602億4,620万米ドルになり、2023年から2029年までの成長率は5.92%になると見込まれています。
北米のタイヤ生産額は2022年に297億2,830万米ドルで、2029年には377億5,430万米ドルになり、2023年から2029年までの成長率はになると見込まれています。
世界の主要タイヤメーカーには、Bridgestone、Michelin、GoodYear、Continental、Sumitomo、Pirelli、Hankook、Yokohama、Zhongce Rubber Groupなどがあります。2022年には、世界の上位3ベンダーが売上高の約47.31%を占めています。
当レポートでは、世界のタイヤ市場について調査し、市場の概要とともに、タイプ別、用途別、地域別の動向、および市場に参入する企業のプロファイルなどを提供しています。
目次
第1章 タイヤ市場概要
- 製品の定義
- タイヤ、タイプ別
- タイヤ、用途別
- 世界市場の成長見通し
- 前提と制限
第2章 メーカーによる市場競争
第3章 タイヤ生産、地域別
- 世界のタイヤ生産額の推定と予測:2018年 VS 2022年 VS 2029年、地域別
- 世界のタイヤ生産額(2018年~2029年)、地域別
- 世界のタイヤ生産予測:2018年 VS 2022年 VS 2029年、地域別
- 世界のタイヤ生産(2018年~2029年)、地域別
- 世界のタイヤ市場価格分析(2018年~2023年)、地域別
- 世界のタイヤ生産量と価値、前年比成長率
第4章 タイヤ消費量、地域別
- 世界のタイヤ消費量の推定と予測:2018年 VS 2022年 VS 2029年、地域別
- 世界のタイヤ消費量(2018年~2029年)、地域別
- 北米
- 欧州
- アジア太平洋
- ラテンアメリカ
第5章 タイプ別セグメント
- 世界のタイヤ生産(2018年~2029年)、タイプ別
- 世界のタイヤ生産額(2018年~2029年)、タイプ別
- 世界のタイヤ価格(2018年~2029年)、タイプ別
第6章 用途別セグメント
- 世界のタイヤ生産(2018年~2029年)、用途別
- 世界のタイヤ生産額(2018~2029年)、用途別
- 世界のタイヤ価格(2018年~2029年)、用途別
第7章 主要企業の概要
- Bridgestone
- Michelin
- GoodYear
- Continental
- Sumitomo
- Pirelli
- Hankook
- Yokohama
- Zhongce Rubber Group
- Apollo Tyres
- Toyo Tire Corporation
- Nexen Tire
- Cheng Shin Rubber
- Sailun Group
- Kumho Tire
- Giti Tire Corporation
- MRF
- Shandong Linglong Tire
- Nokian Tyres
- Double Coin Group
- Triangle Tire Group
- Guizhou Tyre
- Kenda Tires
- Qingdao Double Star Tire
第8章 産業チェーンと販売チャネルの分析
- タイヤ産業チェーン分析
- タイヤの主な原材料
- タイヤの販売およびマーケティング
- タイヤの顧客
第9章 タイヤ市場力学
第10章 調査結果と結論
第11章 調査手法とデータソース
List of Tables
- Table 1. Global Tires Market Value by Type, (US$ Million) & (2022 VS 2029)
- Table 2. Global Tires Market Value by Application, (US$ Million) & (2022 VS 2029)
- Table 3. Global Tires Production by Manufacturers (2019-2023) & (M Units)
- Table 4. Global Tires Production Market Share by Manufacturers (2019-2023)
- Table 5. Global Tires Production Value by Manufacturers (2019-2023) & (US$ Million)
- Table 6. Global Tires Production Value Share by Manufacturers (2019-2023)
- Table 7. Global Key Players of Tires, Industry Ranking, 2021 VS 2022
- Table 8. Global Company Type (Tier 1, Tier 2, and Tier 3) & (based on the Production Value in Tires as of 2022)
- Table 9. Global Market Tires Average Price by Manufacturers (US$/Unit) & (2019-2023)
- Table 10. Global Key Manufacturers of Tires, Manufacturing Sites & Headquarters
- Table 11. Global Key Manufacturers of Establish Date
- Table 12. Global Tires Manufacturers Market Concentration Ratio (CR5 and HHI)
- Table 13. Mergers & Acquisitions, Expansion Plans
- Table 14. Global Tires Production Value Growth Rate by Region: 2018 VS 2022 VS 2029 (US$ Million)
- Table 15. Global Tires Production Value (US$ Million) by Region (2018-2023)
- Table 16. Global Tires Production Value Market Share by Region (2018-2023)
- Table 17. Global Tires Production Value (US$ Million) Forecast by Region (2024-2029)
- Table 18. Global Tires Production Value Market Share Forecast by Region (2024-2029)
- Table 19. Global Tires Production Comparison by Region: 2018 VS 2022 VS 2029 (M Units)
- Table 20. Global Tires Production (M Units) by Region (2018-2023)
- Table 21. Global Tires Production Market Share by Region (2018-2023)
- Table 22. Global Tires Production (M Units) Forecast by Region (2024-2029)
- Table 23. Global Tires Production Market Share Forecast by Region (2024-2029)
- Table 24. Global Tires Market Average Price (US$/Unit) by Region (2018-2023)
- Table 25. Global Tires Market Average Price (US$/Unit) by Region (2024-2029)
- Table 26. Global Tires Consumption Growth Rate by Region: 2018 VS 2022 VS 2029 (M Units)
- Table 27. Global Tires Consumption by Region (2018-2023) & (M Units)
- Table 28. Global Tires Consumption Market Share by Region (2018-2023)
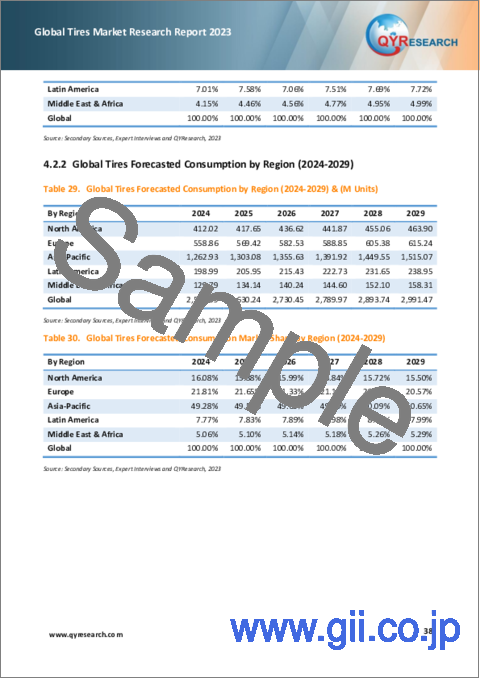
- Table 29. Global Tires Forecasted Consumption by Region (2024-2029) & (M Units)
- Table 30. Global Tires Forecasted Consumption Market Share by Region (2024-2029)
- Table 31. North America Tires Consumption Growth Rate by Country: 2018 VS 2022 VS 2029 (M Units)
- Table 32. North America Tires Consumption by Country (2018-2023) & (M Units)
- Table 33. North America Tires Consumption by Country (2024-2029) & (M Units)
- Table 34. Europe Tires Consumption Growth Rate by Country: 2018 VS 2022 VS 2029 (M Units)
- Table 35. Europe Tires Consumption by Country (2018-2023) & (M Units)
- Table 36. Europe Tires Consumption by Country (2024-2029) & (M Units)
- Table 37. Asia Pacific Tires Consumption Growth Rate by Country: 2018 VS 2022 VS 2029 (M Units)
- Table 38. Asia Pacific Tires Consumption by Region (2018-2023) & (M Units)
- Table 39. Asia Pacific Tires Consumption by Region (2024-2029) & (M Units)
- Table 40. Latin America Tires Consumption Growth Rate by Country: 2018 VS 2022 VS 2029 (M Units)
- Table 41. Latin America Tires Consumption by Country (2018-2023) & (M Units)
- Table 42. Latin America Tires Consumption by Country (2024-2029) & (M Units)
- Table 43. Global Tires Production (M Units) by Type (2018-2023)
- Table 44. Global Tires Production (M Units) by Type (2024-2029)
- Table 45. Global Tires Production Market Share by Type (2018-2023)
- Table 46. Global Tires Production Market Share by Type (2024-2029)
- Table 47. Global Tires Production Value (US$ Million) by Type (2018-2023)
- Table 48. Global Tires Production Value (US$ Million) by Type (2024-2029)
- Table 49. Global Tires Production Value Market Share by Type (2018-2023)
- Table 50. Global Tires Production Value Market Share by Type (2024-2029)
- Table 51. Global Tires Price (US$/Unit) by Type (2018-2023)
- Table 52. Global Tires Price (US$/Unit) by Type (2024-2029)
- Table 53. Global Tires Production (M Units) by Application (2018-2023)
- Table 54. Global Tires Production (M Units) by Application (2024-2029)
- Table 55. Global Tires Production Market Share by Application (2018-2023)
- Table 56. Global Tires Production Market Share by Application (2024-2029)
- Table 57. Global Tires Production Value (US$ Million) by Application (2018-2023)
- Table 58. Global Tires Production Value (US$ Million) by Application (2024-2029)
- Table 59. Global Tires Production Value Market Share by Application (2018-2023)
- Table 60. Global Tires Production Value Market Share by Application (2024-2029)
- Table 61. Global Tires Price (US$/Unit) by Application (2018-2023)
- Table 62. Global Tires Price (US$/Unit) by Application (2024-2029)
- Table 63. Bridgestone Company Information
- Table 64. Bridgestone Tires Type
- Table 65. Bridgestone Tires Production (M Units), Value (US$ Million), Price (US$/Unit) and Gross Margin (2019-2023)
- Table 66. Bridgestone Description and Business Overview
- Table 67. Michelin Company Information
- Table 68. Michelin Tires Type
- Table 69. Michelin Tires Production (M Units), Value (US$ Million), Price (US$/Unit) and Gross Margin (2019-2023)
- Table 70. Michelin Description and Business Overview
- Table 71. GoodYear Company Information
- Table 72. GoodYear Tires Type
- Table 73. GoodYear Tires Production (M Units), Value (US$ Million), Price (US$/Unit) and Gross Margin (2019-2023)
- Table 74. GoodYear Description and Business Overview
- Table 75. Continental Company Information
- Table 76. Continental Tires Type
- Table 77. Continental Tires Production (M Units), Value (US$ Million), Price (US$/Unit) and Gross Margin (2019-2023)
- Table 78. Continental Description and Business Overview
- Table 79. Sumitomo Company Information
- Table 80. Sumitomo Tires Type
- Table 81. Sumitomo Tires Production (M Units), Value (US$ Million), Price (US$/Unit) and Gross Margin (2019-2023)
- Table 82. Sumitomo Description and Business Overview
- Table 83. Pirelli Company Information
- Table 84. Pirelli Tires Type
- Table 85. Pirelli Tires Production (M Units), Value (US$ Million), Price (US$/Unit) and Gross Margin (2019-2023)
- Table 86. Pirelli Description and Business Overview
- Table 87. Hankook Company Information
- Table 88. Hankook Tires Type
- Table 89. Hankook Tires Production (M Units), Value (US$ Million), Price (US$/Unit) and Gross Margin (2019-2023)
- Table 90. Hankook Description and Business Overview
- Table 91. Yokohama Company Information
- Table 92. Yokohama Tires Type
- Table 93. Yokohama Tires Production (M Units), Value (US$ Million), Price (US$/Unit) and Gross Margin (2019-2023)
- Table 94. Yokohama Description and Business Overview
- Table 95. Zhongce Rubber Group Company Information
- Table 96. Zhongce Rubber Group Tires Type
- Table 97. Zhongce Rubber Group Tires Production (M Units), Value (US$ Million), Price (US$/Unit) and Gross Margin (2019-2023)
- Table 98. Zhongce Rubber Group Description and Business Overview
- Table 99. Apollo Tyres Company Information
- Table 100. Apollo Tyres Tires Type
- Table 101. Apollo Tyres Tires Production (M Units), Value (US$ Million), Price (US$/Unit) and Gross Margin (2019-2023)
- Table 102. Apollo Tyres Description and Business Overview
- Table 103. Toyo Tire Corporation Company Information
- Table 104. Toyo Tire Corporation Tires Type
- Table 105. Toyo Tire Corporation Tires Production (M Units), Value (US$ Million), Price (US$/Unit) and Gross Margin (2019-2023)
- Table 106. Toyo Tire Corporation Description and Business Overview
- Table 107. Nexen Tire Company Information
- Table 108. Nexen Tire Tires Type
- Table 109. Nexen Tire Tires Production (M Units), Value (US$ Million), Price (US$/Unit) and Gross Margin (2019-2023)
- Table 110. Nexen Tire Description and Business Overview
- Table 111. Cheng Shin Rubber Company Information
- Table 112. Cheng Shin Rubber Tires Type
- Table 113. Cheng Shin Rubber Tires Production (M Units), Value (US$ Million), Price (US$/Unit) and Gross Margin (2019-2023)
- Table 114. Cheng Shin Rubber Description and Business Overview
- Table 115. Sailun Group Company Information
- Table 116. Sailun Group Tires Type
- Table 117. Sailun Group Tires Production (M Units), Value (US$ Million), Price (US$/Unit) and Gross Margin (2019-2023)
- Table 118. Sailun Group Description and Business Overview
- Table 119. Kumho Tire Company Information
- Table 120. Kumho Tire Tires Type
- Table 121. Kumho Tire Tires Production (M Units), Value (US$ Million), Price (US$/Unit) and Gross Margin (2019-2023)
- Table 122. Kumho Tire Description and Business Overview
- Table 123. Giti Tire Corporation Company Information
- Table 124. Giti Tire Corporation Tires Type
- Table 125. Giti Tire Corporation Tires Production (M Units), Value (US$ Million), Price (US$/Unit) and Gross Margin (2019-2023)
- Table 126. Giti Tire Corporation Description and Business Overview
- Table 127. MRF Company Information
- Table 128. MRF Tires Type
- Table 129. MRF Tires Production (M Units), Value (US$ Million), Price (US$/Unit) and Gross Margin (2019-2023)
- Table 130. MRF Description and Business Overview
- Table 131. Shandong Linglong Tire Company Information
- Table 132. Shandong Linglong Tire Tires Type
- Table 133. Shandong Linglong Tire Tires Production (M Units), Value (US$ Million), Price (US$/Unit) and Gross Margin (2019-2023)
- Table 134. Shandong Linglong Tire Description and Business Overview
- Table 135. Nokian Tyres Company Information
- Table 136. Nokian Tyres Tires Type
- Table 137. Nokian Tyres Tires Production (M Units), Value (US$ Million), Price (US$/Unit) and Gross Margin (2019-2023)
- Table 138. Nokian Tyres Description and Business Overview
- Table 139. Double Coin Group Company Information
- Table 140. Double Coin Group Tires Type
- Table 141. Double Coin Group Tires Production (M Units), Value (US$ Million), Price (US$/Unit) and Gross Margin (2019-2023)
- Table 142. Double Coin Group Description and Business Overview
- Table 143. Triangle Tire Group Company Information
- Table 144. Triangle Tire Group Tires Type
- Table 145. Triangle Tire Group Tires Production (M Units), Value (US$ Million), Price (US$/Unit) and Gross Margin (2019-2023)
- Table 146. Triangle Tire Group Description and Business Overview
- Table 147. Guizhou Tyre Company Information
- Table 148. Guizhou Tyre Tires Type
- Table 149. Guizhou Tyre Tires Production (M Units), Value (US$ Million), Price (US$/Unit) and Gross Margin (2019-2023)
- Table 150. Guizhou Tyre Description and Business Overview
- Table 151. Kenda Tires Company Information
- Table 152. Kenda Tires Tires Type
- Table 153. Kenda Tires Tires Production (M Units), Value (US$ Million), Price (US$/Unit) and Gross Margin (2019-2023)
- Table 154. Kenda Tires Description and Business Overview
- Table 155. Qingdao Double Star Tire Company Information
- Table 156. Qingdao Double Star Tire Tires Type
- Table 157. Qingdao Double Star Tire Tires Production (M Units), Value (US$ Million), Price (US$/Unit) and Gross Margin (2019-2023)
- Table 158. Qingdao Double Star Tire Description and Business Overview
- Table 159. Key Raw Materials Lists
- Table 160. Raw Materials Key Suppliers Lists
- Table 161. Tires Distributors List
- Table 162. Tires Customers List
- Table 163. Tires Market Trends
- Table 164. Tires Market Drivers
- Table 165. Tires Market Challenges
- Table 166. Research Programs/Design for This Report
- Table 167. Key Data Information from Secondary Sources
- Table 168. Key Data Information from Primary Sources
- Table 169. Authors List of This Report
- Table 170. QYR Business Unit and Senior & Team Lead Analysts
List of Figures
- Figure 1. Product Picture of Tires
- Figure 2. Global Tires Market Value by Type, (US$ Million) & (2022 VS 2029)
- Figure 3. Global Tires Market Share by Type: 2022 VS 2029
- Figure 4. OE Tire Product Picture
- Figure 5. Replacement Tire Product Picture
- Figure 6. Global Tires Market Share by Application: 2022 VS 2029
- Figure 7. Automotive Tire
- Figure 8. Bicycle Tire
- Figure 9. Motorcycle/ATV Tire
- Figure 10. Engineering Tire
- Figure 11. Agricultural Tire
- Figure 12. Aero Tire
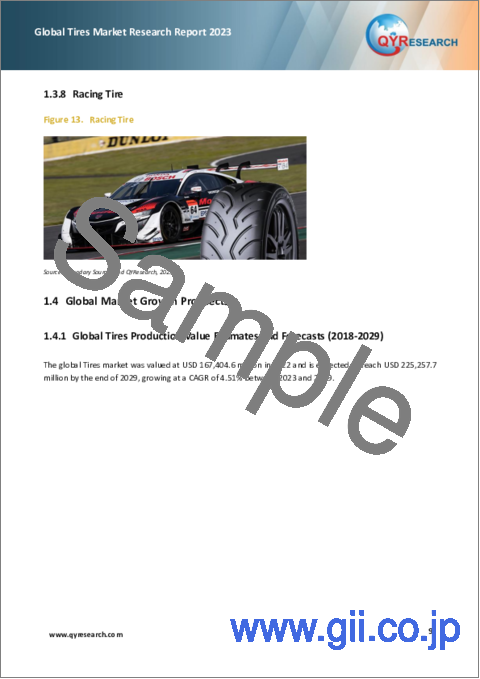
- Figure 13. Racing Tire
- Figure 14. Global Tires Production Value (US$ Million), 2018 VS 2023 VS 2029
- Figure 15. Global Tires Production Value (US$ Million) & (2018-2029)
- Figure 16. Global Tires Production (M Units) & (2018-2029)
- Figure 17. Global Tires Average Price (US$/Unit) & (2018-2029)
- Figure 18. Tires Report Years Considered
- Figure 19. The Global 3 Largest Players: Market Share by Tires Revenue in 2022
- Figure 20. The Global 5 Largest Players: Market Share by Tires Revenue in 2022
- Figure 21. Global Tires Production Value Market Share by Region: 2018-2029
- Figure 22. Global Tires Production Market Share by Region: 2018-2029
- Figure 23. North America Tires Production Value (US$ Million) Growth Rate (2018-2029)
- Figure 24. Europe Tires Production Value (US$ Million) Growth Rate (2018-2029)
- Figure 25. China Tires Production Value (US$ Million) Growth Rate (2018-2029)
- Figure 26. Japan Tires Production Value (US$ Million) Growth Rate (2018-2029)
- Figure 27. South Korea Tires Production Value (US$ Million) Growth Rate (2018-2029)
- Figure 28. Global Tires Consumption Market Share by Region: 2018-2029
- Figure 29. North America Tires Consumption and Growth Rate (2018-2029) & (M Units)
- Figure 30. North America Tires Consumption Market Share by Country (2018-2029)
- Figure 31. U.S. Tires Consumption and Growth Rate (2018-2029) & (M Units)
- Figure 32. Canada Tires Consumption and Growth Rate (2018-2029) & (M Units)
- Figure 33. Europe Tires Consumption and Growth Rate (2018-2029) & (M Units)
- Figure 34. Europe Tires Consumption Market Share by Country (2018-2029)
- Figure 35. Germany Tires Consumption and Growth Rate (2018-2029) & (M Units)
- Figure 36. France Tires Consumption and Growth Rate (2018-2029) & (M Units)
- Figure 37. U.K. Tires Consumption and Growth Rate (2018-2029) & (M Units)
- Figure 38. Italy Tires Consumption and Growth Rate (2018-2029) & (M Units)
- Figure 39. Russia Tires Consumption and Growth Rate (2018-2029) & (M Units)
- Figure 40. Asia Pacific Tires Consumption and Growth Rate (2018-2029) & (M Units)
- Figure 41. Asia Pacific Tires Consumption Market Share by Region (2024-2029)
- Figure 42. China Tires Consumption and Growth Rate (2018-2029) & (M Units)
- Figure 43. Japan Tires Consumption and Growth Rate (2018-2029) & (M Units)
- Figure 44. South Korea Tires Consumption and Growth Rate (2018-2029) & (M Units)
- Figure 45. Southeast Asia Tires Consumption and Growth Rate (2018-2029) & (M Units)
- Figure 46. India Tires Consumption and Growth Rate (2018-2029) & (M Units)
- Figure 47. Latin America Tires Consumption and Growth Rate (2018-2029) & (M Units)
- Figure 48. Latin America Tires Consumption Market Share by Country (2018-2029)
- Figure 49. Mexico Tires Consumption and Growth Rate (2018-2029) & (M Units)
- Figure 50. Brazil Tires Consumption and Growth Rate (2018-2029) & (M Units)
- Figure 51. Global Production Market Share of Tires by Type (2018-2029)
- Figure 52. Global Production Value Market Share of Tires by Type (2018-2029)
- Figure 53. Tires Value Chain
- Figure 54. Distributors Profiles
- Figure 55. Bottom-up and Top-down Approaches for This Report
- Figure 56. Data Triangulation
The global Tires market was valued at USD 167,404.6 million in 2022 and is expected to reach USD 225,257.7 million by the end of 2029, growing at a CAGR of 4.51% between 2023 and 2029.
The China Tires production value was US$ 38,945.8 million in 2022 and it will be US$ 60,246.2 million in 2029, with a growth rate 5.92% from 2023 to 2029.
The North America Tires production value was US$29,728.3 million in 2022 and it will be US$ 37,754.3 Million in 2029, with a growth rate 4.28% from 2023 to 2029.
The major global manufacturers of Tires include: Bridgestone, Michelin, GoodYear, Continental, Sumitomo, Pirelli, Hankook, Yokohama, and Zhongce Rubber Group, etc. In 2022, the world's top three vendors accounted for approximately 47.31% of the revenue.
Report Scope
This report aims to provide a comprehensive presentation of the global market for Tires, with both quantitative and qualitative analysis, to help readers develop business/growth strategies, assess the market competitive situation, analyze their position in the current marketplace, and make informed business decisions regarding Tires.
The Tires market size, estimations, and forecasts are provided in terms of output/shipments (M Units) and revenue ($ millions), considering 2022 as the base year, with history and forecast data for the period from 2018 to 2029. This report segments the global Tires market comprehensively. Regional market sizes, concerning products by Type, by Application, and by players, are also provided.
For a more in-depth understanding of the market, the report provides profiles of the competitive landscape, key competitors, and their respective market ranks. The report also discusses technological trends and new product developments.
The report will help the Tires manufacturers, new entrants, and industry chain related companies in this market with information on the revenues, production, and average price for the overall market and the sub-segments across the different segments, by company, by Type, by Application, and by regions.
By Company
- Bridgestone
- Michelin
- GoodYear
- Continental
- Sumitomo
- Pirelli
- Hankook
- Yokohama
- Zhongce Rubber
- Apollo Tyres
- Toyo Tire Corporation
- Nexen Tire
- Cheng Shin Rubber
- Sailun Tire
- Kumho Tire
- Giti
- MRF
- Shandong Linglong Tire
- Nokian Tyres
- Double Coin Group
- Triangle Tire Group
- Guizhou Tyre
- Kenda Tires
- Qingdao Double Star Tire
by Type
- OE Tire
- Replacement Tire
by Application
- Automotive Tire
- Bicycle Tire
- Motorcycle/ATV Tire
- Engineering Tire
- Agricultural Tire
- Aero Tire
- Racing Tire
Production by Region
- North America
- Europe
- China
- Japan
- South Korea
Consumption by Region
- North America
- U.S.
- Canada
- Asia-Pacific
- China
- Japan
- South Korea
- Southeast Asia
- India
- Europe
- Germany
- France
- U.K.
- Italy
- Russia
- Rest of Europe
- Latin America
- Mexico
- Brazil
Core Chapters
Chapter 1: Introduces the report scope of the report, executive summary of different market segments (by region, by Type, by Application, etc), including the market size of each market segment, future development potential, and so on. It offers a high-level view of the current state of the market and its likely evolution in the short to mid-term, and long term.
Chapter 2: Detailed analysis of Tires manufacturers competitive landscape, price, production and value market share, latest development plan, merger, and acquisition information, etc.
Chapter 3: Production/output, value of Tires by region/country. It provides a quantitative analysis of the market size and development potential of each region in the next six years.
Chapter 4: Consumption of Tires in regional level and country level. It provides a quantitative analysis of the market size and development potential of each region and its main countries and introduces the market development, future development prospects, market space, and production of each country in the world.
Chapter 5: Provides the analysis of various market segments by Type, covering the market size and development potential of each market segment, to help readers find the blue ocean market in different market segments.
Chapter 6: Provides the analysis of various market segments by Application, covering the market size and development potential of each market segment, to help readers find the blue ocean market in different downstream markets.
Chapter 7: Provides profiles of key players, introducing the basic situation of the main companies in the market in detail, including product production/output, value, price, gross margin, product introduction, recent development, etc.
Chapter 8: Analysis of industrial chain, including the upstream and downstream of the industry.
Chapter 9: Introduces the market dynamics, latest developments of the market, the driving factors and restrictive factors of the market, the challenges and risks faced by manufacturers in the industry, and the analysis of relevant policies in the industry.
Chapter 10: The main points and conclusions of the report.
Table of Contents
1 Tires Market Overview
- 1.1 Product Definition
- 1.2 Tires by Type
- 1.2.1 Global Tires Market Value Growth Rate Analysis by Type: 2022 VS 2029
- 1.2.2 OE Tire
- 1.2.3 Replacement Tire
- 1.3 Tires by Application
- 1.3.1 Global Tires Market Value Growth Rate Analysis by Application: 2022 VS 2029
- 1.3.2 Automotive Tire
- 1.3.3 Bicycle Tire
- 1.3.4 Motorcycle/ATV Tire
- 1.3.5 Engineering Tire
- 1.3.6 Agricultural Tire
- 1.3.7 Aero Tire
- 1.3.8 Racing Tire
- 1.4 Global Market Growth Prospects
- 1.4.1 Global Tires Production Value Estimates and Forecasts (2018-2029)
- 1.4.2 Global Tires Production Estimates and Forecasts (2018-2029)
- 1.4.3 Global Tires Market Average Price Estimates and Forecasts (2018-2029)
- 1.5 Assumptions and Limitations
2 Market Competition by Manufacturers
- 2.1 Global Tires Production Market Share by Manufacturers (2019-2023)
- 2.2 Global Tires Production Value Market Share by Manufacturers (2019-2023)
- 2.3 Global Key Players of Tires, Industry Ranking, 2021 VS 2022
- 2.4 Global Tires Market Share by Company Type (Tier 1, Tier 2, and Tier 3)
- 2.5 Global Tires Average Price by Manufacturers (2019-2023)
- 2.6 Global Key Manufacturers of Tires, Manufacturing Sites & Headquarters
- 2.7 Global Key Manufacturers of Establish Date
- 2.8 Global Tires Market Competitive Situation and Trends
- 2.8.1 Global Tires Market Concentration Rate
- 2.8.2 Global 3 and 5 Largest Tires Players Market Share by Revenue
- 2.9 Mergers & Acquisitions, Expansion
3 Tires Production by Region
- 3.1 Global Tires Production Value Estimates and Forecasts by Region: 2018 VS 2022 VS 2029
- 3.2 Global Tires Production Value by Region (2018-2029)
- 3.2.1 Global Tires Production Value Market Share by Region (2018-2023)
- 3.2.2 Global Forecasted Production Value of Tires by Region (2024-2029)
- 3.3 Global Tires Production Estimates and Forecasts by Region: 2018 VS 2022 VS 2029
- 3.4 Global Tires Production by Region (2018-2029)
- 3.4.1 Global Tires Production Market Share by Region (2018-2023)
- 3.4.2 Global Forecasted Production of Tires by Region (2024-2029)
- 3.5 Global Tires Market Price Analysis by Region (2018-2023)
- 3.6 Global Tires Production and Value, Year-over-Year Growth
- 3.6.1 North America Tires Production Value Estimates and Forecasts (2018-2029)
- 3.6.2 Europe Tires Production Value Estimates and Forecasts (2018-2029)
- 3.6.3 China Tires Production Value Estimates and Forecasts (2018-2029)
- 3.6.4 Japan Tires Production Value Estimates and Forecasts (2018-2029)
- 3.6.5 South Korea Tires Production Value Estimates and Forecasts (2018-2029)
4 Tires Consumption by Region
- 4.1 Global Tires Consumption Estimates and Forecasts by Region: 2018 VS 2022 VS 2029
- 4.2 Global Tires Consumption by Region (2018-2029)
- 4.2.1 Global Tires Consumption by Region (2018-2029)
- 4.2.2 Global Tires Forecasted Consumption by Region (2024-2029)
- 4.3 North America
- 4.3.1 North America Tires Consumption Growth Rate by Country: 2018 VS 2022 VS 2029
- 4.3.2 North America Tires Consumption by Country (2018-2029)
- 4.3.3 U.S.
- 4.3.4 Canada
- 4.4 Europe
- 4.4.1 Europe Tires Consumption Growth Rate by Country: 2018 VS 2022 VS 2029
- 4.4.2 Europe Tires Consumption by Country (2018-2029)
- 4.4.3 Germany
- 4.4.4 France
- 4.4.5 U.K.
- 4.4.6 Italy
- 4.4.7 Russia
- 4.5 Asia Pacific
- 4.5.1 Asia Pacific Tires Consumption Growth Rate by Country: 2018 VS 2022 VS 2029
- 4.5.2 Asia Pacific Tires Consumption by Region (2018-2029)
- 4.5.3 China
- 4.5.4 Japan
- 4.5.5 South Korea
- 4.5.6 Southeast Asia
- 4.5.7 India
- 4.6 Latin America
- 4.6.1 Latin America Tires Consumption Growth Rate by Country: 2018 VS 2022 VS 2029
- 4.6.2 Latin America Tires Consumption by Country (2018-2029)
- 4.6.3 Mexico
- 4.6.4 Brazil
5 Segment by Type
- 5.1 Global Tires Production by Type (2018-2029)
- 5.1.1 Global Tires Production by Type (2018-2023)
- 5.1.2 Global Tires Production by Type (2024-2029)
- 5.1.3 Global Tires Production Market Share by Type (2018-2029)
- 5.2 Global Tires Production Value by Type (2018-2029)
- 5.2.1 Global Tires Production Value by Type (2018-2023)
- 5.2.2 Global Tires Production Value by Type (2024-2029)
- 5.2.3 Global Tires Production Value Market Share by Type (2018-2029)
- 5.3 Global Tires Price by Type (2018-2029)
6 Segment by Application
- 6.1 Global Tires Production by Application (2018-2029)
- 6.1.1 Global Tires Production by Application (2018-2023)
- 6.1.2 Global Tires Production by Application (2024-2029)
- 6.1.3 Global Tires Production Market Share by Application (2018-2029)
- 6.2 Global Tires Production Value by Application (2018-2029)
- 6.2.1 Global Tires Production Value by Application (2018-2023)
- 6.2.2 Global Tires Production Value by Application (2024-2029)
- 6.2.3 Global Tires Production Value Market Share by Application (2018-2029)
- 6.3 Global Tires Price by Application (2018-2029)
7 Key Companies Profiled
- 7.1 Bridgestone
- 7.1.1 Bridgestone Company Information
- 7.1.2 Bridgestone Tires Product Portfolio
- 7.1.3 Bridgestone Tires Production, Value, Price and Gross Margin (2019-2023)
- 7.1.4 Bridgestone Description and Business Overview
- 7.2 Michelin
- 7.2.1 Michelin Company Information
- 7.2.2 Michelin Tires Product Portfolio
- 7.2.3 Michelin Tires Production, Value, Price and Gross Margin (2019-2023)
- 7.2.4 Michelin Description and Business Overview
- 7.3 GoodYear
- 7.3.1 GoodYear Company Information
- 7.3.2 GoodYear Tires Product Portfolio
- 7.3.3 GoodYear Tires Production, Value, Price and Gross Margin (2019-2023)
- 7.3.4 GoodYear Description and Business Overview
- 7.4 Continental
- 7.4.1 Continental Company Information
- 7.4.2 Continental Tires Product Portfolio
- 7.4.3 Continental Tires Production, Value, Price and Gross Margin (2019-2023)
- 7.4.4 Continental Description and Business Overview
- 7.5 Sumitomo
- 7.5.1 Sumitomo Company Information
- 7.5.2 Sumitomo Tires Product Portfolio
- 7.5.3 Sumitomo Tires Production, Value, Price and Gross Margin (2019-2023)
- 7.5.4 Sumitomo Description and Business Overview
- 7.6 Pirelli
- 7.6.1 Pirelli Company Information
- 7.6.2 Pirelli Tires Product Portfolio
- 7.6.3 Pirelli Tires Production, Value, Price and Gross Margin (2019-2023)
- 7.6.4 Pirelli Description and Business Overview
- 7.7 Hankook
- 7.7.1 Hankook Company Information
- 7.7.2 Hankook Tires Product Portfolio
- 7.7.3 Hankook Tires Production, Value, Price and Gross Margin (2019-2023)
- 7.7.4 Hankook Description and Business Overview
- 7.8 Yokohama
- 7.8.1 Yokohama Company Information
- 7.8.2 Yokohama Tires Product Portfolio
- 7.8.3 Yokohama Tires Production, Value, Price and Gross Margin (2019-2023)
- 7.8.4 Yokohama Description and Business Overview
- 7.9 Zhongce Rubber Group
- 7.9.1 Zhongce Rubber Group Company Information
- 7.9.2 Zhongce Rubber Group Tires Product Portfolio
- 7.9.3 Zhongce Rubber Group Tires Production, Value, Price and Gross Margin (2019-2023)
- 7.9.4 Zhongce Rubber Group Description and Business Overview
- 7.10 Apollo Tyres
- 7.10.1 Apollo Tyres Company Information
- 7.10.2 Apollo Tyres Tires Product Portfolio
- 7.10.3 Apollo Tyres Tires Production, Value, Price and Gross Margin (2019-2023)
- 7.10.4 Apollo Tyres Description and Business Overview
- 7.11 Toyo Tire Corporation
- 7.11.1 Toyo Tire Corporation Company Information
- 7.11.2 Toyo Tire Corporation Tires Product Portfolio
- 7.11.3 Toyo Tire Corporation Tires Production, Value, Price and Gross Margin (2019-2023)
- 7.11.4 Toyo Tire Corporation Description and Business Overview
- 7.12 Nexen Tire
- 7.12.1 Nexen Tire Company Information
- 7.12.2 Nexen Tire Tires Product Portfolio
- 7.12.3 Nexen Tire Tires Production, Value, Price and Gross Margin (2019-2023)
- 7.12.4 Nexen Tire Description and Business Overview
- 7.13 Cheng Shin Rubber
- 7.13.1 Cheng Shin Rubber Company Information
- 7.13.2 Cheng Shin Rubber Tires Product Portfolio
- 7.13.3 Cheng Shin Rubber Tires Production, Value, Price and Gross Margin (2019-2023)
- 7.13.4 Cheng Shin Rubber Description and Business Overview
- 7.14 Sailun Group
- 7.14.1 Sailun Group Company Information
- 7.14.2 Sailun Group Tires Product Portfolio
- 7.14.3 Sailun Group Tires Production, Value, Price and Gross Margin (2019-2023)
- 7.14.4 Sailun Group Description and Business Overview
- 7.15 Kumho Tire
- 7.15.1 Kumho Tire Company Information
- 7.15.2 Kumho Tire Tires Product Portfolio
- 7.15.3 Kumho Tire Tires Production, Value, Price and Gross Margin (2019-2023)
- 7.15.4 Kumho Tire Description and Business Overview
- 7.16 Giti Tire Corporation
- 7.16.1 Giti Tire Corporation Company Information
- 7.16.2 Giti Tire Corporation Tires Product Portfolio
- 7.16.3 Giti Tire Corporation Tires Production, Value, Price and Gross Margin (2019-2023)
- 7.16.4 Giti Tire Corporation Description and Business Overview
- 7.17 MRF
- 7.17.1 MRF Company Information
- 7.17.2 MRF Tires Product Portfolio
- 7.17.3 MRF Tires Production, Value, Price and Gross Margin (2019-2023)
- 7.17.4 MRF Description and Business Overview
- 7.18 Shandong Linglong Tire
- 7.18.1 Shandong Linglong Tire Company Information
- 7.18.2 Shandong Linglong Tire Tires Product Portfolio
- 7.18.3 Shandong Linglong Tire Tires Production, Value, Price and Gross Margin (2019-2023)
- 7.18.4 Shandong Linglong Tire Description and Business Overview
- 7.19 Nokian Tyres
- 7.19.1 Nokian Tyres Company Information
- 7.19.2 Nokian Tyres Tires Product Portfolio
- 7.19.3 Nokian Tyres Tires Production, Value, Price and Gross Margin (2019-2023)
- 7.19.4 Nokian Tyres Description and Business Overview
- 7.20 Double Coin Group
- 7.20.1 Double Coin Group Company Information
- 7.20.2 Double Coin Group Tires Product Portfolio
- 7.20.3 Double Coin Group Tires Production, Value, Price and Gross Margin (2019-2023)
- 7.20.4 Double Coin Group Description and Business Overview
- 7.21 Triangle Tire Group
- 7.21.1 Triangle Tire Group Company Information
- 7.21.2 Triangle Tire Group Tires Product Portfolio
- 7.21.3 Triangle Tire Group Tires Production, Value, Price and Gross Margin (2019-2023)
- 7.21.4 Triangle Tire Group Description and Business Overview
- 7.22 Guizhou Tyre
- 7.22.1 Guizhou Tyre Company Information
- 7.22.2 Guizhou Tyre Tires Product Portfolio
- 7.22.3 Guizhou Tyre Tires Production, Value, Price and Gross Margin (2019-2023)
- 7.22.4 Guizhou Tyre Description and Business Overview
- 7.23 Kenda Tires
- 7.23.1 Kenda Tires Company Information
- 7.23.2 Kenda Tires Tires Product Portfolio
- 7.23.3 Kenda Tires Tires Production, Value, Price and Gross Margin (2019-2023)
- 7.23.4 Kenda Tires Description and Business Overview
- 7.24 Qingdao Double Star Tire
- 7.24.1 Qingdao Double Star Tire Company Information
- 7.24.2 Qingdao Double Star Tire Tires Product Portfolio
- 7.24.3 Qingdao Double Star Tire Tires Production, Value, Price and Gross Margin (2019-2023)
- 7.24.4 Qingdao Double Star Tire Description and Business Overview
8 Industry Chain and Sales Channels Analysis
- 8.1 Tires Industry Chain Analysis
- 8.2 Tires Key Raw Materials
- 8.2.1 Key Raw Materials
- 8.2.2 Raw Materials Key Suppliers
- 8.3 Tires Sales and Marketing
- 8.4 Tires Customers
9 Tires Market Dynamics
- 9.1 Tires Industry Trends
- 9.2 Tires Market Drivers
- 9.3 Tires Market Challenges
10 Research Findings and Conclusion
11 Methodology and Data Source
- 11.1 Methodology/Research Approach
- 11.1.1 Research Programs/Design
- 11.1.2 Market Size Estimation
- 11.1.3 Market Breakdown and Data Triangulation
- 11.2 Data Source
- 11.2.1 Secondary Sources
- 11.2.2 Primary Sources
- 11.3 Author List
- 11.4 Disclaimer