|
|
市場調査レポート
商品コード
1370681
重水の世界市場の規模、メーカー、サプライチェーン、販売チャネル、顧客(2023年~2029年)Global Heavy Water Market Size, Manufacturers, Supply Chain, Sales Channel and Clients, 2023-2029 |
||||||
|
|
|||||||
|
● お客様のご希望に応じて、既存データの加工や未掲載情報(例:国別セグメント)の追加などの対応が可能です。 詳細はお問い合わせください。 |
|||||||


| 重水の世界市場の規模、メーカー、サプライチェーン、販売チャネル、顧客(2023年~2029年) |
|
出版日: 2023年10月30日
発行: QYResearch
ページ情報: 英文 103 Pages
納期: 2~3営業日
|
- 全表示
- 概要
- 図表
- 目次
世界の重水の市場規模は、2023年に5,738万米ドル、2029年までに9,122万米ドルに達し、2023年~2029年にCAGRで8.03%の成長が予測されています。
中国の重水の市場規模は2022年に618万米ドルであり、米国は2,977万米ドル、欧州は1,281万米ドルでした。米国の割合は2022年に53.15%、中国と欧州はそれぞれ11.03%と22.87%で、中国の割合は2029年に14.89%に達し、分析期間にCAGRで12.84%の成長が予測されます。アジアでは日本、韓国、東南アジアが注目すべき市場であり、今後6年間のCAGRはそれぞれ8.58%、8.35%、9.03%です。欧州の重水情勢としては、ドイツの市場規模が2029年までに448万米ドルに達し、予測期間にCAGRで6.50%の成長が見込まれています。
当レポートでは、世界の重水市場について調査分析し、市場規模の推計と予測、地域とセグメントの分析、企業プロファイルなどを提供しています。
目次
第1章 調査範囲
- 重水製品のイントロダクション
- 市場:タイプ別
- 世界の重水の市場規模成長率:タイプ別(2018年・2022年・2029年)
- 純度99%
- 純度99.8%
- 純度99.9%
- 市場:用途別
- 世界の重水の市場規模成長率:用途別(2018年・2022年・2029年)
- 重水素化NMR溶媒
- 半導体
- OLED
- 製薬
- その他
- 調査目的
- 考慮された年数
第2章 エグゼクティブサマリー
- 世界の重水の市場規模の推計と予測
- 世界の重水の収益(2018年~2029年)
- 世界の重水の売上(2018年~2029年)
- 重水の市場規模:地域別(2022年・2029年)
- 重水の売上:地域別(2018年~2029年)
- 世界の重水の売上:地域別(2018年~2023年)
- 世界の重水の売上の予測:地域別(2024年~2029年)
- 世界の重水の売上の市場シェア:地域別(2018年~2029年)
- 重水市場の推計と予測:地域別(2024年~2029年)
- 世界の重水の収益:地域別(2018年~2023年)
- 世界の重水の収益の予測:地域別(2024年~2029年)
- 世界の重水の収益の市場シェア:地域別(2018年~2029年)
第3章 世界の重水:メーカー別
- 世界の主要重水メーカー:売上別(2018年~2023年)
- 世界の重水の売上:メーカー別(2018年~2023年)
- 世界の重水の売上の市場シェア:メーカー別(2018年~2023年)
- 世界の主要重水メーカー:収益別(2018年~2023年)
- 世界の重水の収益:メーカー別(2018年~2023年)
- 世界の重水の収益シェア:メーカー別(2018年~2023年)
- 世界の重水の価格:メーカー別(2018年~2023年)
- 競合情勢
- 対象の主要重水メーカー:収益ランキング
- 世界の重水の市場集中度(CR5、HHI)(2018年~2023年)
- 世界の重水の市場シェア:企業タイプ別(Tier 1・Tier 2・Tier 3)
- 世界の重水製造拠点の分布、製品タイプ
- 重水メーカー製造拠点ロジスティクス・本社
- メーカーの重水の製品タイプと用途
- 重水市場の国際メーカーの設立日
第4章 企業プロファイル
- Isowater
- Cambridge Isotope Laboratories
- Mesbah Energy
- Heavy Water Board (HWB)
第5章 内訳データ:タイプ別
- 世界の重水の売上:タイプ別(2018年~2029年)
- 世界の重水の売上:タイプ別(2018年~2023年)
- 世界の重水の売上の予測:タイプ別(2024年~2029年)
- 世界の重水の売上の市場シェア:タイプ別(2018年~2029年)
- 世界の重水の収益の予測:タイプ別(2018年~2029年)
- 世界の重水の収益:タイプ別(2018年~2023年)
- 世界の重水の収益の予測:タイプ別(2024年~2029年)
- 世界の重水の収益の市場シェア:タイプ別(2018年~2029年)
- 重水の平均販売価格(ASP):タイプ別(2018年~2029年)
第6章 内訳データ:用途別
- 世界の重水の売上:用途別(2018年~2029年)
- 世界の重水の売上:用途別(2018年~2023年)
- 世界の重水の売上の予測:用途別(2024年~2029年)
- 世界の重水の売上の市場シェア:用途別(2018年~2029年)
- 世界の重水の収益の予測:用途別(2018年~2029年)
- 世界の重水の収益:用途別(2018年~2023年)
- 世界の重水の収益の予測:用途別(2024年~2029年)
- 世界の重水の収益の市場シェア:用途別(2018年~2029年)
- 重水の平均販売価格(ASP):用途別(2018年~2029年)
第7章 北米
- 北米の重水の市場規模の前年比成長(2018年~2029年)
- 北米の重水市場の事実と数字:国別
- 北米の重水の売上:国別(2018年~2029年)
- 北米の重水の収益:国別(2018年~2029年)
- 北米の重水の売上:タイプ別(2018年~2029年)
- 北米の重水の売上:用途別(2018年~2029年)
第8章 欧州
- 欧州の重水の市場規模の前年比成長(2018年~2029年)
- 欧州の重水市場の事実と数字:国別
- 欧州の重水の売上:国別(2018年~2029年)
- 欧州の重水の収益:国別(2018年~2029年)
- 欧州の重水の売上:タイプ別(2018年~2029年)
- 欧州の重水の売上:用途別(2018年~2029年)
第9章 アジア太平洋
- アジア太平洋の重水の市場規模の前年比成長(2018年~2029年)
- アジア太平洋の重水市場の事実と数字:地域別
- アジア太平洋の重水の売上:地域別(2018年~2029年)
- アジア太平洋の重水の収益:地域別(2018年~2029年)
- アジア太平洋の重水の売上:タイプ別(2018年~2029年)
- アジア太平洋の重水の売上:用途別(2018年~2029年)
第10章 ラテンアメリカ
- ラテンアメリカの重水の市場規模の前年比成長(2018年~2029年)
- ラテンアメリカの重水市場の事実と数字:国別
- ラテンアメリカの重水の売上:国別(2018年~2029年)
- ラテンアメリカの重水の収益:国別(2018年~2029年)
- ラテンアメリカの重水の売上:タイプ別(2018年~2029年)
- ラテンアメリカの重水の売上:用途別(2018年~2029年)
第11章 中東・アフリカ
- ラテンアメリカの重水の市場規模の前年比成長(2018年~2029年)
- 中東・アフリカの重水市場の事実と数字:国別
- 中東・アフリカの重水の売上:国別(2018年~2029年)
- 中東・アフリカの重水の収益:国別(2018年~2029年)
- 中東・アフリカの重水の売上:タイプ別(2018年~2029年)
- 中東・アフリカの重水の売上:用途別(2018年~2029年)
第12章 サプライチェーンと販売チャネルの分析
- 重水サプライチェーン分析
- 重水の主な原材料と上流サプライヤー
- 重水の生産方式とプロセス
- GSプロセス
- アンモニア水素交換プロセス
- 重水の顧客
- 重水の販売業者
第13章 重水の市場力学
- 重水産業の動向
- 重水市場の促進要因
- 重水市場の課題
第14章 調査結果と結論
第15章 付録
List of Tables
- Table 1. Global Heavy Water Market Size Growth Rate by Type (US$ Million): 2018 VS 2022 VS 2029
- Table 2. Major Manufacturers of 99% Purity
- Table 3. Major Manufacturers of 99.8% Purity
- Table 4. Major Manufacturers of 99.9% Purity
- Table 5. Global Heavy Water Market Size Growth by Application (US$ Million): 2018 VS 2022 VS 2029
- Table 6. Global Heavy Water Market Size by Region (US$ Million): 2022 VS 2029
- Table 7. Global Heavy Water Sales by Region (2018-2023) & (Kg)
- Table 8. Global Heavy Water Sales Forecast by Region (2024-2029) & (Kg)
- Table 9. Global Heavy Water Revenue by Region (2018-2023) & (US$ Million)
- Table 10. Global Heavy Water Revenue Forecast by Region (2024-2029) & (US$ Million)
- Table 11. Global Heavy Water Sales by Manufacturer (2018-2023) & (Kg)
- Table 12. Global Heavy Water Sales Share by Manufacturer (2018-2023)
- Table 13. Heavy Water Revenue by Manufacturer (2018-2023) & (US$ Million)
- Table 14. Heavy Water Revenue Share by Manufacturer (2018-2023)
- Table 15. Key Manufacturers Heavy Water Price (2018-2023) & (US$/Kg)
- Table 16. Ranking of Global Top Heavy Water Manufacturers by Revenue (US$ Million) in 2022
- Table 17. Global Heavy Water Manufacturers Market Concentration Ratio (CR5 and HHI) & (2018-2023)
- Table 18. Global Heavy Water by Company Type (Tier 1, Tier 2, and Tier 3) & (based on the Revenue in Heavy Water as of 2022)
- Table 19. Heavy Water Manufacturers Manufacturing Base Distribution and Headquarters
- Table 20. Manufacturers Heavy Water Product Type and Application
- Table 21. Established Date of International Manufacturers in Heavy Water Market
- Table 22. Isowater Company Information
- Table 23. Isowater Description and Business Overview
- Table 24. Isowater Heavy Water Product
- Table 25. Isowater Heavy Water Sales (Kg), Revenue (US$ Million), Price (US$/Kg) and Gross Margin (2018-2023)
- Table 26. Isowater Sales Proportion of Heavy Water by Product in 2022
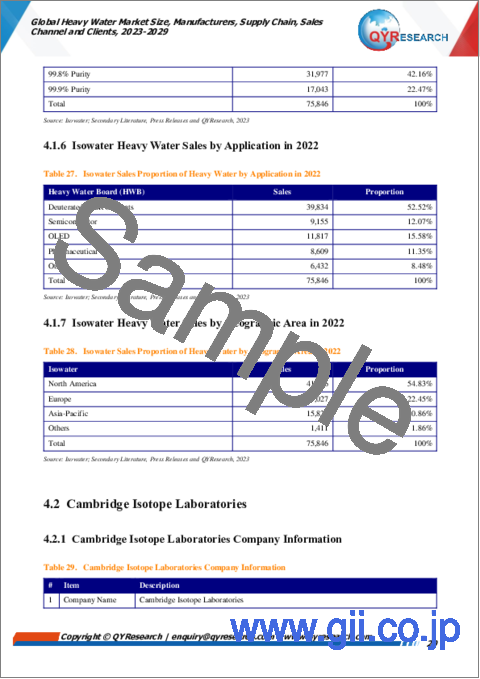
- Table 27. Isowater Sales Proportion of Heavy Water by Application in 2022
- Table 28. Isowater Sales Proportion of Heavy Water by Geographic Area in 2022
- Table 29. Cambridge Isotope Laboratories Company Information
- Table 30. Cambridge Isotope Laboratories Description and Business Overview
- Table 31. Cambridge Isotope Laboratories Heavy Water Product
- Table 32. Cambridge Isotope Laboratories Heavy Water Sales (Kg), Revenue (US$ Million), Price (US$/Kg) and Gross Margin (2018-2023)
- Table 33. Cambridge Isotope Laboratories Sales Proportion of Heavy Water by Product in 2022
- Table 34. Cambridge Isotope Laboratories Sales Proportion of Heavy Water by Application in 2022
- Table 35. Cambridge Isotope Laboratories Sales Proportion of Heavy Water by Geographic Area in 2022
- Table 36. Mesbah Energy Company Information
- Table 37. Mesbah Energy Description and Business Overview
- Table 38. Mesbah Energy Heavy Water Product
- Table 39. Mesbah Energy Heavy Water Sales (Kg), Revenue (US$ Million), Price (US$/Kg) and Gross Margin (2018-2023)
- Table 40. Mesbah Energy Sales Proportion of Heavy Water by Product in 2022
- Table 41. Mesbah Energy Sales Proportion of Heavy Water by Application in 2022
- Table 42. Mesbah Energy Sales Proportion of Heavy Water by Geographic Area in 2022
- Table 43. Heavy Water Board (HWB) Company Information
- Table 44. Heavy Water Board (HWB) Description and Business Overview
- Table 45. Heavy Water Board (HWB) Heavy Water Product
- Table 46. Heavy Water Board (HWB) Heavy Water Sales (Kg), Revenue (US$ Million), Price (US$/Kg) and Gross Margin (2018-2023)
- Table 47. Heavy Water Board (HWB) Sales Proportion of Heavy Water by Product in 2022
- Table 48. Heavy Water Board (HWB) Sales Proportion of Heavy Water by Application in 2022
- Table 49. Heavy Water Board (HWB) Sales Proportion of Heavy Water by Geographic Area in 2022
- Table 50. Heavy Water Board (HWB) Recent Developments
- Table 51. Global Heavy Water Sales by Type (2018-2023) & (Kg)
- Table 52. Global Heavy Water Sales Forecast by Type (2024-2029) & (Kg)
- Table 53. Global Heavy Water Revenue by Type (2018-2023) & (US$ Million)
- Table 54. Global Heavy Water Revenue Forecast by Type (2024-2029) & (US$ Million)
- Table 55. Heavy Water Average Selling Price (ASP) by Type (2018-2023) & (US$/Kg)
- Table 56. Heavy Water Average Selling Price (ASP) by Type (2024-2029) & (US$/Kg)
- Table 57. Global Heavy Water Sales by Application (2018-2023) & (Kg)
- Table 58. Global Heavy Water Sales Forecast by Application (2024-2029) & (Kg)
- Table 59. Global Heavy Water Revenue by Application (2018-2023) & (US$ Million)
- Table 60. Global Heavy Water Revenue Forecast by Application (2024-2029) & (US$ Million)
- Table 61. Heavy Water Average Selling Price (ASP) by Application (2018-2023) & (US$/Kg)
- Table 62. Heavy Water Average Selling Price (ASP) by Application (2024-2026) & (US$/Kg)
- Table 63. North America Heavy Water Sales by Country (2018-2029) & (Kg)
- Table 64. North America Heavy Water Sales by Country (2024-2029) & (Kg)
- Table 65. North America Heavy Water Revenue by Country (2018-2029) & (US$ Million)
- Table 66. North America Heavy Water Revenue by Country (2024-2029) & (US$ Million)
- Table 67. North America Heavy Water Sales by Type (2018-2023) & (Kg)
- Table 68. North America Heavy Water Sales by Type (2024-2029) & (Kg)
- Table 69. North America Heavy Water Sales by Application (2018-2023) & (Kg)
- Table 70. North America Heavy Water Sales by Application (2018-2023) & (Kg)
- Table 71. Europe Heavy Water Sales by Country (2018-2029) & (Kg)
- Table 72. Europe Heavy Water Sales by Country (2024-2029) & (Kg)
- Table 73. Europe Heavy Water Revenue by Country (2018-2029) & (US$ Million)
- Table 74. Europe Heavy Water Revenue by Country (2024-2029) & (US$ Million)
- Table 75. Europe Heavy Water Sales by Type (2018-2023) & (Kg)
- Table 76. Europe Heavy Water Sales by Type (2024-2029) & (Kg)
- Table 77. Europe Heavy Water Sales by Application (2018-2023) & (Kg)
- Table 78. Europe Heavy Water Sales by Application (2024-2029) & (Kg)
- Table 79. Asia-Pacific Heavy Water Sales by Region (2018-2029) & (Kg)
- Table 80. Asia-Pacific Heavy Water Sales by Region (2024-2029) & (Kg)
- Table 81. Asia-Pacific Heavy Water Revenue by Region (2018-2029) & (US$ Million)
- Table 82. Asia-Pacific Heavy Water Revenue by Region (2024-2029) & (US$ Million)
- Table 83. Asia-Pacific Heavy Water Sales by Type (2018-2023) & (Kg)
- Table 84. Asia-Pacific Heavy Water Sales by Type (2024-2029) & (Kg)
- Table 85. Asia-Pacific Heavy Water Sales by Application (2018-2023) & (Kg)
- Table 86. Asia-Pacific Heavy Water Sales by Application (2024-2029) & (Kg)
- Table 87. Latin America Heavy Water Sales by Country (2018-2029) & (Kg)
- Table 88. Latin America Heavy Water Sales by Country (2024-2029) & (Kg)
- Table 89. Latin America Heavy Water Revenue by Country (2018-2029) & (US$ Million)
- Table 90. Latin America Heavy Water Revenue by Country (2024-2029) & (US$ Million)
- Table 91. Latin America Heavy Water Sales by Type (2018-2023) & (Kg)
- Table 92. Latin America Heavy Water Sales by Type (2024-2029) & (Kg)
- Table 93. Latin America Heavy Water Sales by Application (2018-2023) & (Kg)
- Table 94. Latin America Heavy Water Sales by Application (2024-2029) & (Kg)
- Table 95. Middle East and Africa Heavy Water Sales by Country (2018-2029) & (Kg)
- Table 96. Middle East and Africa Heavy Water Sales by Country (2024-2029) & (Kg)
- Table 97. Middle East and Africa Heavy Water Revenue by Country (2018-2029) & (US$ Million)
- Table 98. Middle East and Africa Heavy Water Revenue by Country (2024-2029) & (US$ Million)
- Table 99. Middle East and Africa Heavy Water Sales by Type (2018-2023) & (Kg)
- Table 100. Middle East and Africa Heavy Water Sales by Type (2023-2029) & (Kg)
- Table 101. Middle East and Africa Heavy Water Sales by Application (2018-2023) & (Kg)
- Table 102. Middle East and Africa Heavy Water Sales by Application (2024-2029) & (Kg)
- Table 103. Heavy Water Key Raw Materials
- Table 104. Heavy Water Key Raw Materials and Upstream Suppliers
- Table 105. Heavy Water Typical Clients
- Table 106. Heavy Water Distributors
- Table 107. Heavy Water Market Trends
- Table 108. Heavy Water Market Drivers
- Table 109. Heavy Water Market Challenges
- Table 110. Research Programs/Design for This Report
- Table 111. Key Data Information from Secondary Sources
- Table 112. Key Data Information from Primary Sources
List of Figures
- Figure 1. Heavy Water Product Picture
- Figure 2. Global Heavy Water Market Size by Type (US$ Million): 2018 VS 2022 VS 2029
- Figure 3. Global Heavy Water Sales Market Share by Type in 2022 & 2029
- Figure 4. 99% Purity Product Picture
- Figure 5. 99.8% Purity Product Picture
- Figure 6. 99.9% Purity Product Picture
- Figure 7. Global Heavy Water Market Size by Application (US$ Million): 2018 VS 2022 VS 2029
- Figure 8. Global Heavy Water Sales Market Share by Application in 2022 & 2029
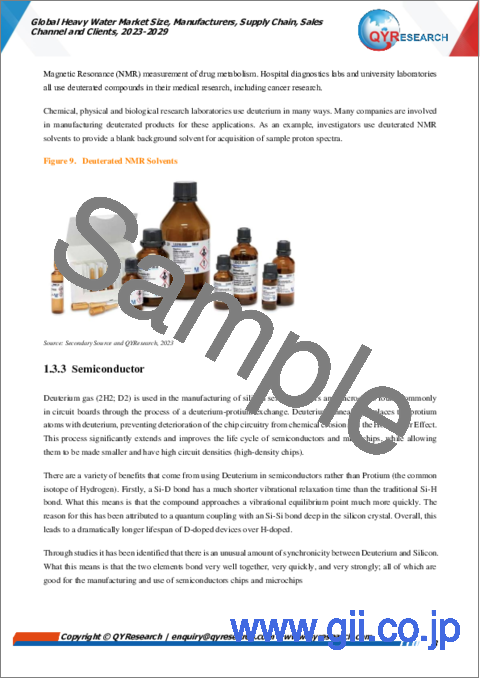
- Figure 9. Deuterated NMR Solvents
- Figure 10. Semiconductor
- Figure 11. OLED
- Figure 12. Pharmaceutical
- Figure 13. Hydrology
- Figure 14. Heavy Water Report Years Considered
- Figure 15. Global Heavy Water Revenue, (US$ Million), 2018 VS 2022 VS 2029
- Figure 16. Global Heavy Water Market Size 2018-2029 (US$ Million)
- Figure 17. Global Heavy Water Sales 2018-2029 (Kg)
- Figure 18. Global Heavy Water Sales Market Share Forecast by Region (2018-2029)
- Figure 19. Global Heavy Water Revenue Market Share by Region (2018-2029)
- Figure 20. Global Heavy Water Sales Share by Manufacturer in 2022
- Figure 21. Global Heavy Water Sales Market Share Forecast by Type (2018-2029)
- Figure 22. Global Heavy Water Revenue Market Share Forecast by Type (2018-2029)
- Figure 23. Global Heavy Water Sales Market Share Forecast by Application (2018-2029)
- Figure 24. Global Heavy Water Revenue Market Share Forecast by Application (2018-2029)
- Figure 25. North America Heavy Water Revenue 2018-2029 (US$ Million)
- Figure 26. North America Heavy Water Sales Market Share by Type (2018-2029)
- Figure 27. North America Heavy Water Sales Market Share by Application (2018-2029)
- Figure 28. Europe Heavy Water Revenue Growth Rate 2018-2029 (US$ Million)
- Figure 29. Europe Heavy Water Sales Market Share by Country (2018-2029)
- Figure 30. Europe Heavy Water Revenue Market Share by Country (2018-2029)
- Figure 31. Europe Heavy Water Sales Market Share by Type (2018-2029)
- Figure 32. Europe Heavy Water Sales Market Share by Application (2018-2029)
- Figure 33. Asia-Pacific Heavy Water Revenue 2018-2029 (US$ Million)
- Figure 34. Asia-Pacific Heavy Water Sales Market Share by Region (2018-2029)
- Figure 35. Asia-Pacific Heavy Water Revenue Market Share by Region (2018-2029)
- Figure 36. Asia-Pacific Heavy Water Sales Market Share by Type (2018-2029)
- Figure 37. Asia-Pacific Heavy Water Sales Market Share by Application (2018-2029)
- Figure 38. Latin America Heavy Water Revenue Growth Rate 2018-2029 (US$ Million)
- Figure 39. Latin America Heavy Water Sales Market Share by Country (2018-2029)
- Figure 40. Latin America Heavy Water Revenue Market Share by Country (2018-2029)
- Figure 41. Latin America Heavy Water Sales Market Share by Type (2018-2029)
- Figure 42. Latin America Heavy Water Sales Market Share by Application (2018-2029)
- Figure 43. Middle East and Africa Heavy Water Revenue Growth Rate 2018-2029 (US$ Million)
- Figure 44. Middle East and Africa Heavy Water Sales Market Share by Country (2018-2029)
- Figure 45. Middle East and Africa Heavy Water Revenue Market Share by Country (2018-2029)
- Figure 46. Middle East and Africa Heavy Water Sales Market Share by Type (2018-2029)
- Figure 47. Middle East and Africa Heavy Water Sales Market Share by Application (2018-2029)
- Figure 48. Heavy Water Supply Chain (Upstream and Downstream Market)
- Figure 49. Heavy Water Production Process
- Figure 50. Bottom-up and Top-down Approaches for This Report
- Figure 51. Data Triangulation
- Figure 52. Key Executives Interviewed
The global Heavy Water market is projected to reach US$ 91.22 million by 2029 from an estimated US$ 57.38 million in 2023, at a CAGR of 8.03% during 2023 and 2029.
China Heavy Water market size was US$ 6.18 million in 2022, while the US and Europe Heavy Water were US$ 29.77 million and US$ 12.81 million, severally. The proportion of the US was 53.15% in 2022, while China and Europe were 11.03% and 22.87% respectively, and it is predicted that China proportion will reach 14.89% in 2029, trailing a CAGR of 12.84% through the analysis period. Japan, South Korea, and Southeast Asia are noteworthy markets in Asia, with CAGR 8.58%, 8.35%, and 9.03% respectively for the next 6-year period. As for the Europe Heavy Water landscape, Germany is projected to reach US$ 4.48 million by 2029 trailing a CAGR of 6.50% over the forecast period.
The global key companies of Heavy Water include: Isowater, Cambridge Isotope Laboratories, Mesbah Energy, Heavy Water Board (HWB), and etc. In 2022, the global four largest players hold a share approximately 82.93% in terms of revenue.
Report Scope
This report aims to provide a comprehensive presentation of the global market for Heavy Water, with both quantitative and qualitative analysis, to help readers develop business/growth strategies, assess the market competitive situation, analyze their position in the current marketplace, and make informed business decisions regarding Heavy Water.
The Heavy Water market size, estimations, and forecasts are provided in terms of sales volume (K Units) and revenue ($ millions), considering 2022 as the base year, with history and forecast data for the period from 2018 to 2029. This report segments the global Heavy Water market comprehensively. Regional market sizes, concerning products by Type, by Application, and by players, are also provided.
For a more in-depth understanding of the market, the report provides profiles of the competitive landscape, key competitors, and their respective market ranks. The report also discusses technological trends and new product developments.
The report will help the Heavy Water manufacturers, new entrants, and industry chain related companies in this market with information on the revenues, sales volume, and average price for the overall market and the sub-segments across the different segments, by company, by Type, by Application, and regions.
By Company
- Isowater
- Cambridge Isotope Laboratories
- Mesbah Energy
- Heavy Water Board (HWB)
Segment by Type
- 99% Purity
- 99.8% Purity
- 99.9% Purity
Segment by Application
- Deuterated NMR Solvents
- Semiconductor
- OLED
- Pharmaceutical
- Others
By Region
- North America
- United States
- Canada
- Asia-Pacific
- China
- Japan
- South Korea
- India
- Southeast Asia
- Australia
- Rest of Asia-Pacific
- Europe
- Germany
- France
- U.K.
- Italy
- Russia
- Rest of Europe
- Latin America
- Mexico
- Brazil
- Rest of Latin America
- Middle East & Africa
- Turkey
- GCC Countries
- Africa
- Rest of MEA
Table of Contents
1 Study Coverage
- 1.1 Heavy Water Product Introduction
- 1.2 Market by Type
- 1.2.1 Global Heavy Water Market Size Growth Rate by Type (2018 VS 2022 VS 2029)
- 1.2.2 99% Purity
- 1.2.3 99.8% Purity
- 1.2.4 99.9% Purity
- 1.3 Market by Application
- 1.3.1 Global Heavy Water Market Size Growth Rate by Application (2018 VS 2022 VS 2029)
- 1.3.2 Deuterated NMR Solvents
- 1.3.3 Semiconductor
- 1.3.4 OLED
- 1.3.5 Pharmaceutical
- 1.3.6 Others
- 1.4 Study Objectives
- 1.5 Years Considered
2 Executive Summary
- 2.1 Global Heavy Water Market Size Estimates and Forecasts
- 2.1.1 Global Heavy Water Revenue 2018-2029
- 2.1.2 Global Heavy Water Sales 2018-2029
- 2.2 Heavy Water Market Size by Region: 2022 Versus 2029
- 2.3 Heavy Water Sales by Region (2018-2029)
- 2.3.1 Global Heavy Water Sales by Region: 2018-2023
- 2.3.2 Global Heavy Water Sales Forecast by Region (2024-2029)
- 2.3.3 Global Heavy Water Sales Market Share by Region (2018-2029)
- 2.4 Heavy Water Market Estimates and Projections by Region (2024-2029)
- 2.4.1 Global Heavy Water Revenue by Region: 2018-2023
- 2.4.2 Global Heavy Water Revenue Forecast by Region (2024-2029)
- 2.4.3 Global Heavy Water Revenue Market Share by Region (2018-2029)
3 Global Heavy Water by Manufacturers
- 3.1 Global Top Heavy Water Manufacturers by Sales (2018-2023)
- 3.1.1 Global Heavy Water Sales by Manufacturer (2018-2023)
- 3.1.2 Global Heavy Water Sales Market Share by Manufacturer (2018-2023)
- 3.2 Global Top Heavy Water Manufacturers by Revenue (2018-2023)
- 3.2.1 Global Heavy Water Revenue by Manufacturer (2018-2023)
- 3.2.2 Global Heavy Water Revenue Share by Manufacturer (2018-2023)
- 3.3 Global Heavy Water Price by Manufacturer (2018-2023)
- 3.4 Competitive Landscape
- 3.4.1 Key Heavy Water Manufacturers Covered: Ranking by Revenue
- 3.4.2 Global Heavy Water Market Concentration Ratio (CR5 and HHI) & (2018-2023)
- 3.4.3 Global Heavy Water Market Share by Company Type (Tier 1, Tier 2, and Tier 3)
- 3.5 Global Heavy Water Manufacturing Base Distribution, Product Type
- 3.5.1 Heavy Water Manufacturers Manufacturing Base Distribution, Headquarters
- 3.5.2 Manufacturers Heavy Water Product Type and Application
- 3.5.3 Established Date of International Manufacturers in Heavy Water Market
4 Company Profiles
- 4.1 Isowater
- 4.1.1 Isowater Company Information
- 4.1.2 Isowater Description, Business Overview
- 4.1.3 Isowater Heavy Water Products Offered
- 4.1.4 Isowater Heavy Water Sales, Revenue and Gross Margin (2018-2023)
- 4.1.5 Isowater Heavy Water Sales by Product in 2022
- 4.1.6 Isowater Heavy Water Sales by Application in 2022
- 4.1.7 Isowater Heavy Water Sales by Geographic Area in 2022
- 4.2 Cambridge Isotope Laboratories
- 4.2.1 Cambridge Isotope Laboratories Company Information
- 4.2.2 Cambridge Isotope Laboratories Description, Business Overview
- 4.2.3 Cambridge Isotope Laboratories Heavy Water Products Offered
- 4.2.4 Cambridge Isotope Laboratories Heavy Water Sales, Revenue and Gross Margin (2018-2023)
- 4.2.5 Cambridge Isotope Laboratories Heavy Water Sales by Product in 2022
- 4.2.6 Cambridge Isotope Laboratories Heavy Water Sales by Application in 2022
- 4.2.7 Cambridge Isotope Laboratories Heavy Water Sales by Geographic Area in 2022
- 4.3 Mesbah Energy
- 4.3.1 Mesbah Energy Company Information
- 4.3.2 Mesbah Energy Description, Business Overview
- 4.3.3 Mesbah Energy Heavy Water Products Offered
- 4.3.4 Mesbah Energy Heavy Water Sales, Revenue and Gross Margin (2018-2023)
- 4.3.5 Mesbah Energy Heavy Water Sales by Product in 2022
- 4.3.6 Mesbah Energy Heavy Water Sales by Application in 2022
- 4.3.7 Mesbah Energy Heavy Water Sales by Geographic Area in 2022
- 4.4 Heavy Water Board (HWB)
- 4.4.1 Heavy Water Board (HWB) Company Information
- 4.4.2 Heavy Water Board (HWB) Description, Business Overview
- 4.4.3 Heavy Water Board (HWB) Heavy Water Products Offered
- 4.4.4 Heavy Water Board (HWB) Heavy Water Sales, Revenue and Gross Margin (2018-2023)
- 4.4.5 Heavy Water Board (HWB) Heavy Water Sales by Product in 2022
- 4.4.6 Heavy Water Board (HWB) Heavy Water Sales by Application in 2022
- 4.4.7 Heavy Water Board (HWB) Heavy Water Sales by Geographic Area in 2022
- 4.4.8 Heavy Water Board (HWB) Recent Developments
5 Breakdown Data by Type
- 5.1 Global Heavy Water Sales by Type (2018-2029)
- 5.1.1 Global Heavy Water Sales by Type (2018-2023)
- 5.1.2 Global Heavy Water Sales Forecast by Type (2024-2029)
- 5.1.3 Global Heavy Water Sales Market Share by Type (2018-2029)
- 5.2 Global Heavy Water Revenue Forecast by Type (2018-2029)
- 5.2.1 Global Heavy Water Revenue by Type (2018-2023)
- 5.2.2 Global Heavy Water Revenue Forecast by Type (2024-2029)
- 5.2.3 Global Heavy Water Revenue Market Share by Type (2018-2029)
- 5.3 Heavy Water Average Selling Price (ASP) by Type (2018-2029)
6 Breakdown Data by Application
- 6.1 Global Heavy Water Sales by Application (2018-2029)
- 6.1.1 Global Heavy Water Sales by Application (2018-2023)
- 6.1.2 Global Heavy Water Sales Forecast by Application (2024-2029)
- 6.1.3 Global Heavy Water Sales Market Share by Application (2018-2029)
- 6.2 Global Heavy Water Revenue Forecast by Application (2018-2029)
- 6.2.1 Global Heavy Water Revenue by Application (2018-2023)
- 6.2.2 Global Heavy Water Revenue Forecast by Application (2024-2029)
- 6.2.3 Global Heavy Water Revenue Market Share by Application (2018-2029)
- 6.3 Heavy Water Average Selling Price (ASP) by Application (2018-2029)
7 North America
- 7.1 North America Heavy Water Market Size YoY Growth 2018-2029
- 7.2 North America Heavy Water Market Facts & Figures by Country
- 7.2.1 North America Heavy Water Sales by Country (2018-2029)
- 7.2.2 North America Heavy Water Revenue by Country (2018-2029)
- 7.3 North America Heavy Water Sales by Type (2018-2029)
- 7.4 North America Heavy Water Sales by Application (2018-2029)
8 Europe
- 8.1 Europe Heavy Water Market Size YoY Growth 2018-2029
- 8.2 Europe Heavy Water Market Facts & Figures by Country
- 8.2.1 Europe Heavy Water Sales by Country (2018-2029)
- 8.2.2 Europe Heavy Water Revenue by Country (2018-2029)
- 8.3 Europe Heavy Water Sales by Type (2018-2029)
- 8.4 Europe Heavy Water Sales by Application (2018-2029)
9 Asia-Pacific
- 9.1 Asia-Pacific Heavy Water Market Size YoY Growth 2018-2029
- 9.2 Asia-Pacific Heavy Water Market Facts & Figures by Region
- 9.2.1 Asia-Pacific Heavy Water Sales by Region (2018-2029)
- 9.2.2 Asia-Pacific Heavy Water Revenue by Region (2018-2029)
- 9.3 Asia-Pacific Heavy Water Sales by Type (2018-2029)
- 9.4 Asia-Pacific Heavy Water Sales by Application (2018-2029)
10 Latin America
- 10.1 Latin America Heavy Water Market Size YoY Growth 2018-2029
- 10.2 Latin America Heavy Water Market Facts & Figures by Country
- 10.2.1 Latin America Heavy Water Sales by Country (2018-2029)
- 10.2.2 Latin America Heavy Water Revenue by Country (2018-2029)
- 10.3 Latin America Heavy Water Sales by Type (2018-2029)
- 10.4 Latin America Heavy Water Sales by Application (2018-2029)
11 Middle East and Africa
- 11.1 Latin America Heavy Water Market Size YoY Growth 2018-2029
- 11.2 Middle East and Africa Heavy Water Market Facts & Figures by Country
- 11.2.1 Middle East and Africa Heavy Water Sales by Country (2018-2029)
- 11.2.2 Middle East and Africa Heavy Water Revenue by Country (2018-2029)
- 11.3 Middle East and Africa Heavy Water Sales by Type (2018-2029)
- 11.4 Middle East and Africa Heavy Water Sales by Application (2018-2029)
12 Supply Chain and Sales Channel analysis
- 12.1 Heavy Water Supply Chain Analysis
- 12.2 Heavy Water Key Raw Materials and Upstream Suppliers
- 12.3 Heavy Water Production Mode & Process
- 12.3.1 Geib'-Spevack (GS) Process
- 12.3.2 Ammonia-hydrogen Exchange Process
- 12.4 Heavy Water Clients
- 12.5 Heavy Water Distributors
13 Heavy Water Market Dynamics
- 13.1 Heavy Water Industry Trends
- 13.2 Heavy Water Market Drivers
- 13.3 Heavy Water Market Challenges
14 Research Findings and Conclusion
15 Appendix
- 15.1 Research Methodology
- 15.1.1 Methodology/Research Approach
- 15.1.2 Data Source
- 15.2 Author Details
- 15.3 Disclaimer