|
|
市場調査レポート
商品コード
1492301
後天性希少血液疾患市場:世界の産業分析、規模、シェア、成長、動向、予測、2024~2032年Acquired Orphan Blood Disease Market: Global Industry Analysis, Size, Share, Growth, Trends, and Forecast, 2024-2032 |
||||||
|
|||||||
カスタマイズ可能
|
|||||||

| 後天性希少血液疾患市場:世界の産業分析、規模、シェア、成長、動向、予測、2024~2032年 |
|
出版日: 2024年05月24日
発行: Persistence Market Research
ページ情報: 英文 250 Pages
納期: 2~5営業日
|

全表示
- 概要
- 目次
この調査レポートは、世界の後天性希少血液疾患市場を詳細に分析・予測したPersistence Market Researchの市場調査報告書です。この包括的なレポートは、主要な市場力学、成長促進要因、課題、新興動向に関する貴重な洞察を提供します。本レポートでは、希少疾患治療薬市場における同セグメントの詳細な概観を提供し、2024年から2032年までの市場成長軌道を予測する独占データと統計を提示しています。
主要な洞察
- 後天性希少血液疾患の市場規模(2024年):96億米ドル
- 予測市場金額(2032年):215億米ドル
- 世界市場成長率(CAGR、2024~2032年まで):10.6%
後天性希少血液疾患市場:調査範囲
後天性希少血液疾患市場には、血液細胞の生産、機能、調節における後天的な異常を特徴とし、深刻な健康被害や生命を脅かす合併症を引き起こす様々な希少血液疾患が含まれます。これらの疾患には、後天性血友病、後天性再生不良性貧血、後天性血栓性血小板減少性紫斑病(TTP)、発作性夜間ヘモグロビン尿症(PNH)などが含まれます。これらの疾患は、個々にはまれな疾患であるものの、総体として世界中で相当数の患者が罹患しており、複雑な診断と治療の課題を提示しています。同市場は、製薬会社、バイオテクノロジー企業、学術研究機関、ヘルスケアプロバイダーにサービスを提供し、後天性希少血液疾患の管理のための新規治療、支持療法、診断ツールを提供しています。市場成長の促進力は、疾患に対する意識の高まり、精密医療の進歩、希少血液疾患をターゲットとした希少医薬品開発への投資の拡大です。
市場成長の促進要因:
世界の後天性希少血液疾患市場は、いくつかの主要な成長促進要因の恩恵を受けています。分子診断、遺伝子検査、バイオマーカー探索の進歩により、後天性血液疾患患者の疾患検出、鑑別診断、リスク層別化が改善され、個別化治療アプローチや標的介入を可能にしています。さらに、後天性希少疾病である血液疾患の基礎となる病態生理学や分子メカニズムに対する理解が深まり、新規治療標的の同定や、疾患管理のための革新的な生物学的製剤、低分子化合物、遺伝子治療薬の開発につながっています。さらに、規制上の優遇措置、希少疾病用医薬品の指定、市場独占権の規定によって、製薬会社は希少疾病の研究や医薬品開発に投資するインセンティブを与えられ、この分野における技術革新と市場開拓が推進されています。さらに、患者支援活動、臨床試験ネットワーク、共同研究コンソーシアムは、希少血液疾患の競合情勢において、疾患に対する認識を高め、早期診断を促進し、革新的な治療法への患者アクセスを加速する上で重要な役割を果たしています。
市場抑制要因:
有望な成長見通しにもかかわらず、後天性希少血液疾患市場は、疾患の不均一性、臨床試験デザイン、市場アクセスの障壁に関する課題に直面しています。後天性血液疾患の希少性と臨床的多様性は、臨床試験の募集、患者の層別化、データの解釈に課題をもたらし、患者コホートが小さく、統計的検出力に限界があり、治療の有効性と安全性の実証に課題があります。さらに、希少疾病用医薬品の研究開発、規制上の要件、償還の課題には高いコストがかかるため、製薬会社は、特に患者数が限られ、アンメットメディカルニーズのある疾患については、希少疾病の研究や医薬品の商業化に投資することを躊躇する可能性があります。さらに、集学的治療、支持療法、長期的なモニタリングの必要性など、疾病管理が複雑であるため、ヘルスケア資源に負担がかかり、専門的治療や革新的治療への患者のアクセスが制限される可能性があります。このような障壁に対処するには、医薬品開発経路の合理化、規制当局の審査プロセスの迅速化、希少疾病用医薬品や支持療法への患者アクセスの改善に向けて、業界利害関係者、規制当局、患者支援団体、医療提供者が協力して取り組む必要があります。
市場機会:
後天性希少血液疾患市場は、技術革新、研究の進歩、患者中心のケアモデルによって大きな成長機会がもたらされます。精密医療、標的治療、遺伝子編集などの新たな動向は、後天性希少血液疾患の疾患理解、治療の最適化、患者の転帰に新たな道を提供します。遺伝子置換、遺伝子編集、遺伝子サイレンシングアプローチなどの遺伝子ベースの治療法の開発は、後天性血友病やPNHなどの後天性血液疾患の根底にある遺伝子変異の治療に有望です。さらに、細胞療法、免疫療法、再生医療における進歩は、難治性または再発性疾患の患者に治癒の可能性を提供し、治療情勢を一変させ、競合情勢の厳しい希少血液疾患分野における長期的転帰を改善します。さらに、戦略的パートナーシップ、共同研究イニシアティブ、患者参加プログラムは、後天性希少血液疾患の進化する状況において、薬剤開発を加速し、技術革新を促進し、画期的な治療法への患者アクセスを強化するために不可欠です。
目次
第1章 エグゼクティブサマリー
第2章 市場概要
- 市場範囲 / 分類
- 市場の定義 / 範囲 / 制限
第3章 主要な市場動向
- 市場に影響を与える主要な動向
- 製品イノベーション / 開発動向
第4章 主要な成功要因
- 製品の採用 / 使用状況分析
- 製品のUSP / 特徴
- 戦略的プロモーション戦略
第5章 世界の後天性希少血液疾患市場の需要分析
- 過去の市場規模分析、2019~2023年
- 現在および将来の市場数量予測、2024~2032年
- 前年比成長動向分析
第6章 世界の後天性希少血液疾患市場 - 価格分析
- 地域別価格分析:治療法別
- 世界平均価格分析ベンチマーク
第7章 世界の後天性希少血液疾患市場の需要分析
- 過去の市場金額分析、2019~2023年
- 現在および将来の市場金額予測、2024~2032年
- 前年比成長動向分析
- 絶対額の機会分析
第8章 市場背景
- マクロ経済要因
- 予測要因 - 関連性と影響
- バリューチェーン
- COVID-19危機 - 影響評価
- 市場力学
第9章 世界の後天性希少血液疾患市場分析:治療法別
- イントロダクション / 主要な調査結果
- 過去の市場規模と数量分析:タイプ別、2019~2023年
- 現在および将来の市場規模と数量分析と予測:治療法別、2024~2032年
- 組み換え因子
- 免疫グロブリン輸液療法
- 活性化プロトロンビン複合体濃縮物
- トロンボポエチン受容体作動薬
- その他
- 市場魅力度分析:治療法別
第10章 世界の後天性希少血液疾患市場分析:疾患適応症別
- イントロダクション / 主要な調査結果
- 過去の市場規模と数量分析:疾患適応症別、2019~2023年
- 現在および将来の市場規模と数量分析と予測:疾患適応症別、2024~2032年
- 後天性無顆粒球症
- 後天性血友病
- 後天性フォン・ヴィレブランド症候群
- 発作性夜間血色素尿症(PNH)
- 骨髄異形成症候群
- その他
- 市場魅力度分析:疾患適応症別
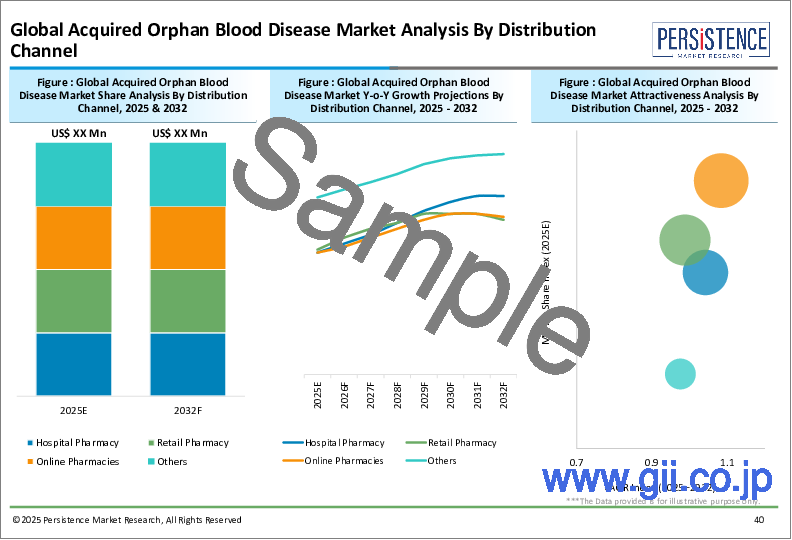
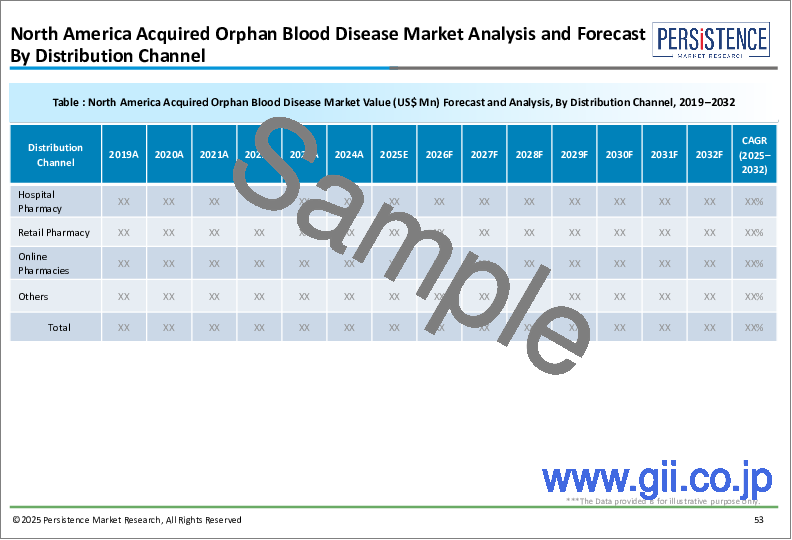
第11章 世界の後天性希少血液疾患市場分析:流通チャネル別
- イントロダクション / 主要な調査結果
- 過去の市場規模と数量分析:流通チャネル別、2019~2023年
- 現在および将来の市場規模と数量分析と予測:流通チャネル別、2024~2032年
- 病院薬局
- 小売薬局
- その他
- 市場魅力度分析:流通チャネル別
第12章 世界の後天性希少血液疾患市場分析:地域別
- イントロダクション
- 過去の市場規模と数量分析:地域別、2019~2023年
- 現在の市場規模と数量分析と予測:地域別、2024~2032年
- 北米
- ラテンアメリカ
- 欧州
- 東アジア
- 南アジア・太平洋
- 中東・アフリカ(MEA)
- 市場魅力度分析:地域別
第13章 北米の後天性希少血液疾患市場分析
第14章 ラテンアメリカの後天性希少血液疾患市場分析
第15章 欧州の後天性希少血液疾患市場分析
第16章 南アジア・太平洋の後天性希少血液疾患市場分析
第17章 東アジアの後天性希少血液疾患市場分析
第18章 中東・アフリカの後天性希少血液疾患市場分析
第19章 新興国の後天性希少血液疾患市場分析
- イントロダクション
- 市場金額割合分析:主要国別
- 世界 Vs. 国別の成長比較
- 米国の後天性希少血液疾患市場分析
- タイプ別
- 疾患別
- 流通チャネル別
- カナダの後天性希少血液疾患市場分析
- タイプ別
- 疾患別
- 流通チャネル別
- メキシコの後天性希少血液疾患市場分析
- タイプ別
- 疾患別
- 流通チャネル別
- ブラジルの後天性希少血液疾患市場分析
- タイプ別
- 疾患別
- 流通チャネル別
- ドイツの後天性希少血液疾患市場分析
- タイプ別
- 疾患別
- 流通チャネル別
- イタリアの後天性希少血液疾患市場分析
- タイプ別
- 疾患別
- 流通チャネル別
- フランスの後天性希少血液疾患市場分析
- タイプ別
- 疾患別
- 流通チャネル別
- 英国の後天性希少血液疾患市場分析
- タイプ別
- 疾患別
- 流通チャネル別
- スペインの後天性希少血液疾患市場分析
- タイプ別
- 疾患別
- 流通チャネル別
- ベネルクスの後天性希少血液疾患市場分析
- タイプ別
- 疾患別
- 流通チャネル別
- ロシアの後天性希少血液疾患市場分析
- タイプ別
- 疾患別
- 流通チャネル別
- 中国の後天性希少血液疾患市場分析
- タイプ別
- 疾患別
- 流通チャネル別
- 日本の後天性希少血液疾患市場分析
- タイプ別
- 疾患別
- 流通チャネル別
- 韓国の後天性希少血液疾患市場分析
- タイプ別
- 疾患別
- 流通チャネル別
- インドの後天性希少血液疾患市場分析
- タイプ別
- 疾患別
- 流通チャネル別
- ASEANの後天性希少血液疾患市場分析
- タイプ別
- 疾患別
- 流通チャネル別
- オーストラリア・ニュージーランドの後天性希少血液疾患市場分析
- タイプ別
- 疾患別
- 流通チャネル別
- GCC諸国の後天性希少血液疾患市場分析
- タイプ別
- 疾患別
- 流通チャネル別
- トルコの後天性希少血液疾患市場分析
- タイプ別
- 疾患別
- 流通チャネル別
- 北アフリカの後天性希少血液疾患市場分析
- タイプ別
- 疾患別
- 流通チャネル別
- 南アフリカの後天性希少血液疾患市場分析
- タイプ別
- 疾患別
- 流通チャネル別
第20章 市場構造分析
- 市場分析:企業階層別
- 主要企業の市場シェア分析
- 市場プレゼンス分析
第21章 競合分析
- 競合ダッシュボード
- 競合ベンチマーク
- 競合の詳細
- Alexion Pharmaceuticals, Inc.
- Amgen, Inc.
- Celgene Corporation
- Eli Lilly and Company
- Sanofi SA
- GlaxoSmithKline plc.
- Cyclacel Pharmaceuticals, Inc.
- Onconova Therapeutics, Inc.
- Incyte Corporation
- CTI BioPharma Corp.
第22章 使用される前提条件と頭字語
第23章 調査手法
Persistence Market Research, a leading market research firm, has conducted an in-depth analysis of the global Acquired Orphan Blood Disease Market. This comprehensive report provides valuable insights into key market dynamics, growth drivers, challenges, and emerging trends. It offers a detailed overview of the segment within the rare disease therapeutics market, presenting exclusive data and statistics projecting the market's growth trajectory from 2024 to 2032.
Key Insights:
- Acquired Orphan Blood Disease Market Size (2024): US$ 9.6 Bn
- Projected Market Value (2032):US$ 21.5 Bn
- Global Market Growth Rate (CAGR 2024 to 2032): 10.6%
Acquired Orphan Blood Disease Market - Report Scope:
The Acquired Orphan Blood Disease Market encompasses a range of rare hematologic disorders characterized by acquired abnormalities in blood cell production, function, or regulation, leading to serious health consequences and life-threatening complications. These diseases include acquired hemophilia, acquired aplastic anemia, acquired thrombotic thrombocytopenic purpura (TTP), and paroxysmal nocturnal hemoglobinuria (PNH), among others. While individually rare, these conditions collectively affect a significant number of patients worldwide, presenting complex diagnostic and therapeutic challenges. The market serves pharmaceutical companies, biotechnology firms, academic research institutions, and healthcare providers, offering novel therapies, supportive care measures, and diagnostic tools for the management of acquired orphan blood diseases. Market growth is driven by increasing disease awareness, advancements in precision medicine, and growing investment in orphan drug development targeting rare hematologic disorders.
Market Growth Drivers:
The global Acquired Orphan Blood Disease Market benefits from several key growth drivers. Advances in molecular diagnostics, genetic testing, and biomarker discovery have improved disease detection, differential diagnosis, and risk stratification in patients with acquired blood disorders, enabling personalized treatment approaches and targeted interventions. Moreover, growing understanding of the underlying pathophysiology and molecular mechanisms of acquired orphan blood diseases has led to the identification of novel therapeutic targets and the development of innovative biologic agents, small molecules, and gene therapies for disease management. Additionally, regulatory incentives, orphan drug designations, and market exclusivity provisions have incentivized pharmaceutical companies to invest in rare disease research and drug development, driving innovation and market expansion in the field. Furthermore, patient advocacy efforts, clinical trial networks, and collaborative research consortia play a critical role in raising disease awareness, promoting early diagnosis, and accelerating patient access to innovative therapies in the competitive landscape of rare hematologic disorders.
Market Restraints:
Despite its promising growth prospects, the Acquired Orphan Blood Disease Market faces challenges related to disease heterogeneity, clinical trial design, and market access barriers. The rarity and clinical variability of acquired blood disorders pose challenges for clinical trial recruitment, patient stratification, and data interpretation, leading to small patient cohorts, limited statistical power, and challenges in demonstrating treatment efficacy and safety. Moreover, the high cost of orphan drug development, regulatory requirements, and reimbursement challenges may deter pharmaceutical companies from investing in rare disease research and drug commercialization, particularly for conditions with limited patient populations and unmet medical needs. Additionally, the complexity of disease management, including the need for multidisciplinary care, supportive therapies, and long-term monitoring, may strain healthcare resources and limit patient access to specialized care and innovative treatments. Addressing these barriers requires collaborative efforts between industry stakeholders, regulatory agencies, patient advocacy groups, and healthcare providers to streamline drug development pathways, expedite regulatory review processes, and improve patient access to orphan drugs and supportive care services.
Market Opportunities:
The Acquired Orphan Blood Disease Market presents significant growth opportunities driven by technological innovations, research advancements, and patient-centered care models. Emerging trends such as precision medicine, targeted therapy, and gene editing offer new avenues for disease understanding, treatment optimization, and patient outcomes in acquired orphan blood disorders. The development of gene-based therapies, including gene replacement, gene editing, and gene silencing approaches, holds promise for the treatment of genetic mutations underlying acquired hematologic disorders, such as acquired hemophilia and PNH. Moreover, advancements in cell therapy, immunotherapy, and regenerative medicine offer potential curative options for patients with refractory or relapsed disease, transforming the treatment landscape and improving long-term outcomes in the competitive field of rare hematologic disorders. Furthermore, strategic partnerships, collaborative research initiatives, and patient engagement programs are essential to accelerate drug development, foster innovation, and enhance patient access to breakthrough therapies in the evolving landscape of acquired orphan blood diseases.
Competitive Intelligence and Business Strategy:
Leading players in the global Acquired Orphan Blood Disease Market, including pharmaceutical companies, biotechnology firms, and academic research institutions, focus on innovation, collaboration, and patient-centric approaches to drive market growth and improve clinical outcomes. These companies invest in research and development to identify novel therapeutic targets, develop innovative drug candidates, and advance precision medicine approaches tailored to individual patient needs and disease subtypes within the acquired orphan blood disorder spectrum. Moreover, strategic collaborations with key opinion leaders, patient advocacy groups, and regulatory agencies enable companies to leverage clinical expertise, patient insights, and regulatory guidance to optimize drug development strategies, expedite clinical trial recruitment, and navigate regulatory pathways for orphan drug approval. Additionally, emphasis on patient-centered care models, multidisciplinary collaboration, and real-world evidence generation enhances treatment outcomes, patient adherence, and quality of life in the competitive landscape of rare hematologic disorders.
Key Companies Profiled:
- Alexion Pharmaceuticals, Inc.
- Amgen, Inc.
- Celgene Corporation
- Eli Lilly and Company
- Sanofi S.A.
- GlaxoSmithKline plc.
- Cyclacel Pharmaceuticals, Inc.
- Onconova Therapeutics, Inc.
- Incyte Corporation
- CTI BioPharma Corp.
Acquired Orphan Blood Disease Market Research Segmentation:
By Therapy:
- Recombinant Factor
- Immunoglobulin Infusion Therapy
- Activated Prothrombin Complex Concentrate
- Thrombopoietin Receptor Agonists
- Others
By Disease Indication:
- Acquired Agranulocytosis
- Acquired Hemophilia
- Acquired Von Willebrand Syndrome
- Paroxysmal Nocturnal Hemoglobinuria (PNH)
- Myelodysplastic Syndrome
- Other
By Distribution Channel:
- Hospital Pharmacy
- Retail Pharmacy
- Others
By Region:
- North America
- Europe
- Latin America
- East Asia
- The Middle East & Africa
- South Asia & Pacific
Table of Contents
1. Executive Summary
- 1.1. Global Market Outlook
- 1.2. Demand Side Trends
- 1.3. Supply Side Trends
- 1.4. Technology Roadmap
- 1.5. Analysis and Recommendations
2. Market Overview
- 2.1. Market Coverage / Taxonomy
- 2.2. Market Definition / Scope / Limitations
3. Key Market Trends
- 3.1. Key Trends Impacting the Market
- 3.2. Product Innovation / Development Trends
4. Key Success Factors
- 4.1. Product Adoption / Usage Analysis
- 4.2. Product USPs / Features
- 4.3. Strategic Promotional Strategies
5. Global Acquired Orphan Blood Disease Market Demand Analysis 2019-2023 and Forecast, 2024-2032
- 5.1. Historical Market Volume (Tons) Analysis, 2019-2023
- 5.2. Current and Future Market Volume (Tons) Projections, 2024-2032
- 5.3. Y-o-Y Growth Trend Analysis
6. Global Acquired Orphan Blood Disease Market - Pricing Analysis
- 6.1. Regional Pricing Analysis By Therapy
- 6.2. Global Average Pricing Analysis Benchmark
7. Global Acquired Orphan Blood Disease Market Demand (in Value or Size in US$ Bn) Analysis 2019-2023 and Forecast, 2024-2032
- 7.1. Historical Market Value (US$ Bn) Analysis, 2019-2023
- 7.2. Current and Future Market Value (US$ Bn) Projections, 2024-2032
- 7.2.1. Y-o-Y Growth Trend Analysis
- 7.2.2. Absolute $ Opportunity Analysis
8. Market Background
- 8.1. Macro-Economic Factors
- 8.1.1. Global GDP Growth Outlook
- 8.1.2. Global Industry Value Added Overview
- 8.1.3. Global Infrastructure Investment Overview
- 8.1.4. Global Construction Spending Analysis
- 8.1.5. Other Macro Economic Factors
- 8.2. Forecast Factors - Relevance & Impact
- 8.2.1. Top Companies Historical Growth
- 8.2.2. GDP Growth forecast
- 8.2.3. Construction Industry forecast
- 8.2.4. Distribution Channel Growth Outlook
- 8.2.5. Collaboration Activities
- 8.3. Value Chain
- 8.3.1. Raw Material Suppliers
- 8.3.2. List of Manufacturers
- 8.3.3. List of Distributors
- 8.4. COVID-19 Crisis - Impact Assessment
- 8.4.1. Current Statistics
- 8.4.2. Short-Mid-Long Term Outlook
- 8.4.3. Likely Rebound
- 8.5. Market Dynamics
- 8.5.1. Drivers
- 8.5.2. Restraints
- 8.5.3. Opportunity Analysis
- 8.5.4. Trends
9. Global Acquired Orphan Blood Disease Market Analysis 2019-2023 and Forecast 2024-2032, by Therapy
- 9.1. Introduction / Key Findings
- 9.2. Historical Market Size (US$ Bn) and Volume Analysis by Type, 2019-2023
- 9.3. Current and Future Market Size (US$ Bn) and Volume Analysis and Forecast by Therapy 2024-2032
- 9.3.1. Recombinant Factor
- 9.3.2. Immunoglobulin Infusion Therapy
- 9.3.3. Activated Prothrombin Complex Concentrate
- 9.3.4. Thrombopoietin Receptor Agonists
- 9.3.5. Others
- 9.4. Market Attractiveness Analysis by Therapy
10. Global Acquired Orphan Blood Disease Market Analysis 2019-2023 and Forecast 2024-2032, By Disease Indication
- 10.1. Introduction / Key Findings
- 10.2. Historical Market Size (US$ Bn) and Volume Analysis By Disease Indication, 2019-2023
- 10.3. Current and Future Market Size (US$ Bn) and Volume Analysis and Forecast By Disease Indication, 2024-2032
- 10.3.1. Acquired Agranulocytosis
- 10.3.2. Acquired Hemophilia
- 10.3.3. Acquired Von Willebrand Syndrome
- 10.3.4. Paroxysmal Nocturnal Hemoglobinuria (PNH)
- 10.3.5. Myelodysplastic Syndrome
- 10.3.6. Others
- 10.4. Market Attractiveness Analysis By Disease Indication
11. Global Acquired Orphan Blood Disease Market Analysis 2019-2023 and Forecast 2024-2032, By Distribution Channel
- 11.1. Introduction / Key Findings
- 11.2. Historical Market Size (US$ Bn) and Volume Analysis By Distribution Channel, 2019-2023
- 11.3. Current and Future Market Size (US$ Bn) and Volume Analysis and Forecast By Distribution Channel 2024-2032
- 11.3.1. Hospital Pharmacy
- 11.3.2. Retail Pharmacy
- 11.3.3. Others
- 11.4. Market Attractiveness Analysis By Distribution Channel
12. Global Acquired Orphan Blood Disease Market Analysis 2019-2023 and Forecast 2024-2032, by Region
- 12.1. Introduction
- 12.2. Historical Market Size (US$ Bn) and Volume Analysis by Region, 2019-2023
- 12.3. Current Market Size (US$ Bn) and Volume Analysis and Forecast by Region, 2024-2032
- 12.3.1. North America
- 12.3.2. Latin America
- 12.3.3. Europe
- 12.3.4. East Asia
- 12.3.5. South Asia and Pacific
- 12.3.6. Middle East and Africa (MEA)
- 12.4. Market Attractiveness Analysis By Region
13. North America Acquired Orphan Blood Disease Market Analysis 2019-2023 and Forecast 2024-2032
- 13.1. Introduction
- 13.2. Pricing Analysis
- 13.3. Historical Market Size (US$ Bn) and Volume Trend Analysis by Market Taxonomy, 2019-2023
- 13.4. Market Size (US$ Bn) and Volume Forecast by Market Taxonomy, 2024-2032
- 13.4.1. By Country
- 13.4.1.1. U.S.
- 13.4.1.2. Canada
- 13.4.2. By Type
- 13.4.3. By Disease Indication
- 13.4.4. By Distribution Channel
- 13.4.1. By Country
- 13.5. Market Attractiveness Analysis
- 13.5.1. By Country
- 13.5.2. By Type
- 13.5.3. By Disease Indication
- 13.5.4. By Distribution Channel
- 13.6. Market Trends
- 13.7. Key Market Participants - Intensity Mapping
- 13.8. Drivers and Restraints - Impact Analysis
14. Latin America Acquired Orphan Blood Disease Market Analysis 2019-2023 and Forecast 2024-2032
- 14.1. Introduction
- 14.2. Pricing Analysis
- 14.3. Historical Market Size (US$ Bn) and Volume Trend Analysis by Market Taxonomy, 2019-2023
- 14.4. Market Size (US$ Bn) and Volume Forecast by Market Taxonomy, 2024-2032
- 14.4.1. By Country
- 14.4.1.1. Brazil
- 14.4.1.2. Mexico
- 14.4.1.3. Rest of Latin America
- 14.4.2. By Type
- 14.4.3. By Disease Indication
- 14.4.4. By Distribution Channel
- 14.4.1. By Country
- 14.5. Market Attractiveness Analysis
- 14.5.1. By Country
- 14.5.2. By Type
- 14.5.3. By Disease Indication
- 14.5.4. By Distribution Channel
- 14.6. Market Trends
- 14.7. Key Market Participants - Intensity Mapping
- 14.8. Drivers and Restraints - Impact Analysis
15. Europe Acquired Orphan Blood Disease Market Analysis 2019-2023 and Forecast 2024-2032
- 15.1. Introduction
- 15.2. Pricing Analysis
- 15.3. Historical Market Size (US$ Bn) and Volume Trend Analysis by Market Taxonomy, 2019-2023
- 15.4. Market Size (US$ Bn) and Volume Forecast by Market Taxonomy, 2024-2032
- 15.4.1. By Country
- 15.4.1.1. Germany
- 15.4.1.2. Italy
- 15.4.1.3. France
- 15.4.1.4. U.K.
- 15.4.1.5. Spain
- 15.4.1.6. BENELUX
- 15.4.1.7. Russia
- 15.4.1.8. Rest of Europe
- 15.4.2. By Type
- 15.4.3. By Disease Indication
- 15.4.4. By Distribution Channel
- 15.4.1. By Country
- 15.5. Market Attractiveness Analysis
- 15.5.1. By Country
- 15.5.2. By Type
- 15.5.3. By Disease Indication
- 15.5.4. By Distribution Channel
- 15.6. Market Trends
- 15.7. Key Market Participants - Intensity Mapping
- 15.8. Drivers and Restraints - Impact Analysis
16. South Asia and Pacific Acquired Orphan Blood Disease Market Analysis 2019-2023 and Forecast 2024-2032
- 16.1. Introduction
- 16.2. Pricing Analysis
- 16.3. Historical Market Size (US$ Bn) and Volume Trend Analysis by Market Taxonomy, 2019-2023
- 16.4. Market Size (US$ Bn) and Volume Forecast by Market Taxonomy, 2024-2032
- 16.4.1. By Country
- 16.4.1.1. India
- 16.4.1.2. ASEAN
- 16.4.1.3. Oceania
- 16.4.1.4. Rest of South Asia & Pacific
- 16.4.2. By Type
- 16.4.3. By Disease Indication
- 16.4.4. By Distribution Channel
- 16.4.1. By Country
- 16.5. Market Attractiveness Analysis
- 16.5.1. By Country
- 16.5.2. By Type
- 16.5.3. By Disease Indication
- 16.5.4. By Distribution Channel
- 16.6. Market Trends
- 16.7. Key Market Participants - Intensity Mapping
- 16.8. Drivers and Restraints - Impact Analysis
17. East Asia Acquired Orphan Blood Disease Market Analysis 2019-2023 and Forecast 2024-2032
- 17.1. Introduction
- 17.2. Pricing Analysis
- 17.3. Historical Market Size (US$ Bn) and Volume Trend Analysis by Market Taxonomy, 2019-2023
- 17.4. Market Size (US$ Bn) and Volume Forecast by Market Taxonomy, 2024-2032
- 17.4.1. By Country
- 17.4.1.1. China
- 17.4.1.2. Japan
- 17.4.1.3. South Korea
- 17.4.2. By Type
- 17.4.3. By Disease Indication
- 17.4.4. By Distribution Channel
- 17.4.1. By Country
- 17.5. Market Attractiveness Analysis
- 17.5.1. By Country
- 17.5.2. By Type
- 17.5.3. By Disease Indication
- 17.5.4. By Distribution Channel
- 17.6. Market Trends
- 17.7. Key Market Participants - Intensity Mapping
- 17.8. Drivers and Restraints - Impact Analysis
18. Middle East and Africa Acquired Orphan Blood Disease Market Analysis 2019-2023 and Forecast 2024-2032
- 18.1. Introduction
- 18.2. Pricing Analysis
- 18.3. Historical Market Size (US$ Bn) and Volume Trend Analysis by Market Taxonomy, 2019-2023
- 18.4. Market Size (US$ Bn) and Volume Forecast by Market Taxonomy, 2024-2032
- 18.4.1. By Country
- 18.4.1.1. GCC Countries
- 18.4.1.2. Turkey
- 18.4.1.3. Northern Africa
- 18.4.1.4. South Africa
- 18.4.1.5. Rest of Middle East and Africa
- 18.4.2. By Type
- 18.4.3. By Disease Indication
- 18.4.4. By Distribution Channel
- 18.4.1. By Country
- 18.5. Market Attractiveness Analysis
- 18.5.1. By Country
- 18.5.2. By Type
- 18.5.3. By Disease Indication
- 18.5.4. By Distribution Channel
- 18.6. Market Trends
- 18.7. Key Market Participants - Intensity Mapping
- 18.8. Drivers and Restraints - Impact Analysis
19. Emerging Countries Acquired Orphan Blood Disease Market Analysis
- 19.1. Introduction
- 19.1.1. Market Value Proportion Analysis, By Key Countries
- 19.1.2. Global Vs. Country Growth Comparison
- 19.2. U.S. Acquired Orphan Blood Disease Market Analysis
- 19.2.1. By Type
- 19.2.2. By Disease Indication
- 19.2.3. By Distribution Channel
- 19.3. Canada Acquired Orphan Blood Disease Market Analysis
- 19.3.1. By Type
- 19.3.2. By Disease Indication
- 19.3.3. By Distribution Channel
- 19.4. Mexico Acquired Orphan Blood Disease Market Analysis
- 19.4.1. By Type
- 19.4.2. By Disease Indication
- 19.4.3. By Distribution Channel
- 19.5. Brazil Acquired Orphan Blood Disease Market Analysis
- 19.5.1. By Type
- 19.5.2. By Disease Indication
- 19.5.3. By Distribution Channel
- 19.6. Germany Acquired Orphan Blood Disease Market Analysis
- 19.6.1. By Type
- 19.6.2. By Disease Indication
- 19.6.3. By Distribution Channel
- 19.7. Italy Acquired Orphan Blood Disease Market Analysis
- 19.7.1. By Type
- 19.7.2. By Disease Indication
- 19.7.3. By Distribution Channel
- 19.8. France Acquired Orphan Blood Disease Market Analysis
- 19.8.1. By Type
- 19.8.2. By Disease Indication
- 19.8.3. By Distribution Channel
- 19.9. U.K. Acquired Orphan Blood Disease Market Analysis
- 19.9.1. By Type
- 19.9.2. By Disease Indication
- 19.9.3. By Distribution Channel
- 19.10. Spain Acquired Orphan Blood Disease Market Analysis
- 19.10.1. By Type
- 19.10.2. By Disease Indication
- 19.10.3. By Distribution Channel
- 19.11. BENELUX Acquired Orphan Blood Disease Market Analysis
- 19.11.1. By Type
- 19.11.2. By Disease Indication
- 19.11.3. By Distribution Channel
- 19.12. Russia Acquired Orphan Blood Disease Market Analysis
- 19.12.1. By Type
- 19.12.2. By Disease Indication
- 19.12.3. By Distribution Channel
- 19.13. China Acquired Orphan Blood Disease Market Analysis
- 19.13.1. By Type
- 19.13.2. By Disease Indication
- 19.13.3. By Distribution Channel
- 19.14. Japan Acquired Orphan Blood Disease Market Analysis
- 19.14.1. By Type
- 19.14.2. By Disease Indication
- 19.14.3. By Distribution Channel
- 19.15. S. Korea Acquired Orphan Blood Disease Market Analysis
- 19.15.1. By Type
- 19.15.2. By Disease Indication
- 19.15.3. By Distribution Channel
- 19.16. India Acquired Orphan Blood Disease Market Analysis
- 19.16.1. By Type
- 19.16.2. By Disease Indication
- 19.16.3. By Distribution Channel
- 19.17. ASEAN Acquired Orphan Blood Disease Market Analysis
- 19.17.1. By Type
- 19.17.2. By Disease Indication
- 19.17.3. By Distribution Channel
- 19.18. Australia and New Zealand Acquired Orphan Blood Disease Market Analysis
- 19.18.1. By Type
- 19.18.2. By Disease Indication
- 19.18.3. By Distribution Channel
- 19.19. GCC Countries Acquired Orphan Blood Disease Market Analysis
- 19.19.1. By Type
- 19.19.2. By Disease Indication
- 19.19.3. By Distribution Channel
- 19.20. Turkey Acquired Orphan Blood Disease Market Analysis
- 19.20.1. By Type
- 19.20.2. By Disease Indication
- 19.20.3. By Distribution Channel
- 19.21. Northern Africa Acquired Orphan Blood Disease Market Analysis
- 19.21.1. By Type
- 19.21.2. By Disease Indication
- 19.21.3. By Distribution Channel
- 19.22. South Africa Acquired Orphan Blood Disease Market Analysis
- 19.22.1. By Type
- 19.22.2. By Disease Indication
- 19.22.3. By Distribution Channel
20. Market Structure Analysis
- 20.1. Market Analysis by Tier of Companies (Linear Alpha-Olefins)
- 20.2. Market Share Analysis of Top Players
- 20.3. Market Presence Analysis
21. Competition Analysis
- 21.1. Competition Dashboard
- 21.2. Competition Benchmarking
- 21.3. Competition Deep Dive
- 21.3.1. Alexion Pharmaceuticals, Inc.
- 21.3.1.1. Overview
- 21.3.1.2. Product Portfolio
- 21.3.1.3. Profitability by Market Segments (Product/Channel/Region)
- 21.3.1.4. Sales Footprint
- 21.3.1.5. Strategy Overview
- 21.3.2. Amgen, Inc.
- 21.3.2.1. Overview
- 21.3.2.2. Product Portfolio
- 21.3.2.3. Profitability by Market Segments (Product/Channel/Region)
- 21.3.2.4. Sales Footprint
- 21.3.2.5. Strategy Overview
- 21.3.3. Celgene Corporation
- 21.3.3.1. Overview
- 21.3.3.2. Product Portfolio
- 21.3.3.3. Profitability by Market Segments (Product/Channel/Region)
- 21.3.3.4. Sales Footprint
- 21.3.3.5. Strategy Overview
- 21.3.4. Eli Lilly and Company
- 21.3.4.1. Overview
- 21.3.4.2. Product Portfolio
- 21.3.4.3. Profitability by Market Segments (Product/Channel/Region)
- 21.3.4.4. Sales Footprint
- 21.3.4.5. Strategy Overview
- 21.3.5. Sanofi S.A.
- 21.3.5.1. Overview
- 21.3.5.2. Product Portfolio
- 21.3.5.3. Profitability by Market Segments (Product/Channel/Region)
- 21.3.5.4. Sales Footprint
- 21.3.5.5. Strategy Overview
- 21.3.6. GlaxoSmithKline plc.
- 21.3.6.1. Overview
- 21.3.6.2. Product Portfolio
- 21.3.6.3. Profitability by Market Segments (Product/Channel/Region)
- 21.3.6.4. Sales Footprint
- 21.3.6.5. Strategy Overview
- 21.3.7. Cyclacel Pharmaceuticals, Inc.
- 21.3.7.1. Overview
- 21.3.7.2. Product Portfolio
- 21.3.7.3. Profitability by Market Segments (Product/Channel/Region)
- 21.3.7.4. Sales Footprint
- 21.3.7.5. Strategy Overview
- 21.3.8. Onconova Therapeutics, Inc.
- 21.3.8.1. Overview
- 21.3.8.2. Product Portfolio
- 21.3.8.3. Profitability by Market Segments (Product/Channel/Region)
- 21.3.8.4. Sales Footprint
- 21.3.8.5. Strategy Overview
- 21.3.9. Incyte Corporation
- 21.3.9.1. Overview
- 21.3.9.2. Product Portfolio
- 21.3.9.3. Profitability by Market Segments (Product/Channel/Region)
- 21.3.9.4. Sales Footprint
- 21.3.9.5. Strategy Overview
- 21.3.10. CTI BioPharma Corp.
- 21.3.10.1. Overview
- 21.3.10.2. Product Portfolio
- 21.3.10.3. Profitability by Market Segments (Product/Channel/Region)
- 21.3.10.4. Sales Footprint
- 21.3.10.5. Strategy Overview
- 21.3.1. Alexion Pharmaceuticals, Inc.

