
|
市場調査レポート
商品コード
1906884
バイオ農薬:市場シェア分析、業界動向と統計、成長予測(2026年~2031年)Biopesticides - Market Share Analysis, Industry Trends & Statistics, Growth Forecasts (2026 - 2031) |
||||||
カスタマイズ可能
適宜更新あり
|
|||||||
| バイオ農薬:市場シェア分析、業界動向と統計、成長予測(2026年~2031年) |
|
出版日: 2026年01月12日
発行: Mordor Intelligence
ページ情報: 英文 120 Pages
納期: 2~3営業日
|

概要
2026年のバイオ農薬の市場規模は74億3,000万米ドルと推定され、2025年の67億2,000万米ドルから成長し、2031年には122億8,000万米ドルに達すると予測されています。
2026年から2031年にかけての年間平均成長率(CAGR)は10.58%となる見込みです。
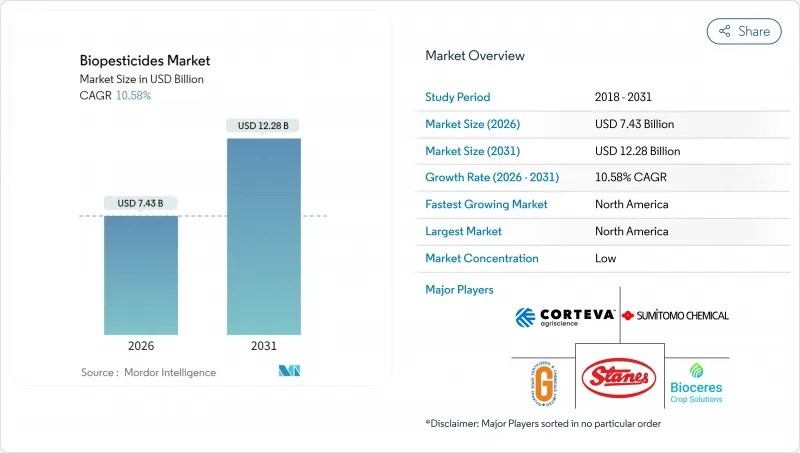
合成化学物質に対する規制当局の監視強化、有機農地の急速な拡大、発酵サービスプラットフォームの台頭が相まって、微生物ベースのソリューションの商業化が加速しています。ブラジルでは2024年12月に施行される統一バイオインプット法により、生物学的製品の承認期間が短縮され、他の新興市場もこれに追随し始めています。一方、北米の生産者は、成熟した制御環境農業インフラと、改革された米国調整枠組み(USCF)に基づく効率化された審査プロセスにより、世界の導入をリードしています。特に鱗翅目害虫における殺虫剤耐性の深刻化は、畑作作物と園芸作物の生産者の双方を、既存の化学農薬を補完する生物学的作用機序へと向かわせています。
世界のバイオ農薬市場の動向と洞察
合成農薬に対する世界の規制強化
欧州連合(EU)の「農場から食卓まで」戦略は、2030年までに化学農薬使用量を50%削減することを目標としており、バイオ農薬への顕著な代替効果をもたらしています。これと相まって、米国環境保護庁(EPA)は2024年に複数の有機リン系農薬の登録を取消し、調査対象となった畑作農家の87%においてバイオ農薬への関心を高めました。ブラジルではバイオ農薬の承認プロセスが合理化され、合成農薬と比較して大幅に時間を短縮。これによりバイオ農薬メーカーは遅延コストの優位性を獲得しました。タイをはじめとする東南アジア諸国も同様の政策を策定中であり、規制強化の動きが世界的に広がっていることを示しています。主要輸出作物において残留基準遵守は現実的なビジネスリスクとなっており、買い手は供給業者に対し合成化学物質への依存度低減を強く求めています。
有機農地面積の拡大
主要生産地域における年間成長率の安定化を背景に、認証有機農地は着実に増加しています。有機認証では合成資材の使用が禁止されるため、バイオ農薬がこれらのシステムにおける主要な害虫管理手段となり、バイオ農薬ベンダーにとって安定した収益基盤を形成しています。有機製品に伴うプレミアム小売価格により、生産者はヘクタール当たりの処理コスト上昇を管理しつつ収益性を維持することが可能となります。有機サプライチェーン内での制御環境農業(CEA)の拡大も需要をさらに押し上げています。屋内農場では、残留物ゼロのブランド要件を満たすため、最初から生物的防除を採用しているからです。さらに、地域有機研究センターへの投資が生物学的製品の普及支援を強化し、採用への信頼を高めています。
合成農薬とのコスト比較
バイオ農薬のヘクタール当たりの処理コストは、従来型製品と比べて依然として2~3倍高く、主な要因は有効成分濃度の低さと散布サイクルの頻度増加にあります。アフリカやアジアの一部地域における汎用作物生産者は、プレミアム輸出ルートでコストを賄える場合でも、高価な資材への投資を躊躇しがちです。抵抗性管理や残留検査のコスト削減を考慮した経済モデルでは価格差を一部相殺できますが、こうした分析は普及支援ネットワークを通じてまだ広く普及していません。現在、いくつかの政府が価格差を埋めるため直接的な投入資材補助を提供していますが、プログラムの範囲は依然として限定的です。
セグメント分析
バイオ農薬市場規模において、生物殺菌剤は2025年の収益の46.92%を占め、引き続き中核をなしております。これは穀物、果樹、保護栽培野菜においてバチルス菌やトリコデルマ菌株の実証済みの圃場性能を反映したものです。水和剤や油分散剤の製剤技術革新により保存安定性が向上し、温暖気候地域での普及を支えております。本セグメントの幅広い有用性が流通業者の信頼を築き、小売チャネルにおける棚割拡大を促進しております。生物殺虫剤は現在のシェアでは後塵を拝していますが、11.86%のCAGRで成長し、他のカテゴリーを上回る見込みです。生産者が鱗翅目害虫の抵抗性に対抗する新たな作用機序を求める中、採用が進んでいます。最近の規制当局への申請状況では、2024年に生物殺虫剤の申請書類が35%増加しており、予測期間中に選択肢を拡大するパイプラインが供給される見通しです。
第二世代バイオ除草剤は依然としてニッチ市場ですが、企業が新規微生物分離株と宿主特異性を高める補助剤を組み合わせることで商業的勢いを見せています。作付面積の限定により生産量は小規模ながら、除草剤耐性雑草に対する差別化された解決策を提供するため、ベンチャーキャピタルの注目を集めています。その他のバイオ農薬(殺線虫剤や殺貝剤など)は、収量維持のため高い投入コストが正当化される高付加価値の特殊作物を対象としています。これらの多様な形態が相まって、バイオ農薬市場の技術的範囲の拡大を示しています。
本「バイオ農薬市場レポート」は、形態別(生物殺菌剤、生物除草剤、生物殺虫剤など)、作物タイプ別(換金作物、園芸作物など)、地域別(アフリカ、アジア太平洋、欧州、中東、北米など)に分類されています。市場予測は、金額(米ドル)および数量(メトリックトン)で提供されます。
地域別分析
CAGRとは、CAGRのことで、CAGRは12.05%でした。北米地域は2025年に39.12%の収益シェアを維持し、地域別で最も高いCAGRを記録しました。これは同地域がバイオ農薬市場において最大かつ最も成長が速い地域であるという二重の地位を裏付けるものです。米国環境保護庁(EPA)の審査効率化、州レベルの奨励プログラム、残留物ゼロ調達への小売業者の強い取り組みが相まって、導入が加速しています。米国のCEA(制御環境農業)事業では、葉物野菜、トマト、イチゴにおける生物的害虫駆除が統合され、安定した需要基盤を提供しています。カナダの有機農地拡大とメキシコの輸出志向型園芸が、地域での利用をさらに拡大しています。
欧州は欧州連合の「農場から食卓まで」戦略に後押しされ、これに続きます。欧州の生物的防除市場は著しく成長し、作物保護剤総売上高の顕著な割合を占めています。厳格な承認プロセスは数年を要するため製品更新は遅れますが、高品質なデータパッケージを確保し生産者の信頼を強化しています。北部の加盟国では穀物における残留低減が重視される一方、地中海地域では園芸・ブドウ栽培で生物的防除剤が広く活用されています。
南米は最もダイナミックな成長を見せており、ブラジル市場の拡大と生物資材承認を統一する有利な規制改革が牽引役です。ブラジルの生産者の多くが日常的な生物資材使用を報告するようになり、年間市場拡大率は世界平均を大きく上回っています。アルゼンチンの同等性承認とチリの公的研究資金が地域の勢いをさらに加速させています。アジア太平洋地域では、有機農地の拡大と政府の持続可能性義務付けに連動した強い潜在力を示していますが、規制のタイムラインのばらつきや技術普及の限界により進展は断片的です。中東・アフリカは初期段階の市場であり、ドナー資金によるプログラムや多国籍企業による実証事業が将来の需要の種を蒔いています。
その他の特典:
- エクセル形式の市場予測(ME)シート
- アナリストによる3ヶ月間のサポート
よくあるご質問
目次
第1章 イントロダクション
- 調査の前提条件と市場の定義
- 調査範囲
- 調査手法
第2章 レポート提供
第3章 エグゼクティブサマリーおよび主要な調査結果
第4章 主要な業界動向
- 有機栽培面積
- 有機製品への一人当たり支出額
- 規制の枠組み
- アルゼンチン
- オーストラリア
- ブラジル
- カナダ
- 中国
- エジプト
- フランス
- ドイツ
- インド
- インドネシア
- イラン
- イタリア
- 日本
- メキシコ
- オランダ
- ナイジェリア
- フィリピン
- ロシア
- 南アフリカ
- スペイン
- タイ
- トルコ
- 英国
- 米国
- ベトナム
- バリューチェーンおよび流通チャネル分析
- 市場促進要因
- 合成農薬に対する世界の規制強化
- 有機農業の作付面積拡大
- 従来型化学農薬に対する耐性の高まり
- 政府によるバイオ農薬の奨励策と迅速承認制度
- 制御環境農業(CEA)の成長
- Fermentation-as-a-serviceによるスケールアップ障壁の低減
- 市場抑制要因
- 合成農薬と比較した高コスト
- 保存期間が短く、コールドチェーンへの依存度が高め
- 微生物生産における原料価格の変動性
- 統一された圃場性能KPIの欠如
第5章 市場規模と成長予測(金額と数量)
- 形態別
- バイオ殺菌剤
- バイオ除草剤
- バイオ農薬
- その他バイオ農薬
- 作物タイプ別
- 換金作物
- 園芸作物
- 畑作作物
- 地域別
- アフリカ
- 国別
- エジプト
- ナイジェリア
- 南アフリカ
- その他アフリカ
- 国別
- アジア太平洋地域
- 国別
- オーストラリア
- 中国
- インド
- インドネシア
- 日本
- フィリピン
- タイ
- ベトナム
- その他アジア太平洋地域
- 国別
- 欧州
- 国別
- フランス
- ドイツ
- イタリア
- オランダ
- ロシア
- スペイン
- トルコ
- 英国
- その他欧州地域
- 国別
- 中東
- 国別
- イラン
- サウジアラビア
- その他中東
- 国別
- 北米
- 国別
- カナダ
- メキシコ
- 米国
- その他北米地域
- 国別
- 南米
- 国別
- アルゼンチン
- ブラジル
- その他南米
- 国別
- アフリカ
第6章 競合情勢
- 主要な戦略的動きs
- 市場シェア分析
- 企業概要
- 企業プロファイル
- Bayer AG
- BASF SE
- Syngenta Group
- Corteva Agriscience
- FMC Corporation
- Valent BioSciences LLC(Sumitomo Chemical Co., Ltd.)
- Certis USA LLC(Mitsui and Co., Ltd.)
- Koppert B.V.
- Andermatt Group AG
- Marrone Bio Innovations Inc.(Bioceres Crop Solutions Corp.)
- Seipasa SA
- T.Stanes and Company Limited
- UPL Ltd.
- Atlantica Agricola
- Gujarat State Fertilizers and Chemicals Ltd.

