|
|
市場調査レポート
商品コード
1415818
油浸変圧器の世界市場:設置場所別(パッドマウント、ポールマウント、変電所)、電圧別(低、中、高)、相別、エンドユーザー別(産業、住宅・商業、公共事業)、地域別-2028年までの予測Oil Immersed Power Transformer Market by Installation (Pad-Mounted, Pole-Mounted, Substation Installation), Voltage (Low, Medium, High), Phase, End User (Industrial, Residential & Commercial, Utilities) and Region - Global Forecast to 2028 |
||||||
|
|
|||||||
|
● お客様のご希望に応じて、既存データの加工や未掲載情報(例:国別セグメント)の追加などの対応が可能です。 詳細はお問い合わせください。 |
|||||||


| 油浸変圧器の世界市場:設置場所別(パッドマウント、ポールマウント、変電所)、電圧別(低、中、高)、相別、エンドユーザー別(産業、住宅・商業、公共事業)、地域別-2028年までの予測 |
|
出版日: 2024年01月18日
発行: MarketsandMarkets
ページ情報: 英文 239 Pages
納期: 即納可能
|
- 全表示
- 概要
- 目次
| 調査範囲 | |
|---|---|
| 調査対象年 | 2021年~2028年 |
| 基準年 | 2022年 |
| 予測期間 | 2023年~2028年 |
| 検討単位 | 金額(10億米ドル) |
| セグメント別 | 設置場所別、相別、電圧別、エンドユーザー別 |
| 対象地域 | アジア太平洋、北米、欧州、中東・アフリカ、南米 |
世界の油浸変圧器の市場規模は大幅な成長を遂げ、2028年には283億米ドルに達すると予測されています。
これは、2023年の212億米ドルからの顕著な増加であり、2023年から2028年までの期間における6.0%の安定した年間平均成長率(CAGR)を反映しています。この堅調な成長にはいくつかの要因が寄与していますが、中でも重要な推進力は、近年見られる世界のエネルギー需要の急増であり、これが電力消費急増の主な促進要因となっています。エネルギー需要の急増はさまざまな部門によって促進されており、中でも産業部門は油浸変圧器へのニーズが高まっている主な要因となっています。産業部門の大幅な貢献は、工業化、製造活動、多様な地域におけるインフラ整備の増加に起因しています。産業が拡大し近代化するにつれて、油浸変圧器が重要な構成要素である効率的で信頼性の高い配電システムに対する需要も相応に増加します。産業部門にとどまらず、油浸変圧器の需要増に大きく貢献しているのは、商業、サービス、住宅部門です。商業部門は、さまざまな事業や企業を包含し、操業を支えるために安定的かつ継続的な電力供給に大きく依存しています。ヘルスケア、教育、ホスピタリティを含むサービス部門も、電力需要の増加に貢献しています。さらに、人口増加と都市化に牽引される住宅部門では、家庭や地域社会への信頼性の高い配電が必要とされています。
油浸変圧器は、効果的な冷却と絶縁を提供する能力とともに、電圧レベルを効率的に昇圧または降圧するという戦略的役割を果たすため、配電および送電システムにおいて不可欠なコンポーネントとして位置づけられています。変圧器は、電力網の信頼性と安定性を維持し、経済のさまざまな部門にシームレスな電気の流れを確保する上で重要な役割を果たしています。世界のエネルギー事情が進化するにつれ、再生可能エネルギー源の統合、スマートグリッド技術の進歩、エネルギー効率の重視といった要因が、油浸変圧器の需要にさらに影響を及ぼすと予想されます。さらに、さまざまな地域で老朽化した電力インフラの近代化とアップグレードが重視されるようになっていることも、市場の持続的成長に寄与しています。
当レポートでは、世界の油浸変圧器市場について調査し、設置場所別、相別、電圧別、エンドユーザー別、地域別動向、および市場に参入する企業のプロファイルなどをまとめています。
目次
第1章 イントロダクション
第2章 調査手法
第3章 エグゼクティブサマリー
第4章 重要考察
第5章 市場概要
- イントロダクション
- 市場力学
- ポーターのファイブフォース分析
- バリューチェーン分析
- 技術分析
- 2023年~2024年の主要な会議とイベント
- 生態系マッピング
- 特許分析
- ケーススタディ分析
- 貿易データ分析
- 価格分析
- 関税と規制状況
- 顧客のビジネスに影響を与える動向と混乱
- 主要な利害関係者と購入基準
第6章 油浸変圧器市場、設置場所別
- イントロダクション
- パッドマウント
- ポールマウント
- 変電所
第7章 油浸変圧器市場、相別
- イントロダクション
- 単相
- 三相
第8章 油浸変圧器市場、電圧別
- イントロダクション
- 低(36 KV以下)
- 中(36~69 KV)
- 高(69 KV以上)
第9章 油浸変圧器市場、エンドユーザー別
- イントロダクション
- 産業
- 住宅・商業
- 公共事業
第10章 油浸変圧器市場、地域別
- イントロダクション
- アジア太平洋
- 北米
- 欧州
- 南米
- 中東・アフリカ
第11章 競合情勢
- イントロダクション
- 主要参入企業が採用した戦略
- 市場シェア分析、2022年
- 収益分析、2018~2022年
- 企業評価マトリックス、2022年
- スタートアップ/中小企業評価マトリックス、2022年
- 競合シナリオ
第12章 企業プロファイル
- 主要参入企業
- ABB
- SCHNEIDER ELECTRIC
- GENERAL ELECTRIC
- SIEMENS
- EATON
- NINGBO IRONCUBE WORKS INTERNATIONAL CO., LTD.
- MITSUBISHI ELECTRIC
- HITACHI
- HYUNDAI ELECTRIC
- FUJI ELECTRIC
- CROMPTON GREAVES POWER AND INDUSTRIAL SOLUTIONS
- NISSIN ELECTRIC
- ALFANAR GROUP
- JIANGSHAN SCOTECH ELECTRICAL CO., LTD.
- TOSHIBA ENERGY SYSTEMS & SOLUTIONS CORPORATION
- その他の企業
- MGM TRANSFORMER COMPANY
- VOLTAMP
- YUEBIAN ELECTRIC CO., LTD.
- DAIHEN CORPORATION
- CHINT GROUP
第13章 付録
Report Description
| Scope of the Report | |
|---|---|
| Years Considered for the Study | 2021-2028 |
| Base Year | 2022 |
| Forecast Period | 2023-2028 |
| Units Considered | Value (USD Billion) |
| Segments | By Installation, By Phase, By Voltage, and By End User |
| Regions covered | Asia Pacific, North America, Europe, Middle East and Africa, and South America |
The global market for oil immersed power transformers is poised for substantial growth, with a projected trajectory reaching USD 28.3 billion by the year 2028. This represents a noteworthy increase from the estimated value of USD 21.2 billion in 2023, reflecting a steady Compound Annual Growth Rate (CAGR) of 6.0% over the period spanning from 2023 to 2028. Several factors contribute to this robust growth, with a key driver being the escalating global energy demand observed in recent years, which has become a primary catalyst for the surge in electricity consumption. The surge in energy demand is fueled by a variety of sectors, with the industrial sector emerging as a principal force behind the heightened need for oil-immersed power transformers. The industrial sector's substantial contribution is attributed to increased industrialization, manufacturing activities, and infrastructure development across diverse regions. As industries expand and modernize, the demand for efficient and reliable electrical power distribution systems, of which oil immersed power transformers are a crucial component, experiences a corresponding uptick. Beyond the industrial sector, significant contributions to the heightened demand for oil-immersed power transformers come from the commercial, service, and residential sectors. The commercial sector, encompassing various businesses and enterprises, relies heavily on stable and continuous power supply to support operations. The service sector, including healthcare, education, and hospitality, also contributes to the increased demand for electricity. Moreover, the residential sector, driven by population growth and urbanization, necessitates reliable power distribution for homes and communities.
The strategic role of oil immersed power transformers in efficiently stepping up or stepping down voltage levels, along with their ability to provide effective cooling and insulation, positions them as indispensable components within power distribution and transmission systems. The transformers play a crucial role in maintaining the reliability and stability of electrical grids, ensuring the seamless flow of electricity across diverse sectors of the economy. As the global energy landscape evolves, factors such as the integration of renewable energy sources, advancements in smart grid technology, and a focus on energy efficiency are expected to further influence the demand for oil immersed power transformers. Additionally, the increasing emphasis on modernization and upgrading of aging power infrastructure in various regions contributes to the sustained growth of the market.
"High voltage segment, by voltage, to be fastest growing market from 2023 to 2028."
The high voltage segment is anticipated to experience the fastest growth in the power transformer market from 2023 to 2028. This surge is attributed to the increasing demand for medium voltage power transformers in applications such as industrial complexes, renewable energy projects, and urban infrastructure development. The 36-69 kV range strikes a balance between higher voltage transmission and local distribution needs, making it well-suited for diverse applications. The growing emphasis on efficient energy transmission and the integration of renewable energy sources into the grid are driving the demand for medium voltage transformers in this segment. Additionally, advancements in smart grid technology and the need for grid modernization further contribute to the accelerated growth of the high voltage class during this forecast period.
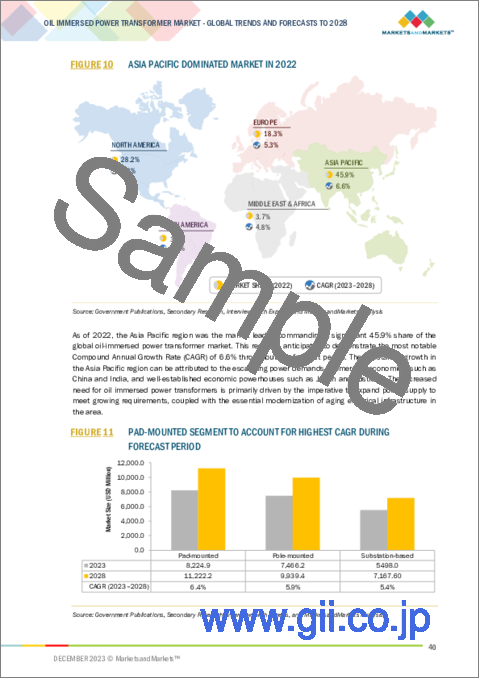
"Pad-mounted, by installation, to be the largest market from 2023 to 2028."
The pad-mounted transformers, characterized by their installation at ground level within protective enclosures, are expected to dominate the power transformer market by insulation type from 2023 to 2028. This anticipated market leadership is primarily attributed to the rising demand for reliable and space-efficient solutions in urban and suburban settings. Pad-mounted transformers offer a compact and aesthetically pleasing alternative to traditional substation installations, making them ideal for areas where space constraints or aesthetic considerations are crucial. Moreover, their ease of maintenance and accessibility contribute to their popularity. The growing urbanization and infrastructural development projects worldwide are propelling the demand for these transformers, especially in residential and commercial areas. Additionally, advancements in solid insulation technologies, such as epoxy resin, contribute to enhanced performance, safety, and environmental sustainability, further driving the adoption of pad-mounted transformers in the forecast period.
"Asia Pacific to be largest and fastest growing region in oil immersed power transformer market."
The Asia Pacific region is poised to emerge as the largest and fastest-growing market in the oil immersed power transformer sector from 2023 to 2028. This dominance is driven by a confluence of factors, including rapid industrialization, expanding urbanization, and robust infrastructure development across key economies in the region. As nations in Asia Pacific experience substantial growth in power demand, the need for efficient and reliable electrical transmission and distribution systems has intensified. Oil-immersed power transformers play a pivotal role in meeting these demands by providing effective voltage transformation and distribution. Additionally, governments in the region are investing significantly in upgrading and expanding their power infrastructure, further fueling the demand for these transformers. The Asia Pacific's commitment to incorporating renewable energy sources into the power grid, coupled with ongoing smart grid initiatives, contributes to the increased adoption of oil-immersed transformers. The region's burgeoning energy needs and ongoing modernization efforts position it as a pivotal market for the oil-immersed power transformer industry, fostering substantial growth and market leadership in the forecast period.
Breakdown of Primaries:
Important qualitative and quantitative data were gathered and verified, as well as future market prospects, through in-depth interviews with subject-matter experts, C-level executives of major market players, industry consultants, and other experts. The following is how the main interviews were dispersed:
By Company Type: Tier 1-45%, Tier 2-40%, and Tier 3-15%
By Designation: C-Level-35%, D-Level-25%, and Others-40%
By Region: North America-18%, Europe-15%, Asia Pacific-50%, Middle East & Africa-10%, and South America-7%
Note: "Others" include sales managers, engineers, and regional managers
The tiers of the companies are defined based on their total revenue as of 2022: Tier 1: >USD 1 billion, Tier 2: USD 500 million-1 billion, and Tier 3: <USD 500 million.
The market for oil immersed power transformers is primarily controlled by reputable international giants. In the industrial control transformer market, some of the leading companies are ABB (Switzerland), Siemens (Germany), Eaton (Ireland), Mitsubishi Electric (Japan), Nissin Electric (Japan), CG Power and Industrial Solutions (India), Daihen Corp (Japan), Fuji Electric (Japan), Hyundai Electric & Energy Systems (South Korea), Hitachi (Japan), and a few more.
Research Coverage:
The report presents a comprehensive analysis of the oil immersed power transformers market, offering detailed definitions, descriptions, and forecasts based on various parameters. These parameters include Phase (Single, Three), Installation (Pad-mounted, Pole-mounted, Substation Installation), Voltage (Low, Medium, High), End-User (Industrial, Residential & Commercial, Utilities), and region (Asia Pacific, North America, Europe, Middle East and Africa, South America). The report conducts a thorough qualitative and quantitative examination of the oil immersed power transformer market, encompassing key drivers, limitations, opportunities, and challenges. Furthermore, it addresses critical aspects of the market, including an evaluation of the competitive landscape, analysis of market dynamics, value-based market estimates, and insights into future trends within the oil immersed power transformers market.
Key Benefits of Buying the Report
The report is meticulously crafted to cater to the needs of both established industry leaders and newcomers entering the oil immersed power transformers market. It offers reliable revenue forecasts for the entire market and its individual sub-segments, serving as a valuable resource for stakeholders to gain a comprehensive understanding of the competitive landscape. This data empowers stakeholders to formulate effective market strategies for their businesses. Additionally, the report acts as a conduit for stakeholders to comprehend the current state of the market, providing crucial insights into market drivers, limitations, challenges, and growth opportunities. By integrating these insights, stakeholders can make informed decisions and stay abreast of the ever-evolving dynamics within the oil immersed power transformers industry.
- Analysis of key drivers (Investments in Grid Resilience and Modernization for a Sustainable Energy Landscape, The Vital Role of oil Immersed power transformer in Modernizing Energy Infrastructure, Integrating Renewable Energy for Sustainable Power Solutions), restraints (Balancing High Initial Investments and Environmental Concerns in Transformer Adoption for Sustainable Power Infrastructure, Ensuring the Reliability and Safety of Oil Immersed Power Transformers), opportunities (Innovations in Transformer Management, Eco-Friendly Solutions, and Smart Grid Technologies for a Sustainable Future, Role of Transformers in Power Grid Resilience and Sustainable Integration of Energy Storage Solutions), and challenges (Aging Infrastructure, Environmental Impact, Operational Stress, and Integration with Renewable Energy Sources, Addressing the Skilled Workforce Shortage for Sustainable Growth in the transformer market) influencing the growth of the oil Immersed power transformer market.
- Product Development/ Innovation: In the realm of the oil immersed power transformer market, product development and innovation stand as pivotal drivers shaping the industry's trajectory. As technological advancements continue to unfold, manufacturers are increasingly focusing on developing innovative products that offer enhanced performance, efficiency, and safety. These innovations often involve the integration of smart technologies, advanced materials, and eco-friendly insulation options to meet the evolving needs of the power distribution landscape. Additionally, ongoing research and development efforts are directed towards creating transformers that align with the growing demand for sustainable and environmentally conscious solutions. By leveraging cutting-edge technologies and novel design approaches, companies in the oil-immersed power transformer market aim to not only meet current industry standards but also stay ahead of the curve, providing customers with state-of-the-art solutions that contribute to the overall efficiency and reliability of power distribution systems. The emphasis on product development and innovation underscores the industry's commitment to staying responsive to changing market dynamics and driving continuous improvement in the performance and capabilities of oil-immersed power transformers.
- Market Development: Market development in the oil immersed power transformer sector is a dynamic process driven by efforts to explore and tap into new geographies. Companies within this market continually seek opportunities to expand their reach and cater to emerging demands. This may involve penetrating untapped regions. Market development strategies also extend to identifying and capitalizing on evolving industry trends, such as the integration of renewable energy sources and the modernization of power grids. By actively participating in market development, industry players can not only broaden their customer base but also adapt their offerings to align with the changing needs of diverse sectors. This strategic approach fosters sustained growth, fosters increased competitiveness, and positions companies to effectively navigate the evolving landscape of the oil-immersed power transformer market. Through targeted initiatives, collaborations, and strategic partnerships, market development becomes a crucial avenue for ensuring long-term success and relevance in this dynamic and vital segment of the power distribution industry.
- Market Diversification: Market diversification within the oil immersed power transformer industry involves a strategic expansion of product and service offerings to mitigate risks, tap into new revenue streams, and enhance overall resilience. Companies in this sector often explore opportunities to diversify by introducing a broader range of transformer types and voltages. This could include entering niche markets, adapting products for specialized uses, or expanding the portfolio to cater to a wider array of customer needs. By diversifying their offerings, companies can reduce dependence on a specific product or market segment, thereby enhancing their ability to withstand market fluctuations and economic uncertainties. Additionally, diversification can involve geographic expansion, reaching new regions or countries to tap into unique market demands. Successful market diversification strategies are rooted in a deep understanding of market trends, customer preferences, and technological advancements, allowing companies to position themselves as versatile and adaptive players in the dynamic landscape of the oil-immersed power transformer market. Ultimately, a well-executed diversification approach enables companies to navigate changing market dynamics, seize emerging opportunities, and fortify their position in a competitive industry.
- Competitive Assessment: A thorough assessment has been undertaken to examine the market presence, growth strategies, and service portfolios of key players in the oil immersed power transformer market. Prominent companies such as Eaton (Ireland), ABB (Switzerland), Schneider Electric (France), Siemens (Germany), Mitsubishi Electric (Japan), and others have been subject to this analysis. The evaluation offers detailed insights into the competitive standings of these major players, shedding light on their initiatives to propel market growth and the spectrum of services they provide within the oil-immersed power transformer segment.
TABLE OF CONTENTS
1 INTRODUCTION
- 1.1 STUDY OBJECTIVES
- 1.2 MARKET DEFINITION
- 1.3 INCLUSIONS AND EXCLUSIONS
- TABLE 1 OIL-IMMERSED POWER TRANSFORMER MARKET, BY INSTALLATION
- TABLE 2 OIL-IMMERSED POWER TRANSFORMER MARKET, BY VOLTAGE
- TABLE 3 OIL-IMMERSED POWER TRANSFORMER MARKET, BY PHASE
- TABLE 4 OIL-IMMERSED POWER TRANSFORMER MARKET, BY END USER
- TABLE 5 OIL-IMMERSED POWER TRANSFORMER MARKET, BY REGION
- 1.4 STUDY SCOPE
- 1.4.1 MARKETS COVERED
- FIGURE 1 OIL-IMMERSED POWER TRANSFORMER MARKET SEGMENTATION
- 1.4.2 REGIONS COVERED
- 1.5 YEARS CONSIDERED
- 1.6 CURRENCY CONSIDERED
- 1.7 STAKEHOLDERS
- 1.8 SUMMARY OF CHANGES
2 RESEARCH METHODOLOGY
- 2.1 RESEARCH DATA
- FIGURE 2 RESEARCH DESIGN
- 2.1.1 SECONDARY DATA
- 2.1.1.1 Key data from secondary sources
- 2.1.2 PRIMARY DATA
- 2.1.2.1 Key data from primary sources
- 2.1.2.2 Breakdown of primary interviews
- FIGURE 3 BREAKDOWN OF PRIMARY INTERVIEWS: BY COMPANY TYPE, DESIGNATION, AND REGION
- 2.1.3 SECONDARY AND PRIMARY RESEARCH
- FIGURE 4 METRICS CONSIDERED TO ANALYZE AND ASSESS DEMAND FOR OIL-IMMERSED POWER TRANSFORMERS
- 2.2 RESEARCH LIMITATIONS
- 2.3 MARKET SIZE ESTIMATION
- 2.3.1 BOTTOM-UP APPROACH
- FIGURE 5 BOTTOM-UP APPROACH
- 2.3.2 TOP-DOWN APPROACH
- FIGURE 6 TOP-DOWN APPROACH
- 2.3.3 DEMAND-SIDE ANALYSIS
- 2.3.3.1 Regional-level analysis
- 2.3.3.2 Country-level analysis
- 2.3.3.3 Demand-side assumptions
- 2.3.3.4 Demand-side calculations
- 2.3.4 SUPPLY-SIDE ANALYSIS
- FIGURE 7 KEY STEPS CONSIDERED TO ASSESS SUPPLY OF OIL-IMMERSED POWER TRANSFORMERS
- FIGURE 8 SUPPLY-SIDE ANALYSIS
- 2.3.4.1 Supply-side assumptions
- 2.3.4.2 Supply-side calculations
- 2.3.5 GROWTH FORECAST
- 2.4 RECESSION IMPACT ANALYSIS
- 2.5 MARKET BREAKDOWN AND DATA TRIANGULATION
- FIGURE 9 DATA TRIANGULATION
3 EXECUTIVE SUMMARY
- TABLE 6 OIL-IMMERSED POWER TRANSFORMER MARKET SNAPSHOT
- FIGURE 10 ASIA PACIFIC DOMINATED MARKET IN 2022
- FIGURE 11 PAD-MOUNTED SEGMENT TO ACCOUNT FOR HIGHEST CAGR DURING FORECAST PERIOD
- FIGURE 12 THREE PHASE SEGMENT TO LEAD MARKET DURING FORECAST PERIOD
- FIGURE 13 HIGH VOLTAGE SEGMENT TO HAVE LARGEST MARKET SHARE DURING FORECAST PERIOD
- FIGURE 14 TRANSMISSION SEGMENT TO EXHIBIT LARGEST MARKET SHARE (2023-2028)
- FIGURE 15 UTILITIES SEGMENT TO ACCOUNT FOR HIGHEST CAGR DURING FORECAST PERIOD
4 PREMIUM INSIGHTS
- 4.1 ATTRACTIVE OPPORTUNITIES FOR PLAYERS IN OIL-IMMERSED POWER TRANSFORMER MARKET
- FIGURE 16 GROWING ENVIRONMENTAL CONCERNS AND URBANIZATION TO DRIVE MARKET
- 4.2 OIL-IMMERSED POWER TRANSFORMER MARKET, BY REGION
- FIGURE 17 ASIA PACIFIC MARKET TO SHOWCASE HIGHEST CAGR DURING FORECAST PERIOD
- 4.3 OIL-IMMERSED POWER TRANSFORMER MARKET IN ASIA PACIFIC, BY PHASE AND COUNTRY, 2022
- FIGURE 18 OUTDOOR SEGMENT AND CHINA ACCOUNTED FOR LARGEST MARKET SHARES IN ASIA PACIFIC, 2022
- 4.4 OIL-IMMERSED POWER TRANSFORMER MARKET, BY INSTALLATION
- FIGURE 19 PAD-MOUNTED SEGMENT TO HOLD LARGEST MARKET SHARE IN 2028
- 4.5 OIL-IMMERSED POWER TRANSFORMER MARKET, BY PHASE
- FIGURE 20 THREE PHASE SEGMENT TO HAVE LARGEST MARKET SHARE IN 2022
- 4.6 OIL-IMMERSED POWER TRANSFORMER MARKET, BY VOLTAGE
- FIGURE 21 MEDIUM VOLTAGE SEGMENT TO HAVE HIGHEST SHARE IN 2022
- 4.7 OIL-IMMERSED POWER TRANSFORMER MARKET, BY END USER
- FIGURE 22 UTILITIES SEGMENT TO ACCOUNT FOR LARGEST MARKET SHARE IN 2022
5 MARKET OVERVIEW
- 5.1 INTRODUCTION
- 5.2 MARKET DYNAMICS
- FIGURE 23 OIL-IMMERSED POWER TRANSFORMER MARKET: DRIVERS, RESTRAINTS, OPPORTUNITIES, AND CHALLENGES
- 5.2.1 DRIVERS
- 5.2.1.1 Modernization of energy infrastructure
- FIGURE 24 EXPANSION OF ELECTRIC VEHICLE MARKET, 2016-2023
- 5.2.1.2 Incorporation of renewable energy for sustainable power solutions
- FIGURE 25 RENEWABLE CAPACITY ADDITIONS, BY REGION, 2019-2021
- 5.2.2 RESTRAINTS
- 5.2.2.1 High initial investment
- FIGURE 26 CHANGE IN ELECTRICITY DEMAND, BY REGION, 2019-2025
- 5.2.2.2 Safety compliance related to oil-immersed power transformers
- 5.2.3 OPPORTUNITIES
- 5.2.3.1 Innovations in transformer management and smart grid technologies
- 5.2.3.2 Integration of energy storage solutions into power grids
- FIGURE 27 GLOBAL GDP GROWTH, 2010-2022
- 5.2.4 CHALLENGES
- 5.2.4.1 Aging infrastructure and other operational constraints
- 5.2.4.2 Shortage of skilled workforce
- 5.3 PORTER'S FIVE FORCES ANALYSIS
- FIGURE 28 PORTER'S FIVE FORCES ANALYSIS
- TABLE 7 PORTER'S FIVE FORCES ANALYSIS
- 5.3.1 THREAT OF SUBSTITUTES
- 5.3.2 BARGAINING POWER OF SUPPLIERS
- 5.3.3 BARGAINING POWER OF BUYERS
- 5.3.4 THREAT OF NEW ENTRANTS
- 5.3.5 INTENSITY OF COMPETITIVE RIVALRY
- 5.4 VALUE CHAIN ANALYSIS
- FIGURE 29 VALUE CHAIN ANALYSIS
- 5.4.1 RAW MATERIAL PROVIDERS/SUPPLIERS
- 5.4.2 COMPONENT MANUFACTURERS
- 5.4.3 OIL-IMMERSED POWER TRANSFORMER MANUFACTURERS/ASSEMBLERS
- 5.4.4 DISTRIBUTORS
- 5.4.5 END USERS
- 5.4.6 POST-SALES SERVICES
- 5.5 TECHNOLOGY ANALYSIS
- 5.5.1 DIGITALIZATION
- 5.5.2 SUSTAINABLE TECHNOLOGIES
- 5.6 KEY CONFERENCES AND EVENTS, 2023-2024
- TABLE 8 KEY CONFERENCES AND EVENTS, 2023-2024
- 5.7 ECOSYSTEM MAPPING
- FIGURE 30 ECOSYSTEM MAPPING
- TABLE 9 ROLE OF COMPANIES IN ECOSYSTEM
- 5.8 PATENT ANALYSIS
- FIGURE 31 PATENT ANALYSIS
- TABLE 10 PATENT ANALYSIS, 2020-2023
- 5.9 CASE STUDY ANALYSIS
- 5.9.1 OVERHEATING OF OIL-IMMERSED POWER TRANSFORMER AT MAPLE CREEK WIND FARM
- 5.9.1.1 Problem
- 5.9.1.2 Solution
- 5.9.2 OIL LEAK FROM POWER TRANSFORMER AT CENTRAL CITY SUBSTATION
- 5.9.2.1 Problem
- 5.9.2.2 Solution
- 5.9.3 AGING OF OIL-IMMERSED POWER TRANSFORMER AT BIG RIVER SUBSTATION
- 5.9.3.1 Problem
- 5.9.3.2 Solution
- 5.9.1 OVERHEATING OF OIL-IMMERSED POWER TRANSFORMER AT MAPLE CREEK WIND FARM
- 5.10 TRADE DATA ANALYSIS
- 5.10.1 TRADE ANALYSIS RELATED TO LIQUID DIELECTRIC TRANSFORMERS WITH POWER HANDLING CAPACITY <= 650 KVA
- 5.10.1.1 Import data
- TABLE 11 IMPORT SCENARIO FOR HS CODE 850421, BY COUNTRY, 2020-2022 (USD)
- 5.10.1.2 Export data
- TABLE 12 EXPORT SCENARIO FOR HS CODE 850421, BY COUNTRY, 2020-2022 (USD)
- 5.10.2 TRADE ANALYSIS RELATED TO LIQUID DIELECTRIC TRANSFORMERS WITH POWER HANDLING CAPACITY > 10,000 KVA
- 5.10.2.1 Import data
- TABLE 13 IMPORT SCENARIO FOR HS CODE 850423, BY COUNTRY, 2020-2022 (USD)
- 5.10.2.2 Export data
- TABLE 14 EXPORT SCENARIO FOR HS CODE 850423, BY COUNTRY, 2020-2022 (USD)
- 5.10.1 TRADE ANALYSIS RELATED TO LIQUID DIELECTRIC TRANSFORMERS WITH POWER HANDLING CAPACITY <= 650 KVA
- 5.11 PRICING ANALYSIS
- 5.11.1 AVERAGE SELLING PRICE OF OIL-IMMERSED POWER TRANSFORMERS, BY VOLTAGE
- TABLE 15 AVERAGE SELLING PRICE OF OIL-IMMERSED POWER TRANSFORMERS, BY VOLTAGE
- 5.11.2 AVERAGE SELLING PRICE OF OIL-IMMERSED POWER TRANSFORMERS, BY REGION
- TABLE 16 AVERAGE SELLING PRICE OF OIL-IMMERSED POWER TRANSFORMERS, BY REGION (USD MILLION/UNIT)
- FIGURE 32 AVERAGE SELLING PRICE OF OIL-IMMERSED POWER TRANSFORMERS, BY REGION
- 5.12 TARIFF AND REGULATORY LANDSCAPE
- 5.12.1 TARIFFS RELATED TO OIL-IMMERSED POWER TRANSFORMERS
- TABLE 17 IMPORT TARIFFS FOR HS 850421 LIQUID DIELECTRIC TRANSFORMERS, WITH POWER HANDLING CAPACITY > 10.000 KVA, 2022
- 5.12.2 REGULATORY BODIES, GOVERNMENT AGENCIES, AND OTHER ORGANIZATIONS
- TABLE 18 NORTH AMERICA: REGULATORY BODIES, GOVERNMENT AGENCIES, AND OTHER ORGANIZATIONS
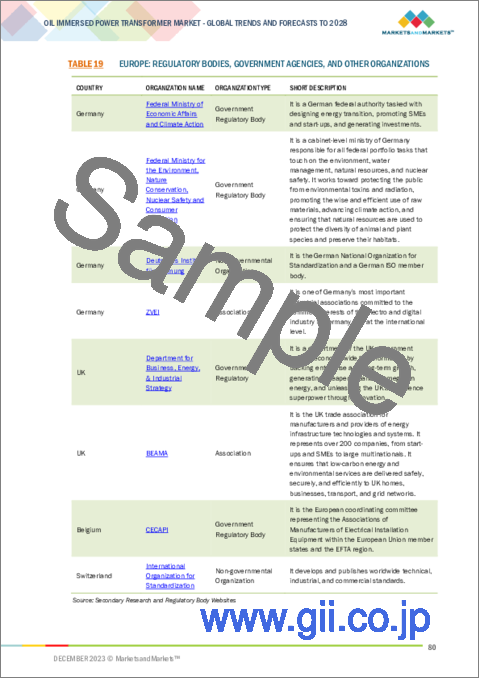
- TABLE 19 EUROPE: REGULATORY BODIES, GOVERNMENT AGENCIES, AND OTHER ORGANIZATIONS
- TABLE 20 ASIA PACIFIC: REGULATORY BODIES, GOVERNMENT AGENCIES, AND OTHER ORGANIZATIONS
- TABLE 21 REST OF THE WORLD: REGULATORY BODIES, GOVERNMENT AGENCIES, AND OTHER ORGANIZATIONS
- 5.12.3 CODES AND REGULATIONS RELATED TO OIL-IMMERSED POWER TRANSFORMERS
- TABLE 22 CODES AND REGULATIONS RELATED TO OIL-IMMERSED POWER TRANSFORMERS
- 5.13 TRENDS AND DISRUPTIONS IMPACTING CUSTOMER BUSINESS
- FIGURE 33 TRENDS AND DISRUPTIONS IMPACTING CUSTOMER BUSINESS
- 5.14 KEY STAKEHOLDERS AND BUYING CRITERIA
- 5.14.1 STAKEHOLDERS IN BUYING PROCESS
- FIGURE 34 INFLUENCE OF STAKEHOLDERS ON BUYING PROCESS, BY END USER
- TABLE 23 INFLUENCE OF STAKEHOLDERS ON BUYING PROCESS, BY END USER
- 5.14.2 BUYING CRITERIA
- FIGURE 35 KEY BUYING CRITERIA, BY END USER
- TABLE 24 KEY BUYING CRITERIA, BY END USER
6 OIL-IMMERSED POWER TRANSFORMER MARKET, BY INSTALLATION
- 6.1 INTRODUCTION
- FIGURE 36 OIL-IMMERSED POWER TRANSFORMER MARKET, BY INSTALLATION, 2022
- TABLE 25 OIL-IMMERSED POWER TRANSFORMER MARKET, BY INSTALLATION, 2021-2028 (USD MILLION)
- 6.2 PAD-MOUNTED
- 6.2.1 RISE IN DEMAND FOR EFFICIENT ELECTRICITY DISTRIBUTION TO DRIVE GROWTH
- TABLE 26 PAD-MOUNTED: OIL-IMMERSED POWER TRANSFORMER MARKET, BY REGION, 2021-2028 (USD MILLION)
- 6.3 POLE-MOUNTED
- 6.3.1 NEED FOR MORE EXTENSIVE AND EFFECTIVE COVERAGE TO DRIVE GROWTH
- TABLE 27 POLE-MOUNTED: OIL-IMMERSED POWER TRANSFORMER MARKET, BY REGION, 2021-2028 (USD MILLION)
- 6.4 SUBSTATION-BASED
- 6.4.1 RAPID INTEGRATION OF SMART GRID SOLUTIONS TO DRIVE GROWTH
- TABLE 28 SUBSTATION-BASED: OIL-IMMERSED POWER TRANSFORMER MARKET, BY REGION, 2021-2028 (USD MILLION)
7 OIL-IMMERSED POWER TRANSFORMER MARKET, BY PHASE
- 7.1 INTRODUCTION
- FIGURE 37 OIL-IMMERSED POWER TRANSFORMER MARKET, BY PHASE, 2022
- TABLE 29 OIL-IMMERSED POWER TRANSFORMER MARKET, BY PHASE, 2021-2028 (USD MILLION)
- 7.2 SINGLE
- 7.2.1 EASY INSTALLATION AND MAINTENANCE TO DRIVE GROWTH
- TABLE 30 SINGLE: OIL-IMMERSED POWER TRANSFORMER MARKET, BY REGION, 2021-2028 (USD MILLION)
- 7.3 THREE
- 7.3.1 EFFICIENT POWER TRANSMISSION AND DISTRIBUTION TO DRIVE GROWTH
- TABLE 31 THREE: OIL-IMMERSED POWER TRANSFORMER MARKET, BY REGION, 2021-2028 (USD MILLION)
8 OIL-IMMERSED POWER TRANSFORMER MARKET, BY VOLTAGE
- 8.1 INTRODUCTION
- FIGURE 38 OIL-IMMERSED POWER TRANSFORMER MARKET, BY VOLTAGE, 2022
- TABLE 32 OIL-IMMERSED POWER TRANSFORMER MARKET, BY VOLTAGE, 2021-2028 (USD MILLION)
- TABLE 33 OIL-IMMERSED POWER TRANSFORMER MARKET, BY VOLTAGE, 2021-2028 (UNITS)
- 8.2 LOW (BELOW 36 KV)
- 8.2.1 LOW RISK OF ELECTRICAL SHOCKS AND BETTER CONTROL IN CONFINED SPACES TO DRIVE GROWTH
- TABLE 34 LOW (BELOW 36 KV): OIL-IMMERSED POWER TRANSFORMER MARKET, BY REGION, 2021-2028 (USD MILLION)
- 8.3 MEDIUM (36-69 KV)
- 8.3.1 IMPROVED PERFORMANCE AND ELECTRIC STABILITY TO DRIVE GROWTH
- TABLE 35 MEDIUM (36-69 KV): OIL-IMMERSED POWER TRANSFORMER MARKET, BY REGION, 2021-2028 (USD MILLION)
- 8.4 HIGH (ABOVE 69 KV)
- 8.4.1 INTEGRATION OF ADVANCED MONITORING AND CONTROL SYSTEMS TO DRIVE GROWTH
- TABLE 36 HIGH (ABOVE 69 KV): OIL-IMMERSED POWER TRANSFORMER MARKET, BY REGION, 2021-2028 (USD MILLION)
9 OIL-IMMERSED POWER TRANSFORMER MARKET, BY END USER
- 9.1 INTRODUCTION
- FIGURE 39 OIL-IMMERSED POWER TRANSFORMER MARKET, BY END USER, 2022
- TABLE 37 OIL-IMMERSED POWER TRANSFORMER MARKET, BY END USER, 2021-2028 (USD MILLION)
- TABLE 38 OIL-IMMERSED POWER TRANSFORMER MARKET, BY END USER, 2021-2028 (UNITS)
- 9.2 INDUSTRIAL
- 9.2.1 ROBUST DESIGN AND INSULATION PROPERTIES OF OIL-IMMERSED TRANSFORMERS TO DRIVE GROWTH
- TABLE 39 INDUSTRIAL: OIL-IMMERSED POWER TRANSFORMER MARKET, BY REGION, 2021-2028 (USD MILLION)
- TABLE 40 INDUSTRIAL: OIL-IMMERSED POWER TRANSFORMER MARKET, BY REGION, 2021-2028 (UNITS)
- TABLE 41 INDUSTRIAL: OIL-IMMERSED POWER TRANSFORMER MARKET, BY SUBSEGMENT, 2021-2028 (USD MILLION)
- 9.2.1.1 Oil & Gas
- 9.2.1.2 Pharmaceutical
- 9.2.1.3 Automotive
- 9.2.1.4 Steel
- 9.2.1.5 Chemical
- 9.2.1.6 Food & Beverage
- 9.3 RESIDENTIAL & COMMERCIAL
- 9.3.1 NEED FOR UNINTERRUPTED SUPPLY OF ELECTRICITY TO DRIVE GROWTH
- TABLE 42 RESIDENTIAL & COMMERCIAL: OIL-IMMERSED POWER TRANSFORMER MARKET, BY REGION, 2021-2028 (USD MILLION)
- TABLE 43 RESIDENTIAL & COMMERCIAL: OIL-IMMERSED POWER TRANSFORMER MARKET, BY REGION, 2021-2028 (UNITS)
- 9.4 UTILITIES
- 9.4.1 PROACTIVE MAINTENANCE STRATEGIES AND ENVIRONMENTAL CONSCIOUSNESS TO DRIVE GROWTH
- TABLE 44 UTILITIES: OIL-IMMERSED POWER TRANSFORMER MARKET, BY REGION, 2021-2028 (USD MILLION)
- TABLE 45 UTILITIES: OIL-IMMERSED POWER TRANSFORMER MARKET, BY REGION, 2021-2028 (UNITS)
10 OIL-IMMERSED POWER TRANSFORMER MARKET, BY REGION
- 10.1 INTRODUCTION
- FIGURE 40 OIL-IMMERSED POWER TRANSFORMER MARKET, BY REGION, 2022
- FIGURE 41 ASIA PACIFIC TO REGISTER HIGHEST CAGR FROM 2023 TO 2028
- TABLE 46 OIL-IMMERSED POWER TRANSFORMER MARKET, BY REGION, 2021-2028 (USD MILLION)
- TABLE 47 OIL-IMMERSED POWER TRANSFORMER MARKET, BY REGION, 2021-2028 (UNITS)
- 10.2 ASIA PACIFIC
- 10.2.1 RECESSION IMPACT ANALYSIS
- FIGURE 42 ASIA PACIFIC: OIL-IMMERSED POWER TRANSFORMER MARKET SNAPSHOT
- TABLE 48 ASIA PACIFIC: OIL-IMMERSED POWER TRANSFORMER MARKET, BY INSTALLATION, 2021-2028 (USD MILLION)
- TABLE 49 ASIA PACIFIC: OIL-IMMERSED POWER TRANSFORMER MARKET, BY PHASE, 2021-2028 (USD MILLION)
- TABLE 50 ASIA PACIFIC: OIL-IMMERSED POWER TRANSFORMER MARKET, BY VOLTAGE RATING, 2021-2028 (USD MILLION)
- TABLE 51 ASIA PACIFIC: OIL-IMMERSED POWER TRANSFORMER MARKET, BY END USER, 2021-2028 (USD MILLION)
- TABLE 52 ASIA PACIFIC: OIL-IMMERSED POWER TRANSFORMER MARKET, BY END USER, 2021-2028 (UNITS)
- TABLE 53 ASIA PACIFIC: OIL-IMMERSED POWER TRANSFORMER MARKET, BY SUBSEGMENT, 2021-2028 (USD MILLION)
- TABLE 54 ASIA PACIFIC: OIL-IMMERSED POWER TRANSFORMER MARKET, BY COUNTRY, 2021-2028 (USD MILLION)
- 10.2.2 CHINA
- 10.2.2.1 Rapid industrialization and adoption of three-phase oil-immersed transformers to drive growth
- TABLE 55 CHINA: OIL-IMMERSED POWER TRANSFORMER MARKET, BY PHASE, 2021-2028 (USD MILLION)
- 10.2.3 INDIA
- 10.2.3.1 Smart grid initiatives and independent power producers to drive growth
- TABLE 56 INDIA: OIL-IMMERSED POWER TRANSFORMER MARKET, BY PHASE, 2021-2028 (USD MILLION)
- 10.2.4 JAPAN
- 10.2.4.1 Advancement of electricity infrastructure and replacement of aging transformers to drive growth
- TABLE 57 JAPAN: OIL-IMMERSED POWER TRANSFORMER MARKET, BY PHASE, 2021-2028 (USD MILLION)
- 10.2.5 SOUTH KOREA
- 10.2.5.1 Modernization programs for power distribution networks to drive growth
- TABLE 58 SOUTH KOREA: OIL-IMMERSED POWER TRANSFORMER MARKET, BY PHASE, 2021-2028 (USD MILLION)
- 10.2.6 REST OF ASIA PACIFIC
- TABLE 59 REST OF ASIA PACIFIC: OIL-IMMERSED POWER TRANSFORMER MARKET, BY PHASE, 2021-2028 (USD MILLION)
- 10.3 NORTH AMERICA
- 10.3.1 RECESSION IMPACT ANALYSIS
- TABLE 60 NORTH AMERICA: OIL-IMMERSED POWER TRANSFORMER MARKET, BY INSTALLATION, 2021-2028 (USD MILLION)
- TABLE 61 NORTH AMERICA: OIL-IMMERSED POWER TRANSFORMER MARKET, BY PHASE, 2021-2028 (USD MILLION)
- TABLE 62 NORTH AMERICA: OIL-IMMERSED POWER TRANSFORMER MARKET, BY VOLTAGE, 2021-2028 (USD MILLION)
- TABLE 63 NORTH AMERICA: OIL-IMMERSED POWER TRANSFORMER MARKET, BY END USER, 2021-2028 (USD MILLION)
- TABLE 64 NORTH AMERICA: OIL-IMMERSED POWER TRANSFORMER MARKET, BY END USER, 2021-2028 (UNITS)
- TABLE 65 NORTH AMERICA: OIL-IMMERSED POWER TRANSFORMER MARKET, BY SUBSEGMENT, 2021-2028 (USD MILLION)
- TABLE 66 NORTH AMERICA: OIL IMMERSED POWER TRANSFORMER MARKET, BY COUNTRY, 2021-2028 (USD MILLION)
- 10.3.1.1 US
- 10.3.1.1.1 Development of electric substations and transmission networks to drive growth
- 10.3.1.1 US
- TABLE 67 US: OIL-IMMERSED POWER TRANSFORMER MARKET, BY PHASE, 2021-2028 (USD MILLION)
- 10.3.1.2 anada
- 10.3.1.2.1 Rising electricity demand to drive growth
- 10.3.1.2 anada
- TABLE 68 CANADA: OIL-IMMERSED POWER TRANSFORMER MARKET, BY PHASE, 2021-2028 (USD MILLION)
- 10.3.1.3 Mexico
- 10.3.1.3.1 Government initiatives to drive growth
- 10.3.1.3 Mexico
- TABLE 69 MEXICO: OIL-IMMERSED POWER TRANSFORMER MARKET, BY PHASE, 2021-2028 (USD MILLION)
- 10.4 EUROPE
- 10.4.1 RECESSION IMPACT ANALYSIS
- FIGURE 43 EUROPE: OIL-IMMERSED POWER TRANSFORMER MARKET SNAPSHOT
- TABLE 70 EUROPE: OIL-IMMERSED POWER TRANSFORMER MARKET, BY INSTALLATION, 2021-2028 (USD MILLION)
- TABLE 71 EUROPE: OIL-IMMERSED POWER TRANSFORMER MARKET, BY PHASE, 2021-2028 (USD MILLION)
- TABLE 72 EUROPE: OIL-IMMERSED POWER TRANSFORMER MARKET, BY VOLTAGE RATING, 2021-2028 (USD MILLION)
- TABLE 73 EUROPE: OIL-IMMERSED POWER TRANSFORMER MARKET, BY END USER, 2021-2028 (USD MILLION)
- TABLE 74 EUROPE: OIL-IMMERSED POWER TRANSFORMER MARKET, BY END USER, 2021-2028 (UNITS)
- TABLE 75 EUROPE: OIL-IMMERSED POWER TRANSFORMER MARKET, BY SUBSEGMENT, 2021-2028 (USD MILLION)
- TABLE 76 EUROPE: OIL-IMMERSED POWER TRANSFORMER MARKET, BY COUNTRY, 2021-2028 (USD MILLION)
- 10.4.1.1 Germany
- 10.4.1.1.1 Digitalization and automation of grids to drive growth
- 10.4.1.1 Germany
- TABLE 77 GERMANY: OIL-IMMERSED POWER TRANSFORMER MARKET, BY PHASE, 2021-2028 (USD MILLION)
- 10.4.1.2 UK
- 10.4.1.2.1 Innovations in transformer design, materials, and monitoring techniques to drive growth
- 10.4.1.2 UK
- TABLE 78 UK: OIL-IMMERSED POWER TRANSFORMER MARKET, BY PHASE, 2021-2028 (USD MILLION)
- 10.4.1.3 Italy
- 10.4.1.3.1 Ongoing shift toward cleaner energy to drive growth
- 10.4.1.3 Italy
- TABLE 79 ITALY: OIL-IMMERSED POWER TRANSFORMER MARKET, BY PHASE, 2021-2028 (USD MILLION)
- 10.4.1.4 France
- 10.4.1.4.1 Integration of renewable energy into power grids to drive growth
- 10.4.1.4 France
- TABLE 80 FRANCE: OIL-IMMERSED POWER TRANSFORMER MARKET, BY PHASE, 2021-2028 (USD MILLION)
- 10.4.1.5 Spain
- 10.4.1.5.1 2021-2026 electricity transmission grid planning to drive growth
- 10.4.1.5 Spain
- TABLE 81 SPAIN: OIL-IMMERSED POWER TRANSFORMER MARKET, BY PHASE, 2021-2028 (USD MILLION)
- 10.4.1.6 Rest of Europe
- TABLE 82 REST OF EUROPE: OIL-IMMERSED POWER TRANSFORMER MARKET, BY PHASE, 2021-2028 (USD MILLION)
- 10.5 SOUTH AMERICA
- TABLE 83 SOUTH AMERICA: OIL-IMMERSED POWER TRANSFORMER MARKET, BY INSTALLATION, 2021-2028 (USD MILLION)
- TABLE 84 SOUTH AMERICA: OIL-IMMERSED POWER TRANSFORMER MARKET, BY PHASE, 2021-2028 (USD MILLION)
- TABLE 85 SOUTH AMERICA: OIL-IMMERSED POWER TRANSFORMER MARKET, BY VOLTAGE, 2021-2028 (USD MILLION)
- TABLE 86 SOUTH AMERICA: OIL-IMMERSED POWER TRANSFORMER MARKET, BY END USER, 2021-2028 (USD MILLION)
- TABLE 87 SOUTH AMERICA: OIL-IMMERSED POWER TRANSFORMER MARKET, BY END USER, 2021-2028 (UNITS)
- TABLE 88 SOUTH AMERICA: OIL-IMMERSED POWER TRANSFORMER MARKET, BY SUBSEGMENT, 2021-2028 (USD MILLION)
- TABLE 89 SOUTH AMERICA: OIL-IMMERSED POWER TRANSFORMER MARKET, BY COUNTRY, 2021-2028 (USD MILLION)
- 10.5.1 BRAZIL
- 10.5.1.1 Adoption of higher voltage transformers to drive growth
- TABLE 90 BRAZIL: OIL-IMMERSED POWER TRANSFORMER MARKET, BY PHASE, 2021-2028 (USD MILLION)
- 10.5.2 ARGENTINA
- 10.5.2.1 Renovar program to drive growth
- TABLE 91 ARGENTINA: OIL-IMMERSED POWER TRANSFORMER MARKET, BY PHASE, 2021-2028 (USD MILLION)
- 10.5.3 REST OF SOUTH AMERICA
- TABLE 92 REST OF SOUTH AMERICA: OIL-IMMERSED POWER TRANSFORMER MARKET, BY PHASE, 2021-2028 (USD MILLION)
- 10.6 MIDDLE EAST & AFRICA
- TABLE 93 MIDDLE EAST & AFRICA: OIL-IMMERSED POWER TRANSFORMER MARKET, BY INSTALLATION, 2021-2028 (USD MILLION)
- TABLE 94 MIDDLE EAST & AFRICA: OIL-IMMERSED POWER TRANSFORMER MARKET, BY PHASE, 2021-2028 (USD MILLION)
- TABLE 95 MIDDLE EAST & AFRICA: OIL-IMMERSED POWER TRANSFORMER MARKET, BY VOLTAGE RATING, 2021-2028 (USD MILLION)
- TABLE 96 MIDDLE EAST & AFRICA: OIL-IMMERSED POWER TRANSFORMER MARKET, BY END USER, 2021-2028 (USD MILLION)
- TABLE 97 MIDDLE EAST & AFRICA: OIL-IMMERSED POWER TRANSFORMER MARKET, BY END USER, 2021-2028 (UNITS)
- TABLE 98 MIDDLE EAST & AFRICA: INDUSTRIAL: OIL-IMMERSED POWER TRANSFORMER MARKET, BY SUBSEGMENT, 2021-2028 (USD MILLION)
- TABLE 99 MIDDLE EAST & AFRICA: OIL-IMMERSED POWER TRANSFORMER MARKET, BY REGION, 2021-2028 (USD MILLION)
- 10.6.1 SAUDI ARABIA
- 10.6.1.1 Vision 2030 initiative to drive growth
- TABLE 100 SAUDI ARABIA: OIL-IMMERSED POWER TRANSFORMER MARKET, BY PHASE, 2021-2028 (USD MILLION)
- 10.6.2 UAE
- 10.6.2.1 Dubai Clean Energy Strategy 2050 to drive growth
- TABLE 101 UAE: OIL-IMMERSED POWER TRANSFORMER MARKET, BY PHASE, 2021-2028 (USD MILLION)
- 10.6.3 REST OF GCC
- 10.6.3.1 Consistent economic growth and compliance with international regulations to drive market
- TABLE 102 REST OF GCC: OIL-IMMERSED POWER TRANSFORMER MARKET, BY PHASE, 2021-2028 (USD MILLION)
- 10.6.4 SOUTH AFRICA
- 10.6.4.1 Expansion of nation grid infrastructure to drive growth
- TABLE 103 SOUTH AFRICA: OIL-IMMERSED POWER TRANSFORMER MARKET, BY PHASE, 2021-2028 (USD MILLION)
- 10.6.5 NIGERIA
- 10.6.5.1 Rural Electrification Agency and transmission rehabilitation and expansion program to drive growth
- TABLE 104 NIGERIA: OIL-IMMERSED POWER TRANSFORMER MARKET, BY PHASE, 2021-2028 (USD MILLION)
- 10.6.6 REST OF MIDDLE EAST & AFRICA
- TABLE 105 REST OF MIDDLE EAST & AFRICA: OIL-IMMERSED POWER TRANSFORMER MARKET, BY PHASE, 2021-2028 (USD MILLION)
11 COMPETITIVE LANDSCAPE
- 11.1 INTRODUCTION
- 11.2 STRATEGIES ADOPTED BY KEY PLAYERS
- TABLE 106 STRATEGIES ADOPTED BY KEY PLAYERS, 2019-2022
- 11.3 MARKET SHARE ANALYSIS, 2022
- TABLE 107 OIL-IMMERSED POWER TRANSFORMER MARKET: DEGREE OF COMPETITION
- FIGURE 44 MARKET SHARE ANALYSIS OF KEY PLAYERS, 2022
- 11.4 REVENUE ANALYSIS, 2018-2022
- FIGURE 45 REVENUE ANALYSIS OF KEY PLAYERS, 2018-2022
- 11.5 COMPANY EVALUATION MATRIX, 2022
- 11.5.1 STARS
- 11.5.2 PERVASIVE PLAYERS
- 11.5.3 EMERGING LEADERS
- 11.5.4 PARTICIPANTS
- FIGURE 46 COMPANY EVALUATION MATRIX, 2022
- 11.5.5 COMPANY FOOTPRINT
- TABLE 108 INSTALLATION FOOTPRINT
- TABLE 109 VOLTAGE FOOTPRINT
- TABLE 110 PHASE FOOTPRINT
- TABLE 111 END USER FOOTPRINT
- TABLE 112 REGION FOOTPRINT
- TABLE 113 COMPANY FOOTPRINT
- 11.6 STARTUP/SME EVALUATION MATRIX, 2022
- 11.6.1 PROGRESSIVE COMPANIES
- 11.6.2 RESPONSIVE COMPANIES
- 11.6.3 DYNAMIC COMPANIES
- 11.6.4 STARTING BLOCKS
- FIGURE 47 STARTUP/SME EVALUATION MATRIX, 2022
- 11.6.5 COMPETITIVE BENCHMARKING
- TABLE 114 COMPETITIVE BENCHMARKING OF KEY STARTUPS/SMES
- TABLE 115 KEY STARTUPS/SMES
- 11.7 COMPETITIVE SCENARIOS
- 11.7.1 PRODUCT LAUNCHES
- TABLE 116 PRODUCT LAUNCHES, 2019-2023
- 11.7.2 DEALS
- TABLE 117 DEALS, 2019-2023
- 11.7.3 OTHERS
- TABLE 118 OTHERS, 2019-2023
12 COMPANY PROFILES
- (Business Overview, Products Offered, Recent Developments, and MnM View (Key strengths/Right to Win, Strategic Choices Made, and Weaknesses and Competitive Threats))**
- 12.1 KEY PLAYERS
- 12.1.1 ABB
- TABLE 119 ABB: COMPANY OVERVIEW
- FIGURE 48 ABB: COMPANY SNAPSHOT
- TABLE 120 ABB: PRODUCTS OFFERED
- TABLE 121 ABB: DEALS
- 12.1.2 SCHNEIDER ELECTRIC
- TABLE 122 SCHNEIDER ELECTRIC: COMPANY OVERVIEW
- FIGURE 49 SCHNEIDER ELECTRIC: COMPANY SNAPSHOT
- TABLE 123 SCHNEIDER ELECTRIC: PRODUCTS OFFERED
- TABLE 124 SCHNEIDER ELECTRIC: DEALS
- 12.1.3 GENERAL ELECTRIC
- TABLE 125 GENERAL ELECTRIC: COMPANY OVERVIEW
- FIGURE 50 GENERAL ELECTRIC: COMPANY SNAPSHOT
- TABLE 126 GENERAL ELECTRIC: PRODUCTS OFFERED
- TABLE 127 GENERAL ELECTRIC: DEALS
- 12.1.4 SIEMENS
- TABLE 128 SIEMENS: COMPANY OVERVIEW
- FIGURE 51 SIEMENS: COMPANY SNAPSHOT
- TABLE 129 SIEMENS: PRODUCTS OFFERED
- TABLE 130 SIEMENS: PRODUCT LAUNCHES
- TABLE 131 SIEMENS: DEALS
- 12.1.5 EATON
- TABLE 132 EATON: COMPANY OVERVIEW
- FIGURE 52 EATON: COMPANY SNAPSHOT
- TABLE 133 EATON: PRODUCTS OFFERED
- TABLE 134 EATON: DEALS
- 12.1.6 NINGBO IRONCUBE WORKS INTERNATIONAL CO., LTD.
- TABLE 135 NINGBO IRONCUBE WORKS INTERNATIONAL CO., LTD.: COMPANY OVERVIEW
- TABLE 136 NINGBO IRONCUBE WORKS INTERNATIONAL CO., LTD.: PRODUCTS OFFERED
- 12.1.7 MITSUBISHI ELECTRIC
- TABLE 137 MITSUBISHI ELECTRIC: COMPANY OVERVIEW
- FIGURE 53 MITSUBISHI ELECTRIC: COMPANY SNAPSHOT
- TABLE 138 MITSUBISHI ELECTRIC: PRODUCTS OFFERED
- TABLE 139 MITSUBISHI ELECTRIC: DEALS
- 12.1.8 HITACHI
- TABLE 140 HITACHI: COMPANY OVERVIEW
- FIGURE 54 HITACHI: COMPANY SNAPSHOT
- TABLE 141 HITACHI: PRODUCTS OFFERED
- TABLE 142 HITACHI: DEALS
- TABLE 143 HITACHI: OTHERS
- 12.1.9 HYUNDAI ELECTRIC
- TABLE 144 HYUNDAI ELECTRIC: COMPANY OVERVIEW
- FIGURE 55 HYUNDAI ELECTRIC: COMPANY SNAPSHOT
- TABLE 145 HYUNDAI ELECTRIC: PRODUCTS OFFERED
- 12.1.10 FUJI ELECTRIC
- TABLE 146 FUJI ELECTRIC: COMPANY OVERVIEW
- FIGURE 56 FUJI ELECTRIC: COMPANY SNAPSHOT
- TABLE 147 FUJI ELECTRIC: PRODUCTS OFFERED
- TABLE 148 FUJI ELECTRIC: PRODUCT LAUNCHES
- 12.1.11 CROMPTON GREAVES POWER AND INDUSTRIAL SOLUTIONS
- TABLE 149 CROMPTON GREAVES POWER AND INDUSTRIAL SOLUTIONS: COMPANY OVERVIEW
- FIGURE 57 CROMPTON GREAVES POWER AND INDUSTRIAL SOLUTIONS: COMPANY SNAPSHOT
- TABLE 150 CROMPTON GREAVES POWER AND INDUSTRIAL SOLUTIONS: PRODUCTS OFFERED
- TABLE 151 CROMPTON GREAVES POWER AND INDUSTRIAL SOLUTIONS: OTHERS
- 12.1.12 NISSIN ELECTRIC
- TABLE 152 NISSIN ELECTRIC: COMPANY OVERVIEW
- FIGURE 58 NISSIN ELECTRIC: COMPANY SNAPSHOT
- TABLE 153 NISSIN ELECTRIC: PRODUCTS OFFERED
- 12.1.13 ALFANAR GROUP
- TABLE 154 ALFANAR GROUP: COMPANY OVERVIEW
- TABLE 155 ALFANAR GROUP: PRODUCTS OFFERED
- TABLE 156 ALFANAR GROUP: DEALS
- 12.1.14 JIANGSHAN SCOTECH ELECTRICAL CO., LTD.
- TABLE 157 JIANGSHAN SCOTECH ELECTRICAL CO., LTD.: COMPANY OVERVIEW
- TABLE 158 JIANGSHAN SCOTECH ELECTRICAL CO., LTD.: PRODUCTS/SOLUTIONS/SERVICES OFFERED
- 12.1.15 TOSHIBA ENERGY SYSTEMS & SOLUTIONS CORPORATION
- TABLE 159 TOSHIBA ENERGY SYSTEMS & SOLUTIONS CORPORATION: COMPANY OVERVIEW
- FIGURE 59 TOSHIBA ENERGY SYSTEMS & SOLUTIONS CORPORATION: COMPANY SNAPSHOT
- TABLE 160 TOSHIBA ENERGY SYSTEMS & SOLUTIONS CORPORATION: PRODUCTS OFFERED
- 12.2 OTHER PLAYERS
- 12.2.1 MGM TRANSFORMER COMPANY
- 12.2.2 VOLTAMP
- 12.2.3 YUEBIAN ELECTRIC CO., LTD.
- 12.2.4 DAIHEN CORPORATION
- 12.2.5 CHINT GROUP
- *Details on Business Overview, Products Offered, Recent Developments, and MnM View (Key strengths/Right to Win, Strategic Choices Made, and Weaknesses and Competitive Threats) might not be captured in case of unlisted companies.
13 APPENDIX
- 13.1 INSIGHTS FROM INDUSTRY EXPERTS
- 13.2 DISCUSSION GUIDE
- 13.3 KNOWLEDGESTORE: MARKETSANDMARKETS' SUBSCRIPTION PORTAL
- 13.4 CUSTOMIZATION OPTIONS
- 13.5 RELATED REPORTS
- 13.6 AUTHOR DETAILS