|
|
市場調査レポート
商品コード
1395803
フォトニックセンサの世界市場規模、シェア、産業動向分析レポート:製品別、用途別、技術別、地域別展望と予測、2023年~2030年Global Photonic Sensors Market Size, Share & Industry Trends Analysis Report By Product, By Application, By Technology (Fiber Optic Technology, Laser Technology, and Biophotonic Technology), By Regional Outlook and Forecast, 2023 - 2030 |
||||||
|
|
|||||||


| フォトニックセンサの世界市場規模、シェア、産業動向分析レポート:製品別、用途別、技術別、地域別展望と予測、2023年~2030年 |
|
出版日: 2023年11月30日
発行: KBV Research
ページ情報: 英文 437 Pages
納期: 即納可能
|
- 全表示
- 概要
- 図表
- 目次
フォトニックセンサ市場規模は、予測期間中にCAGR 14.5%で成長し、2030年には805億米ドルに達すると予測されます。2022年の市場規模は2億8,237万6,800台となり、15.7%(2019~2022年)の成長を遂げています。
しかし、製造業、家電、農業など多くの産業は価格に非常に敏感です。フォトニックセンサー技術の高額な初期費用は潜在的なユーザーを遠ざけ、市場浸透を制限する可能性があります。競争の激しい市場では、フォトニックセンサーメーカーは競争力を維持するために価格引き下げの圧力に直面する可能性があります。これは利益率に影響を与える可能性があり、コスト削減策が必要になることもあります。エンドユーザーは、フォトニックセンサー導入の投資収益率(ROI)を評価することが多いです。フォトニックセンサー技術の進歩には、継続的な研究開発が欠かせないです。技術革新の最前線に立ち続けるためのコストは、メーカーにとって課題となり得る。民生用電子機器や農業など、一部のアプリケーションには厳しいコスト制限があります。これらのセンサーは、コストの制約から特定のアプリケーションから除外される可能性があります。以上の要因が市場成長の妨げとなります。
製品の展望
製品別では、光ファイバーセンサー、イメージセンサー、バイオフォトニックセンサー、その他に区分されます。イメージセンサセグメントは、2022年の市場で大きな収益シェアを獲得しました。イメージセンサーは、異なるフレームレートで画像をキャプチャすることができ、ビデオの動きの滑らかさを決定します。高いフレームレートは、ビデオ録画や高速写真撮影などの用途に不可欠です。幅広い照明条件のシーンを撮影するには、より高いダイナミックレンジが望ましいです。イメージ・センサは現代のデジタル画像技術の中核であり、その性能は向上し続けているため、さまざまなコンシューマー機器や産業機器において、より高画質な画像、より正確な色再現、より優れた低照度性能を実現しています。
用途の展望
用途別に見ると、市場はセーフティ・セキュリティ、産業、オートメーション・輸送、ヘルスケア、エネルギー・インフラ、石油・ガス、その他に分けられます。2022年の市場では、産業プロセス分野が大きな収益シェアを獲得しました。赤外線(IR)温度計と赤外線サーモグラフィは、機械、装置、材料の温度を測定するためにこれらのセンサを使用します。油圧システム、化学処理、石油・ガス事業などの産業プロセスで使用されます。正確な測定とデータを提供することで、より良いプロセス制御、品質保証、メンテナンスが可能になり、最終的には生産性の向上と運用コストの削減に貢献します。
技術展望
技術は、光ファイバー技術、レーザー技術、バイオフォトニック技術に区分されます。バイオフォトニック技術セグメントは、2022年の市場でかなりの収益シェアを獲得しました。バイオフォトニック技術は、蛍光顕微鏡による細胞や分子構造の可視化と研究を可能にします。バイオフォトニック技術は、水質や汚染レベルなどの環境パラメータのモニタリングに応用できます。基本的な生物学的プロセスを理解し、ヘルスケアやライフサイエンスのための実用的なソリューションを開発する上で重要な役割を果たしています。現在進行中のバイオフォトニック技術の開発は、生物学的システムの探求と操作能力をさらに高めることが期待されています。
地域別展望
地域別では、北米、欧州、アジア太平洋、LAMEAで分析されています。アジア太平洋地域は、2022年の市場においてかなりの収益シェアを占めています。アジア太平洋地域は、予測される期間を通じて最も大幅な成長率を経験すると予想されます。近年、韓国と中国の経済は、フォトニクスとレーザで最も大きな成長を経験しています。これは、この地域の製造業、特にこれらの国々における大幅な変革によるものです。さらに、フォトニクスとレーザはアジア太平洋地域で大幅な拡大を経験しています。
目次
第1章 市場範囲と調査手法
- 市場の定義
- 目的
- 市場範囲
- セグメンテーション
- 調査手法
第2章 市場要覧
- 主なハイライト
第3章 市場概要
- イントロダクション
- 概要
- 市場構成とシナリオ
- 概要
- 市場に影響を与える主な要因
- 市場促進要因
- 市場抑制要因
- ポーターのファイブフォース分析
第4章 フォトニックセンサー市場で展開される戦略
第5章 世界のフォトニックセンサー市場:製品別
- 世界の光ファイバーセンサー市場:地域別
- 世界のイメージセンサー市場:地域別
- 世界の生体フォトニックセンサー市場:地域別
- 世界のその他の市場:地域別
第6章 世界のフォトニックセンサ市場:用途別
- 世界のセーフティ・セキュリティ市場:地域別
- 世界の自動車および輸送市場:地域別
- 世界の産業市場:地域別
- 世界のヘルスケア市場:地域別
- 世界の石油・ガス市場:地域別
- 世界のエネルギーおよびインフラ市場:地域別
- 世界のその他の市場:地域別
第7章 世界のフォトニックセンサ市場:技術別
- 世界の光ファイバー技術市場:地域別
- 世界のレーザー技術市場:地域別
- 世界のバイオフォトニクス技術市場:地域別
第8章 世界のフォトニックセンサ市場:地域別
- 北米
- 欧州
- アジア太平洋
- ラテンアメリカ・中東・アフリカ
第9章 企業プロファイル
- Baumer Holding AG
- Banner Engineering Corporation
- Honeywell International, Inc
- Samsung Electronics Co, Ltd.(Samsung Group)
- Toshiba Corporation
- Fujifilm Holdings Corporation
- Motorola Solutions, Inc
- General Electric Company
- BAE Systems PLC
- General Dynamics Corporation
第10章 市場の成功必須条件
LIST OF TABLES
- TABLE 1 Global Photonic Sensors Market, 2019 - 2022, USD Million
- TABLE 2 Global Photonic Sensors Market, 2023 - 2030, USD Million
- TABLE 3 Global Photonic Sensors Market, 2019 - 2022, Thousand Units
- TABLE 4 Global Photonic Sensors Market, 2023 - 2030, Thousand Units
- TABLE 5 Global Photonic Sensors Market, by Product, 2019 - 2022, USD Million
- TABLE 6 Global Photonic Sensors Market, by Product, 2023 - 2030, USD Million
- TABLE 7 Global Photonic Sensors Market, by Product, 2019 - 2022, Thousand Units
- TABLE 8 Global Photonic Sensors Market, by Product, 2023 - 2030, Thousand Units
- TABLE 9 Global Fiber Optic Sensor Market, by Region, 2019 - 2022, USD Million
- TABLE 10 Global Fiber Optic Sensor Market, by Region, 2023 - 2030, USD Million
- TABLE 11 Global Fiber Optic Sensor Market, by Region, 2019 - 2022, Thousand Units
- TABLE 12 Global Fiber Optic Sensor Market, by Region, 2023 - 2030, Thousand Units
- TABLE 13 Global Image Sensor Market, by Region, 2019 - 2022, USD Million
- TABLE 14 Global Image Sensor Market, by Region, 2023 - 2030, USD Million
- TABLE 15 Global Image Sensor Market, by Region, 2019 - 2022, Thousand Units
- TABLE 16 Global Image Sensor Market, by Region, 2023 - 2030, Thousand Units
- TABLE 17 Global Biophotonic Sensor Market, by Region, 2019 - 2022, USD Million
- TABLE 18 Global Biophotonic Sensor Market, by Region, 2023 - 2030, USD Million
- TABLE 19 Global Biophotonic Sensor Market, by Region, 2019 - 2022, Thousand Units
- TABLE 20 Global Biophotonic Sensor Market, by Region, 2023 - 2030, Thousand Units
- TABLE 21 Global Others Market, by Region, 2019 - 2022, USD Million
- TABLE 22 Global Others Market, by Region, 2023 - 2030, USD Million
- TABLE 23 Global Others Market, by Region, 2019 - 2022, Thousand Units
- TABLE 24 Global Others Market, by Region, 2023 - 2030, Thousand Units
- TABLE 25 Global Photonic Sensors Market, by Application, 2019 - 2022, USD Million
- TABLE 26 Global Photonic Sensors Market, by Application, 2023 - 2030, USD Million
- TABLE 27 Global Photonic Sensors Market, by Application, 2019 - 2022, Thousand Units
- TABLE 28 Global Photonic Sensors Market, by Application, 2023 - 2030, Thousand Units
- TABLE 29 Global Safety & Security Market, by Region, 2019 - 2022, USD Million
- TABLE 30 Global Safety & Security Market, by Region, 2023 - 2030, USD Million
- TABLE 31 Global Safety & Security Market, by Region, 2019 - 2022, Thousand Units
- TABLE 32 Global Safety & Security Market, by Region, 2023 - 2030, Thousand Units
- TABLE 33 Global Automotive & Transportation Market, by Region, 2019 - 2022, USD Million
- TABLE 34 Global Automotive & Transportation Market, by Region, 2023 - 2030, USD Million
- TABLE 35 Global Automotive & Transportation Market, by Region, 2019 - 2022, Thousand Units
- TABLE 36 Global Automotive & Transportation Market, by Region, 2023 - 2030, Thousand Units
- TABLE 37 Global Industrial Market, by Region, 2019 - 2022, USD Million
- TABLE 38 Global Industrial Market, by Region, 2023 - 2030, USD Million
- TABLE 39 Global Industrial Market, by Region, 2019 - 2022, Thousand Units
- TABLE 40 Global Industrial Market, by Region, 2023 - 2030, Thousand Units
- TABLE 41 Global Healthcare Market, by Region, 2019 - 2022, USD Million
- TABLE 42 Global Healthcare Market, by Region, 2023 - 2030, USD Million
- TABLE 43 Global Healthcare Market, by Region, 2019 - 2022, Thousand Units
- TABLE 44 Global Healthcare Market, by Region, 2023 - 2030, Thousand Units
- TABLE 45 Global Oil & Gas Market, by Region, 2019 - 2022, USD Million
- TABLE 46 Global Oil & Gas Market, by Region, 2023 - 2030, USD Million
- TABLE 47 Global Oil & Gas Market, by Region, 2019 - 2022, Thousand Units
- TABLE 48 Global Oil & Gas Market, by Region, 2023 - 2030, Thousand Units
- TABLE 49 Global Energy & Infrastructure Market, by Region, 2019 - 2022, USD Million
- TABLE 50 Global Energy & Infrastructure Market, by Region, 2023 - 2030, USD Million
- TABLE 51 Global Energy & Infrastructure Market, by Region, 2019 - 2022, Thousand Units
- TABLE 52 Global Energy & Infrastructure Market, by Region, 2023 - 2030, Thousand Units
- TABLE 53 Global Others Market, by Region, 2019 - 2022, USD Million
- TABLE 54 Global Others Market, by Region, 2023 - 2030, USD Million
- TABLE 55 Global Others Market, by Region, 2019 - 2022, Thousand Units
- TABLE 56 Global Others Market, by Region, 2023 - 2030, Thousand Units
- TABLE 57 Global Photonic Sensors Market, by Technology, 2019 - 2022, USD Million
- TABLE 58 Global Photonic Sensors Market, by Technology, 2023 - 2030, USD Million
- TABLE 59 Global Photonic Sensors Market, by Technology, 2019 - 2022, Thousand Units
- TABLE 60 Global Photonic Sensors Market, by Technology, 2023 - 2030, Thousand Units
- TABLE 61 Global Fiber Optic Technology Market, by Region, 2019 - 2022, USD Million
- TABLE 62 Global Fiber Optic Technology Market, by Region, 2023 - 2030, USD Million
- TABLE 63 Global Fiber Optic Technology Market, by Region, 2019 - 2022, Thousand Units
- TABLE 64 Global Fiber Optic Technology Market, by Region, 2023 - 2030, Thousand Units
- TABLE 65 Global Laser Technology Market, by Region, 2019 - 2022, USD Million
- TABLE 66 Global Laser Technology Market, by Region, 2023 - 2030, USD Million
- TABLE 67 Global Laser Technology Market, by Region, 2019 - 2022, Thousand Units
- TABLE 68 Global Laser Technology Market, by Region, 2023 - 2030, Thousand Units
- TABLE 69 Global Biophotonic Technology Market, by Region, 2019 - 2022, USD Million
- TABLE 70 Global Biophotonic Technology Market, by Region, 2023 - 2030, USD Million
- TABLE 71 Global Biophotonic Technology Market, by Region, 2019 - 2022, Thousand Units
- TABLE 72 Global Biophotonic Technology Market, by Region, 2023 - 2030, Thousand Units
- TABLE 73 Global Photonic Sensors Market, by Region, 2019 - 2022, USD Million
- TABLE 74 Global Photonic Sensors Market, by Region, 2023 - 2030, USD Million
- TABLE 75 Global Photonic Sensors Market, by Region, 2019 - 2022, Thousand Units
- TABLE 76 Global Photonic Sensors Market, by Region, 2023 - 2030, Thousand Units
- TABLE 77 North America Photonic Sensors Market, 2019 - 2022, USD Million
- TABLE 78 North America Photonic Sensors Market, 2023 - 2030, USD Million
- TABLE 79 North America Photonic Sensors Market, 2019 - 2022, Thousand Units
- TABLE 80 North America Photonic Sensors Market, 2023 - 2030, Thousand Units
- TABLE 81 North America Photonic Sensors Market, by Product, 2019 - 2022, USD Million
- TABLE 82 North America Photonic Sensors Market, by Product, 2023 - 2030, USD Million
- TABLE 83 North America Photonic Sensors Market, by Product, 2019 - 2022, Thousand Units
- TABLE 84 North America Photonic Sensors Market, by Product, 2023 - 2030, Thousand Units
- TABLE 85 North America Fiber Optic Sensor Market, by Country, 2019 - 2022, USD Million
- TABLE 86 North America Fiber Optic Sensor Market, by Country, 2023 - 2030, USD Million
- TABLE 87 North America Fiber Optic Sensor Market, by Country, 2019 - 2022, Thousand Units
- TABLE 88 North America Fiber Optic Sensor Market, by Country, 2023 - 2030, Thousand Units
- TABLE 89 North America Image Sensor Market, by Country, 2019 - 2022, USD Million
- TABLE 90 North America Image Sensor Market, by Country, 2023 - 2030, USD Million
- TABLE 91 North America Image Sensor Market, by Country, 2019 - 2022, Thousand Units
- TABLE 92 North America Image Sensor Market, by Country, 2023 - 2030, Thousand Units
- TABLE 93 North America Biophotonic Sensor Market, by Country, 2019 - 2022, USD Million
- TABLE 94 North America Biophotonic Sensor Market, by Country, 2023 - 2030, USD Million
- TABLE 95 North America Biophotonic Sensor Market, by Country, 2019 - 2022, Thousand Units
- TABLE 96 North America Biophotonic Sensor Market, by Country, 2023 - 2030, Thousand Units
- TABLE 97 North America Others Market, by Country, 2019 - 2022, USD Million
- TABLE 98 North America Others Market, by Country, 2023 - 2030, USD Million
- TABLE 99 North America Others Market, by Country, 2019 - 2022, Thousand Units
- TABLE 100 North America Others Market, by Country, 2023 - 2030, Thousand Units
- TABLE 101 North America Photonic Sensors Market, by Application, 2019 - 2022, USD Million
- TABLE 102 North America Photonic Sensors Market, by Application, 2023 - 2030, USD Million
- TABLE 103 North America Photonic Sensors Market, by Application, 2019 - 2022, Thousand Units
- TABLE 104 North America Photonic Sensors Market, by Application, 2023 - 2030, Thousand Units
- TABLE 105 North America Safety & Security Market, by Country, 2019 - 2022, USD Million
- TABLE 106 North America Safety & Security Market, by Country, 2023 - 2030, USD Million
- TABLE 107 North America Safety & Security Market, by Country, 2019 - 2022, Thousand Units
- TABLE 108 North America Safety & Security Market, by Country, 2023 - 2030, Thousand Units
- TABLE 109 North America Automotive & Transportation Market, by Country, 2019 - 2022, USD Million
- TABLE 110 North America Automotive & Transportation Market, by Country, 2023 - 2030, USD Million
- TABLE 111 North America Automotive & Transportation Market, by Country, 2019 - 2022, Thousand Units
- TABLE 112 North America Automotive & Transportation Market, by Country, 2023 - 2030, Thousand Units
- TABLE 113 North America Industrial Market, by Country, 2019 - 2022, USD Million
- TABLE 114 North America Industrial Market, by Country, 2023 - 2030, USD Million
- TABLE 115 North America Industrial Market, by Country, 2019 - 2022, Thousand Units
- TABLE 116 North America Industrial Market, by Country, 2023 - 2030, Thousand Units
- TABLE 117 North America Healthcare Market, by Country, 2019 - 2022, USD Million
- TABLE 118 North America Healthcare Market, by Country, 2023 - 2030, USD Million
- TABLE 119 North America Healthcare Market, by Country, 2019 - 2022, Thousand Units
- TABLE 120 North America Healthcare Market, by Country, 2023 - 2030, Thousand Units
- TABLE 121 North America Oil & Gas Market, by Country, 2019 - 2022, USD Million
- TABLE 122 North America Oil & Gas Market, by Country, 2023 - 2030, USD Million
- TABLE 123 North America Oil & Gas Market, by Country, 2019 - 2022, Thousand Units
- TABLE 124 North America Oil & Gas Market, by Country, 2023 - 2030, Thousand Units
- TABLE 125 North America Energy & Infrastructure Market, by Country, 2019 - 2022, USD Million
- TABLE 126 North America Energy & Infrastructure Market, by Country, 2023 - 2030, USD Million
- TABLE 127 North America Energy & Infrastructure Market, by Country, 2019 - 2022, Thousand Units
- TABLE 128 North America Energy & Infrastructure Market, by Country, 2023 - 2030, Thousand Units
- TABLE 129 North America Others Market, by Country, 2019 - 2022, USD Million
- TABLE 130 North America Others Market, by Country, 2023 - 2030, USD Million
- TABLE 131 North America Others Market, by Country, 2019 - 2022, Thousand Units
- TABLE 132 North America Others Market, by Country, 2023 - 2030, Thousand Units
- TABLE 133 North America Photonic Sensors Market, by Technology, 2019 - 2022, USD Million
- TABLE 134 North America Photonic Sensors Market, by Technology, 2023 - 2030, USD Million
- TABLE 135 North America Photonic Sensors Market, by Technology, 2019 - 2022, Thousand Units
- TABLE 136 North America Photonic Sensors Market, by Technology, 2023 - 2030, Thousand Units
- TABLE 137 North America Fiber Optic Technology Market, by Country, 2019 - 2022, USD Million
- TABLE 138 North America Fiber Optic Technology Market, by Country, 2023 - 2030, USD Million
- TABLE 139 North America Fiber Optic Technology Market, by Country, 2019 - 2022, Thousand Units
- TABLE 140 North America Fiber Optic Technology Market, by Country, 2023 - 2030, Thousand Units
- TABLE 141 North America Laser Technology Market, by Country, 2019 - 2022, USD Million
- TABLE 142 North America Laser Technology Market, by Country, 2023 - 2030, USD Million
- TABLE 143 North America Laser Technology Market, by Country, 2019 - 2022, Thousand Units
- TABLE 144 North America Laser Technology Market, by Country, 2023 - 2030, Thousand Units
- TABLE 145 North America Biophotonic Technology Market, by Country, 2019 - 2022, USD Million
- TABLE 146 North America Biophotonic Technology Market, by Country, 2023 - 2030, USD Million
- TABLE 147 North America Biophotonic Technology Market, by Country, 2019 - 2022, Thousand Units
- TABLE 148 North America Biophotonic Technology Market, by Country, 2023 - 2030, Thousand Units
- TABLE 149 North America Photonic Sensors Market, by Country, 2019 - 2022, USD Million
- TABLE 150 North America Photonic Sensors Market, by Country, 2023 - 2030, USD Million
- TABLE 151 North America Photonic Sensors Market, by Country, 2019 - 2022, Thousand Units
- TABLE 152 North America Photonic Sensors Market, by Country, 2023 - 2030, Thousand Units
- TABLE 153 US Photonic Sensors Market, 2019 - 2022, USD Million
- TABLE 154 US Photonic Sensors Market, 2023 - 2030, USD Million
- TABLE 155 US Photonic Sensors Market, 2019 - 2022, Thousand Units
- TABLE 156 US Photonic Sensors Market, 2023 - 2030, Thousand Units
- TABLE 157 US Photonic Sensors Market, by Product, 2019 - 2022, USD Million
- TABLE 158 US Photonic Sensors Market, by Product, 2023 - 2030, USD Million
- TABLE 159 US Photonic Sensors Market, by Product, 2019 - 2022, Thousand Units
- TABLE 160 US Photonic Sensors Market, by Product, 2023 - 2030, Thousand Units
- TABLE 161 US Photonic Sensors Market, by Application, 2019 - 2022, USD Million
- TABLE 162 US Photonic Sensors Market, by Application, 2023 - 2030, USD Million
- TABLE 163 US Photonic Sensors Market, by Application, 2019 - 2022, Thousand Units
- TABLE 164 US Photonic Sensors Market, by Application, 2023 - 2030, Thousand Units
- TABLE 165 US Photonic Sensors Market, by Technology, 2019 - 2022, USD Million
- TABLE 166 US Photonic Sensors Market, by Technology, 2023 - 2030, USD Million
- TABLE 167 US Photonic Sensors Market, by Technology, 2019 - 2022, Thousand Units
- TABLE 168 US Photonic Sensors Market, by Technology, 2023 - 2030, Thousand Units
- TABLE 169 Canada Photonic Sensors Market, 2019 - 2022, USD Million
- TABLE 170 Canada Photonic Sensors Market, 2023 - 2030, USD Million
- TABLE 171 Canada Photonic Sensors Market, 2019 - 2022, Thousand Units
- TABLE 172 Canada Photonic Sensors Market, 2023 - 2030, Thousand Units
- TABLE 173 Canada Photonic Sensors Market, by Product, 2019 - 2022, USD Million
- TABLE 174 Canada Photonic Sensors Market, by Product, 2023 - 2030, USD Million
- TABLE 175 Canada Photonic Sensors Market, by Product, 2019 - 2022, Thousand Units
- TABLE 176 Canada Photonic Sensors Market, by Product, 2023 - 2030, Thousand Units
- TABLE 177 Canada Photonic Sensors Market, by Application, 2019 - 2022, USD Million
- TABLE 178 Canada Photonic Sensors Market, by Application, 2023 - 2030, USD Million
- TABLE 179 Canada Photonic Sensors Market, by Application, 2019 - 2022, Thousand Units
- TABLE 180 Canada Photonic Sensors Market, by Application, 2023 - 2030, Thousand Units
- TABLE 181 Canada Photonic Sensors Market, by Technology, 2019 - 2022, USD Million
- TABLE 182 Canada Photonic Sensors Market, by Technology, 2023 - 2030, USD Million
- TABLE 183 Canada Photonic Sensors Market, by Technology, 2019 - 2022, Thousand Units
- TABLE 184 Canada Photonic Sensors Market, by Technology, 2023 - 2030, Thousand Units
- TABLE 185 Mexico Photonic Sensors Market, 2019 - 2022, USD Million
- TABLE 186 Mexico Photonic Sensors Market, 2023 - 2030, USD Million
- TABLE 187 Mexico Photonic Sensors Market, 2019 - 2022, Thousand Units
- TABLE 188 Mexico Photonic Sensors Market, 2023 - 2030, Thousand Units
- TABLE 189 Mexico Photonic Sensors Market, by Product, 2019 - 2022, USD Million
- TABLE 190 Mexico Photonic Sensors Market, by Product, 2023 - 2030, USD Million
- TABLE 191 Mexico Photonic Sensors Market, by Product, 2019 - 2022, Thousand Units
- TABLE 192 Mexico Photonic Sensors Market, by Product, 2023 - 2030, Thousand Units
- TABLE 193 Mexico Photonic Sensors Market, by Application, 2019 - 2022, USD Million
- TABLE 194 Mexico Photonic Sensors Market, by Application, 2023 - 2030, USD Million
- TABLE 195 Mexico Photonic Sensors Market, by Application, 2019 - 2022, Thousand Units
- TABLE 196 Mexico Photonic Sensors Market, by Application, 2023 - 2030, Thousand Units
- TABLE 197 Mexico Photonic Sensors Market, by Technology, 2019 - 2022, USD Million
- TABLE 198 Mexico Photonic Sensors Market, by Technology, 2023 - 2030, USD Million
- TABLE 199 Mexico Photonic Sensors Market, by Technology, 2019 - 2022, Thousand Units
- TABLE 200 Mexico Photonic Sensors Market, by Technology, 2023 - 2030, Thousand Units
- TABLE 201 Rest of North America Photonic Sensors Market, 2019 - 2022, USD Million
- TABLE 202 Rest of North America Photonic Sensors Market, 2023 - 2030, USD Million
- TABLE 203 Rest of North America Photonic Sensors Market, 2019 - 2022, Thousand Units
- TABLE 204 Rest of North America Photonic Sensors Market, 2023 - 2030, Thousand Units
- TABLE 205 Rest of North America Photonic Sensors Market, by Product, 2019 - 2022, USD Million
- TABLE 206 Rest of North America Photonic Sensors Market, by Product, 2023 - 2030, USD Million
- TABLE 207 Rest of North America Photonic Sensors Market, by Product, 2019 - 2022, Thousand Units
- TABLE 208 Rest of North America Photonic Sensors Market, by Product, 2023 - 2030, Thousand Units
- TABLE 209 Rest of North America Photonic Sensors Market, by Application, 2019 - 2022, USD Million
- TABLE 210 Rest of North America Photonic Sensors Market, by Application, 2023 - 2030, USD Million
- TABLE 211 Rest of North America Photonic Sensors Market, by Application, 2019 - 2022, Thousand Units
- TABLE 212 Rest of North America Photonic Sensors Market, by Application, 2023 - 2030, Thousand Units
- TABLE 213 Rest of North America Photonic Sensors Market, by Technology, 2019 - 2022, USD Million
- TABLE 214 Rest of North America Photonic Sensors Market, by Technology, 2023 - 2030, USD Million
- TABLE 215 Rest of North America Photonic Sensors Market, by Technology, 2019 - 2022, Thousand Units
- TABLE 216 Rest of North America Photonic Sensors Market, by Technology, 2023 - 2030, Thousand Units
- TABLE 217 Europe Photonic Sensors Market, 2019 - 2022, USD Million
- TABLE 218 Europe Photonic Sensors Market, 2023 - 2030, USD Million
- TABLE 219 Europe Photonic Sensors Market, 2019 - 2022, Thousand Units
- TABLE 220 Europe Photonic Sensors Market, 2023 - 2030, Thousand Units
- TABLE 221 Europe Photonic Sensors Market, by Product, 2019 - 2022, USD Million
- TABLE 222 Europe Photonic Sensors Market, by Product, 2023 - 2030, USD Million
- TABLE 223 Europe Photonic Sensors Market, by Product, 2019 - 2022, Thousand Units
- TABLE 224 Europe Photonic Sensors Market, by Product, 2023 - 2030, Thousand Units
- TABLE 225 Europe Fiber Optic Sensor Market, by Country, 2019 - 2022, USD Million
- TABLE 226 Europe Fiber Optic Sensor Market, by Country, 2023 - 2030, USD Million
- TABLE 227 Europe Fiber Optic Sensor Market, by Country, 2019 - 2022, Thousand Units
- TABLE 228 Europe Fiber Optic Sensor Market, by Country, 2023 - 2030, Thousand Units
- TABLE 229 Europe Image Sensor Market, by Country, 2019 - 2022, USD Million
- TABLE 230 Europe Image Sensor Market, by Country, 2023 - 2030, USD Million
- TABLE 231 Europe Image Sensor Market, by Country, 2019 - 2022, Thousand Units
- TABLE 232 Europe Image Sensor Market, by Country, 2023 - 2030, Thousand Units
- TABLE 233 Europe Biophotonic Sensor Market, by Country, 2019 - 2022, USD Million
- TABLE 234 Europe Biophotonic Sensor Market, by Country, 2023 - 2030, USD Million
- TABLE 235 Europe Biophotonic Sensor Market, by Country, 2019 - 2022, Thousand Units
- TABLE 236 Europe Biophotonic Sensor Market, by Country, 2023 - 2030, Thousand Units
- TABLE 237 Europe Others Market, by Country, 2019 - 2022, USD Million
- TABLE 238 Europe Others Market, by Country, 2023 - 2030, USD Million
- TABLE 239 Europe Others Market, by Country, 2019 - 2022, Thousand Units
- TABLE 240 Europe Others Market, by Country, 2023 - 2030, Thousand Units
- TABLE 241 Europe Photonic Sensors Market, by Application, 2019 - 2022, USD Million
- TABLE 242 Europe Photonic Sensors Market, by Application, 2023 - 2030, USD Million
- TABLE 243 Europe Photonic Sensors Market, by Application, 2019 - 2022, Thousand Units
- TABLE 244 Europe Photonic Sensors Market, by Application, 2023 - 2030, Thousand Units
- TABLE 245 Europe Safety & Security Market, by Country, 2019 - 2022, USD Million
- TABLE 246 Europe Safety & Security Market, by Country, 2023 - 2030, USD Million
- TABLE 247 Europe Safety & Security Market, by Country, 2019 - 2022, Thousand Units
- TABLE 248 Europe Safety & Security Market, by Country, 2023 - 2030, Thousand Units
- TABLE 249 Europe Automotive & Transportation Market, by Country, 2019 - 2022, USD Million
- TABLE 250 Europe Automotive & Transportation Market, by Country, 2023 - 2030, USD Million
- TABLE 251 Europe Automotive & Transportation Market, by Country, 2019 - 2022, Thousand Units
- TABLE 252 Europe Automotive & Transportation Market, by Country, 2023 - 2030, Thousand Units
- TABLE 253 Europe Industrial Market, by Country, 2019 - 2022, USD Million
- TABLE 254 Europe Industrial Market, by Country, 2023 - 2030, USD Million
- TABLE 255 Europe Industrial Market, by Country, 2019 - 2022, Thousand Units
- TABLE 256 Europe Industrial Market, by Country, 2023 - 2030, Thousand Units
- TABLE 257 Europe Healthcare Market, by Country, 2019 - 2022, USD Million
- TABLE 258 Europe Healthcare Market, by Country, 2023 - 2030, USD Million
- TABLE 259 Europe Healthcare Market, by Country, 2019 - 2022, Thousand Units
- TABLE 260 Europe Healthcare Market, by Country, 2023 - 2030, Thousand Units
- TABLE 261 Europe Oil & Gas Market, by Country, 2019 - 2022, USD Million
- TABLE 262 Europe Oil & Gas Market, by Country, 2023 - 2030, USD Million
- TABLE 263 Europe Oil & Gas Market, by Country, 2019 - 2022, Thousand Units
- TABLE 264 Europe Oil & Gas Market, by Country, 2023 - 2030, Thousand Units
- TABLE 265 Europe Energy & Infrastructure Market, by Country, 2019 - 2022, USD Million
- TABLE 266 Europe Energy & Infrastructure Market, by Country, 2023 - 2030, USD Million
- TABLE 267 Europe Energy & Infrastructure Market, by Country, 2019 - 2022, Thousand Units
- TABLE 268 Europe Energy & Infrastructure Market, by Country, 2023 - 2030, Thousand Units
- TABLE 269 Europe Others Market, by Country, 2019 - 2022, USD Million
- TABLE 270 Europe Others Market, by Country, 2023 - 2030, USD Million
- TABLE 271 Europe Others Market, by Country, 2019 - 2022, Thousand Units
- TABLE 272 Europe Others Market, by Country, 2023 - 2030, Thousand Units
- TABLE 273 Europe Photonic Sensors Market, by Technology, 2019 - 2022, USD Million
- TABLE 274 Europe Photonic Sensors Market, by Technology, 2023 - 2030, USD Million
- TABLE 275 Europe Photonic Sensors Market, by Technology, 2019 - 2022, Thousand Units
- TABLE 276 Europe Photonic Sensors Market, by Technology, 2023 - 2030, Thousand Units
- TABLE 277 Europe Fiber Optic Technology Market, by Country, 2019 - 2022, USD Million
- TABLE 278 Europe Fiber Optic Technology Market, by Country, 2023 - 2030, USD Million
- TABLE 279 Europe Fiber Optic Technology Market, by Country, 2019 - 2022, Thousand Units
- TABLE 280 Europe Fiber Optic Technology Market, by Country, 2023 - 2030, Thousand Units
- TABLE 281 Europe Laser Technology Market, by Country, 2019 - 2022, USD Million
- TABLE 282 Europe Laser Technology Market, by Country, 2023 - 2030, USD Million
- TABLE 283 Europe Laser Technology Market, by Country, 2019 - 2022, Thousand Units
- TABLE 284 Europe Laser Technology Market, by Country, 2023 - 2030, Thousand Units
- TABLE 285 Europe Biophotonic Technology Market, by Country, 2019 - 2022, USD Million
- TABLE 286 Europe Biophotonic Technology Market, by Country, 2023 - 2030, USD Million
- TABLE 287 Europe Biophotonic Technology Market, by Country, 2019 - 2022, Thousand Units
- TABLE 288 Europe Biophotonic Technology Market, by Country, 2023 - 2030, Thousand Units
- TABLE 289 Europe Photonic Sensors Market, by Country, 2019 - 2022, USD Million
- TABLE 290 Europe Photonic Sensors Market, by Country, 2023 - 2030, USD Million
- TABLE 291 Europe Photonic Sensors Market, by Country, 2019 - 2022, Thousand Units
- TABLE 292 Europe Photonic Sensors Market, by Country, 2023 - 2030, Thousand Units
The Global Photonic Sensors Market size is expected to reach $80.5 billion by 2030, rising at a market growth of 14.5% CAGR during the forecast period. In the year 2022, the market attained a volume of 2,82,376.8 thousand units, experiencing a growth of 15.7% (2019-2022).
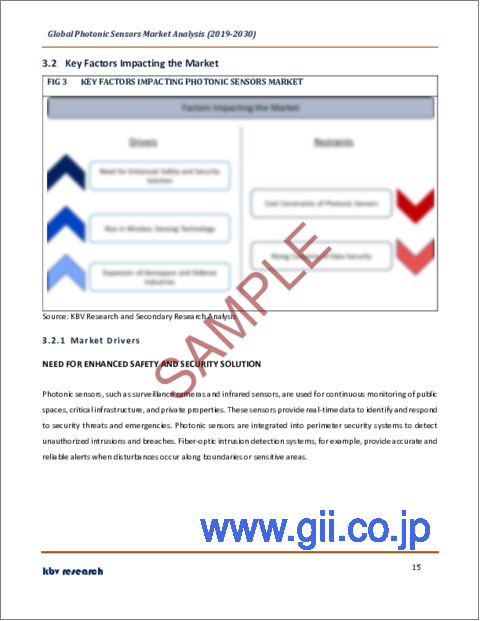
Photonic sensors are integrated into aircraft instrumentation systems to monitor critical parameters such as altitude, airspeed, and attitude. Consequently, the Safety & Security segment captured $9,950.3 million revenue in the market in 2022. Photonic sensors, including laser-based and infrared imaging, are used in missile guidance and targeting systems. They provide accurate data for tracking and engaging enemy targets. They are essential in night vision goggles, scopes, and thermal imaging devices used by military personnel. They contribute to safe and efficient flight operations. These sensors, including optical and infrared cameras, are widely used in UAVs for surveillance, reconnaissance, and target identification. They provide real-time situational awareness to military personnel. Some of the factors impacting the market are the need for enhanced safety and security solutions, rise in wireless sensing technology and cost constraints of these sensors.
Photonic sensors, such as surveillance cameras and infrared sensors, are used for continuous monitoring of public spaces, critical infrastructure, and private properties. These sensors provide real-time data to identify and respond to security threats and emergencies. They are integrated into perimeter security systems to detect unauthorized intrusions and breaches. Fiber-optic intrusion detection systems, for example, provide accurate and reliable alerts when disturbances occur along boundaries or sensitive areas. Additionally, Wireless sensing technology enables them to be deployed in remote or hard-to-reach locations, such as offshore oil platforms, bridges, and environmental monitoring sites. Data can be collected and transmitted wirelessly, allowing real-time monitoring and control without physical access. Wireless photonic sensors eliminate the need for extensive cabling and infrastructure, leading to cost savings in installation and maintenance. They are deployed in smart energy grids to monitor power distribution and manage energy resources more efficiently. This helps reduce energy waste and improve grid reliability. As wireless sensing technology continues to evolve, the market is expected to experience further growth.
However, many industries, including manufacturing, consumer electronics, and agriculture, are highly price sensitive. High upfront costs for photonic sensor technology can deter potential users, limiting market penetration. In a competitive market, photonic sensor manufacturers may face pressure to reduce prices to remain competitive. This can impact profit margins and may necessitate cost-saving measures. End users often evaluate the return on investment (ROI) for photonic sensor deployments. Continuous research and development are crucial for advancing photonic sensor technologies. The cost of staying at the forefront of innovation can be a challenge for manufacturers. Some applications, such as consumer electronics and agriculture, have strict cost limitations. These sensors may be excluded from certain applications due to their cost constraints. The above factors will hamper the market growth.
Product Outlook
On the basis of product, the market is segmented into fiber optic sensor, image sensor, biophotonic sensor, and others. The image sensor segment garnered a significant revenue share in the market in 2022. Image sensors can capture images at different frame rates, determining the smoothness of video motion. Higher frame rates are essential for applications like video recording and high-speed photography. A higher dynamic range is desirable for capturing scenes with a broad range of lighting conditions. Image sensors are at the core of modern digital imaging technology, and their performance continues to improve, enabling higher-quality images, more accurate colour reproduction, and better low-light performance in a wide range of consumer and industrial devices.
Application Outlook
On the basis of application, the market is divided into safety & security, industrial, automation & transportation, healthcare, energy & infrastructure, oil & gas, and others. The industrial process segment garnered a significant revenue share in the market in 2022. Infrared (IR) thermometers and thermal imaging cameras use these sensors to measure the temperature of machinery, equipment, and materials. They are used in industrial processes like hydraulic systems, chemical processing, and oil and gas operations. They provide precise measurements and data that enable better process control, quality assurance, and maintenance, ultimately contributing to increased productivity and reduced operational costs.
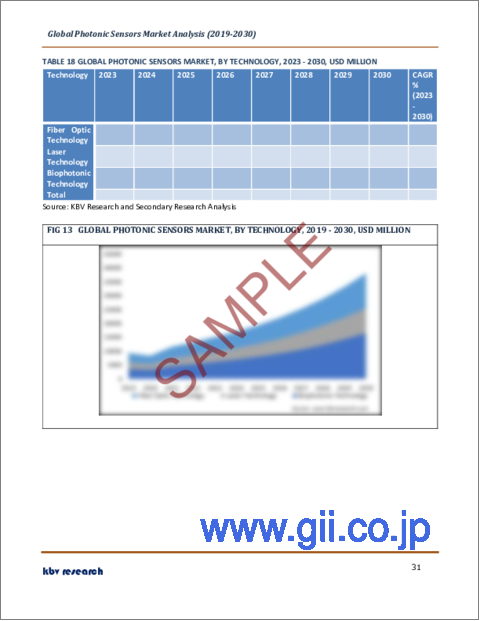
Technology Outlook
Based on technology, the market is segmented into fiber optic technology, laser technology, and biophotonic technology. The biophotonic technology segment acquired a considerable revenue share in the market in 2022. It enables fluorescence microscopy to visualize and study cellular and molecular structures. Biophotonic technology can be applied to monitor environmental parameters such as water quality and pollution levels. It plays a critical role in understanding fundamental biological processes and developing practical solutions for healthcare and life sciences. Ongoing developments in biophotonic technology hold promise for further enhancing the ability to explore and manipulate biological systems.
Regional Outlook
Region-wise, the market is analyzed across North America, Europe, Asia Pacific, and LAMEA. The Asia Pacific region covered a considerable revenue share in the market in 2022. It is expected that the Asia-Pacific region will experience the most substantial growth rate throughout the projected timeframe. In recent years, the economies of Korea and China have experienced the most significant growth in photonics and lasers. This is due to the substantial transformation in the manufacturing sector of this region, particularly in these nations. Moreover, photonics and lasers are experiencing substantial expansion in the Asia-Pacific region, predominantly attributable to accelerated economic expansion and heightened manufacturing utilization of lasers.
The market research report covers the analysis of key stake holders of the market. Key companies profiled in the report include Baumer Holding AG, Banner Engineering Corporation, Honeywell International, Inc., Samsung Electronics Co., Ltd. (Samsung Group), Toshiba Corporation, Fujifilm Holdings Corporation, Motorola Solutions, Inc., General Electric Company, BAE Systems PLC and General Dynamics Corporation.
Strategies Deployed in Photonic Sensors Market
Oct-2023: Samsung Display Co., Ltd., a Samsung Electronics subsidiary, completed the acquisition of eMagin Corporation, a U.S.-based OLED microdisplay leader. This provided eMagin with the scale and technologies for accelerated growth and enhanced value for customers.
May-2023: Fujifilm Holdings Corporation acquired Entegris, Inc., an American provider of products and systems that purify, protect, and transport critical materials used in the semiconductor device fabrication process. Through this acquisition, Fujifilm would expand its range of electronic chemicals available to customers, including KMG's High-Performance Process Chemicals (HPPCs), which play a crucial role in the etching and cleaning of silicon wafers during semiconductor production.
Oct-2021: Honeywell International, Inc. released two new Bluetooth-connected gas detectors that offer continuous monitoring for dangerous gases even in snow, fog, rain, and other inclement weather. This innovation helps users keep their oil and gas, chemicals, and petrochemical sites safe.
Mar-2021: Honeywell International, Inc. completed the acquisition of Fiplex Communications, Inc., a worldwide manufacturer of telecommunication products. Through this acquisition, Honeywell enhanced its communications and building connectivity products.
Nov-2020: GE Healthcare, a subsidiary of General Electric Company, acquired Prismatic Sensors, a Swedish startup with deep silicon detector technology for photon-counting computed tomography (PCCT). Through this acquisition, GE expanded its silicon-related portfolio.
Dec-2019: Honeywell International, Inc. acquired Rebellion Photonics, a Houston-based provider of visual gas monitoring solutions for the oil and gas industries. The acquisition integrated Rebellion into Honeywell's Safety and Productivity Solutions and Performance Materials and Technologies businesses.
Scope of the Study
Market Segments covered in the Report:
By Product (Volume, Thousand Unit, USD Billion, 2019-30)
- Fiber Optic Sensor
- Image Sensor
- Biophotonic Sensor
- Others
By Application (Volume, Thousand Unit, USD Billion, 2019-30)
- Safety & Security
- Automotive & Transportation
- Industrial
- Healthcare
- Oil & Gas
- Energy & Infrastructure
- Others
By Technology (Volume, Thousand Unit, USD Billion, 2019-30)
- Fiber Optic Technology
- Laser Technology
- Biophotonic Technology
By Geography (Volume, Thousand Unit, USD Billion, 2019-30)
- North America
- US
- Canada
- Mexico
- Rest of North America
- Europe
- Germany
- UK
- France
- Russia
- Spain
- Italy
- Rest of Europe
- Asia Pacific
- China
- Japan
- India
- South Korea
- Singapore
- Malaysia
- Rest of Asia Pacific
- LAMEA
- Brazil
- Argentina
- UAE
- Saudi Arabia
- South Africa
- Nigeria
- Rest of LAMEA
Companies Profiled
- Baumer Holding AG
- Banner Engineering Corporation
- Honeywell International, Inc.
- Samsung Electronics Co., Ltd. (Samsung Group)
- Toshiba Corporation
- Fujifilm Holdings Corporation
- Motorola Solutions, Inc.
- General Electric Company
- BAE Systems PLC
- General Dynamics Corporation
Unique Offerings from KBV Research
- Exhaustive coverage
- Highest number of market tables and figures
- Subscription based model available
- Guaranteed best price
- Assured post sales research support with 10% customization free
Table of Contents
Chapter 1. Market Scope & Methodology
- 1.1 Market Definition
- 1.2 Objectives
- 1.3 Market Scope
- 1.4 Segmentation
- 1.4.1 Global Photonic Sensors Market, by Product
- 1.4.2 Global Photonic Sensors Market, by Application
- 1.4.3 Global Photonic Sensors Market, by Technology
- 1.4.4 Global Photonic Sensors Market, by Geography
- 1.5 Methodology for the research
Chapter 2. Market at a Glance
- 2.1 Key Highlights
Chapter 3. Market Overview
- 3.1 Introduction
- 3.1.1 Overview
- 3.1.1.1 Market Composition and Scenario
- 3.1.1 Overview
- 3.2 Key Factors Impacting the Market
- 3.2.1 Market Drivers
- 3.2.2 Market Restraints
- 3.3 Porter's Five Forces Analysis
Chapter 4. Strategies Deployed in Photonic Sensors Market
Chapter 5. Global Photonic Sensors Market, by Product
- 5.1 Global Fiber Optic Sensor Market, by Region
- 5.2 Global Image Sensor Market, by Region
- 5.3 Global Biophotonic Sensor Market, by Region
- 5.4 Global Others Market, by Region
Chapter 6. Global Photonic Sensors Market, by Application
- 6.1 Global Safety & Security Market, by Region
- 6.2 Global Automotive & Transportation Market, by Region
- 6.3 Global Industrial Market, by Region
- 6.4 Global Healthcare Market, by Region
- 6.5 Global Oil & Gas Market, by Region
- 6.6 Global Energy & Infrastructure Market, by Region
- 6.7 Global Others Market, by Region
Chapter 7. Global Photonic Sensors Market, by Technology
- 7.1 Global Fiber Optic Technology Market, by Region
- 7.2 Global Laser Technology Market, by Region
- 7.3 Global Biophotonic Technology Market, by Region
Chapter 8. Global Photonic Sensors Market, by Region
- 8.1 North America Photonic Sensors Market
- 8.1.1 North America Photonic Sensors Market, by Product
- 8.1.1.1 North America Fiber Optic Sensor Market, by Country
- 8.1.1.2 North America Image Sensor Market, by Country
- 8.1.1.3 North America Biophotonic Sensor Market, by Country
- 8.1.1.4 North America Others Market, by Country
- 8.1.2 North America Photonic Sensors Market, by Application
- 8.1.2.1 North America Safety & Security Market, by Country
- 8.1.2.2 North America Automotive & Transportation Market, by Country
- 8.1.2.3 North America Industrial Market, by Country
- 8.1.2.4 North America Healthcare Market, by Country
- 8.1.2.5 North America Oil & Gas Market, by Country
- 8.1.2.6 North America Energy & Infrastructure Market, by Country
- 8.1.2.7 North America Others Market, by Country
- 8.1.3 North America Photonic Sensors Market, by Technology
- 8.1.3.1 North America Fiber Optic Technology Market, by Country
- 8.1.3.2 North America Laser Technology Market, by Country
- 8.1.3.3 North America Biophotonic Technology Market, by Country
- 8.1.4 North America Photonic Sensors Market, by Country
- 8.1.4.1 US Photonic Sensors Market
- 8.1.4.1.1 US Photonic Sensors Market, by Product
- 8.1.4.1.2 US Photonic Sensors Market, by Application
- 8.1.4.1.3 US Photonic Sensors Market, by Technology
- 8.1.4.2 Canada Photonic Sensors Market
- 8.1.4.2.1 Canada Photonic Sensors Market, by Product
- 8.1.4.2.2 Canada Photonic Sensors Market, by Application
- 8.1.4.2.3 Canada Photonic Sensors Market, by Technology
- 8.1.4.3 Mexico Photonic Sensors Market
- 8.1.4.3.1 Mexico Photonic Sensors Market, by Product
- 8.1.4.3.2 Mexico Photonic Sensors Market, by Application
- 8.1.4.3.3 Mexico Photonic Sensors Market, by Technology
- 8.1.4.4 Rest of North America Photonic Sensors Market
- 8.1.4.4.1 Rest of North America Photonic Sensors Market, by Product
- 8.1.4.4.2 Rest of North America Photonic Sensors Market, by Application
- 8.1.4.4.3 Rest of North America Photonic Sensors Market, by Technology
- 8.1.4.1 US Photonic Sensors Market
- 8.1.1 North America Photonic Sensors Market, by Product
- 8.2 Europe Photonic Sensors Market
- 8.2.1 Europe Photonic Sensors Market, by Product
- 8.2.1.1 Europe Fiber Optic Sensor Market, by Country
- 8.2.1.2 Europe Image Sensor Market, by Country
- 8.2.1.3 Europe Biophotonic Sensor Market, by Country
- 8.2.1.4 Europe Others Market, by Country
- 8.2.2 Europe Photonic Sensors Market, by Application
- 8.2.2.1 Europe Safety & Security Market, by Country
- 8.2.2.2 Europe Automotive & Transportation Market, by Country
- 8.2.2.3 Europe Industrial Market, by Country
- 8.2.2.4 Europe Healthcare Market, by Country
- 8.2.2.5 Europe Oil & Gas Market, by Country
- 8.2.2.6 Europe Energy & Infrastructure Market, by Country
- 8.2.2.7 Europe Others Market, by Country
- 8.2.3 Europe Photonic Sensors Market, by Technology
- 8.2.3.1 Europe Fiber Optic Technology Market, by Country
- 8.2.3.2 Europe Laser Technology Market, by Country
- 8.2.3.3 Europe Biophotonic Technology Market, by Country
- 8.2.4 Europe Photonic Sensors Market, by Country
- 8.2.4.1 Germany Photonic Sensors Market
- 8.2.4.1.1 Germany Photonic Sensors Market, by Product
- 8.2.4.1.2 Germany Photonic Sensors Market, by Application
- 8.2.4.1.3 Germany Photonic Sensors Market, by Technology
- 8.2.4.2 UK Photonic Sensors Market
- 8.2.4.2.1 UK Photonic Sensors Market, by Product
- 8.2.4.2.2 UK Photonic Sensors Market, by Application
- 8.2.4.2.3 UK Photonic Sensors Market, by Technology
- 8.2.4.3 France Photonic Sensors Market
- 8.2.4.3.1 France Photonic Sensors Market, by Product
- 8.2.4.3.2 France Photonic Sensors Market, by Application
- 8.2.4.3.3 France Photonic Sensors Market, by Technology
- 8.2.4.4 Russia Photonic Sensors Market
- 8.2.4.4.1 Russia Photonic Sensors Market, by Product
- 8.2.4.4.2 Russia Photonic Sensors Market, by Application
- 8.2.4.4.3 Russia Photonic Sensors Market, by Technology
- 8.2.4.5 Spain Photonic Sensors Market
- 8.2.4.5.1 Spain Photonic Sensors Market, by Product
- 8.2.4.5.2 Spain Photonic Sensors Market, by Application
- 8.2.4.5.3 Spain Photonic Sensors Market, by Technology
- 8.2.4.6 Italy Photonic Sensors Market
- 8.2.4.6.1 Italy Photonic Sensors Market, by Product
- 8.2.4.6.2 Italy Photonic Sensors Market, by Application
- 8.2.4.6.3 Italy Photonic Sensors Market, by Technology
- 8.2.4.7 Rest of Europe Photonic Sensors Market
- 8.2.4.7.1 Rest of Europe Photonic Sensors Market, by Product
- 8.2.4.7.2 Rest of Europe Photonic Sensors Market, by Application
- 8.2.4.7.3 Rest of Europe Photonic Sensors Market, by Technology
- 8.2.4.1 Germany Photonic Sensors Market
- 8.2.1 Europe Photonic Sensors Market, by Product
- 8.3 Asia Pacific Photonic Sensors Market
- 8.3.1 Asia Pacific Photonic Sensors Market, by Product
- 8.3.1.1 Asia Pacific Fiber Optic Sensor Market, by Country
- 8.3.1.2 Asia Pacific Image Sensor Market, by Country
- 8.3.1.3 Asia Pacific Biophotonic Sensor Market, by Country
- 8.3.1.4 Asia Pacific Others Market, by Country
- 8.3.2 Asia Pacific Photonic Sensors Market, by Application
- 8.3.2.1 Asia Pacific Safety & Security Market, by Country
- 8.3.2.2 Asia Pacific Automotive & Transportation Market, by Country
- 8.3.2.3 Asia Pacific Industrial Market, by Country
- 8.3.2.4 Asia Pacific Healthcare Market, by Country
- 8.3.2.5 Asia Pacific Oil & Gas Market, by Country
- 8.3.2.6 Asia Pacific Energy & Infrastructure Market, by Country
- 8.3.2.7 Asia Pacific Others Market, by Country
- 8.3.3 Asia Pacific Photonic Sensors Market, by Technology
- 8.3.3.1 Asia Pacific Fiber Optic Technology Market, by Country
- 8.3.3.2 Asia Pacific Laser Technology Market, by Country
- 8.3.3.3 Asia Pacific Biophotonic Technology Market, by Country
- 8.3.4 Asia Pacific Photonic Sensors Market, by Country
- 8.3.4.1 China Photonic Sensors Market
- 8.3.4.1.1 China Photonic Sensors Market, by Product
- 8.3.4.1.2 China Photonic Sensors Market, by Application
- 8.3.4.1.3 China Photonic Sensors Market, by Technology
- 8.3.4.2 Japan Photonic Sensors Market
- 8.3.4.2.1 Japan Photonic Sensors Market, by Product
- 8.3.4.2.2 Japan Photonic Sensors Market, by Application
- 8.3.4.2.3 Japan Photonic Sensors Market, by Technology
- 8.3.4.3 India Photonic Sensors Market
- 8.3.4.3.1 India Photonic Sensors Market, by Product
- 8.3.4.3.2 India Photonic Sensors Market, by Application
- 8.3.4.3.3 India Photonic Sensors Market, by Technology
- 8.3.4.4 South Korea Photonic Sensors Market
- 8.3.4.4.1 South Korea Photonic Sensors Market, by Product
- 8.3.4.4.2 South Korea Photonic Sensors Market, by Application
- 8.3.4.4.3 South Korea Photonic Sensors Market, by Technology
- 8.3.4.5 Taiwan Photonic Sensors Market
- 8.3.4.5.1 Taiwan Photonic Sensors Market, by Product
- 8.3.4.5.2 Taiwan Photonic Sensors Market, by Application
- 8.3.4.5.3 Taiwan Photonic Sensors Market, by Technology
- 8.3.4.6 Malaysia Photonic Sensors Market
- 8.3.4.6.1 Malaysia Photonic Sensors Market, by Product
- 8.3.4.6.2 Malaysia Photonic Sensors Market, by Application
- 8.3.4.6.3 Malaysia Photonic Sensors Market, by Technology
- 8.3.4.7 Rest of Asia Pacific Photonic Sensors Market
- 8.3.4.7.1 Rest of Asia Pacific Photonic Sensors Market, by Product
- 8.3.4.7.2 Rest of Asia Pacific Photonic Sensors Market, by Application
- 8.3.4.7.3 Rest of Asia Pacific Photonic Sensors Market, by Technology
- 8.3.4.1 China Photonic Sensors Market
- 8.3.1 Asia Pacific Photonic Sensors Market, by Product
- 8.4 LAMEA Photonic Sensors Market
- 8.4.1 LAMEA Photonic Sensors Market, by Product
- 8.4.1.1 LAMEA Fiber Optic Sensor Market, by Country
- 8.4.1.2 LAMEA Image Sensor Market, by Country
- 8.4.1.3 LAMEA Biophotonic Sensor Market, by Country
- 8.4.1.4 LAMEA Others Market, by Country
- 8.4.2 LAMEA Photonic Sensors Market, by Application
- 8.4.2.1 LAMEA Safety & Security Market, by Country
- 8.4.2.2 LAMEA Automotive & Transportation Market, by Country
- 8.4.2.3 LAMEA Industrial Market, by Country
- 8.4.2.4 LAMEA Healthcare Market, by Country
- 8.4.2.5 LAMEA Oil & Gas Market, by Country
- 8.4.2.6 LAMEA Energy & Infrastructure Market, by Country
- 8.4.2.7 LAMEA Others Market, by Country
- 8.4.3 LAMEA Photonic Sensors Market, by Technology
- 8.4.3.1 LAMEA Fiber Optic Technology Market, by Country
- 8.4.3.2 LAMEA Laser Technology Market, by Country
- 8.4.3.3 LAMEA Biophotonic Technology Market, by Country
- 8.4.4 LAMEA Photonic Sensors Market, by Country
- 8.4.4.1 Brazil Photonic Sensors Market
- 8.4.4.1.1 Brazil Photonic Sensors Market, by Product
- 8.4.4.1.2 Brazil Photonic Sensors Market, by Application
- 8.4.4.1.3 Brazil Photonic Sensors Market, by Technology
- 8.4.4.2 Argentina Photonic Sensors Market
- 8.4.4.2.1 Argentina Photonic Sensors Market, by Product
- 8.4.4.2.2 Argentina Photonic Sensors Market, by Application
- 8.4.4.2.3 Argentina Photonic Sensors Market, by Technology
- 8.4.4.3 UAE Photonic Sensors Market
- 8.4.4.3.1 UAE Photonic Sensors Market, by Product
- 8.4.4.3.2 UAE Photonic Sensors Market, by Application
- 8.4.4.3.3 UAE Photonic Sensors Market, by Technology
- 8.4.4.4 Saudi Arabia Photonic Sensors Market
- 8.4.4.4.1 Saudi Arabia Photonic Sensors Market, by Product
- 8.4.4.4.2 Saudi Arabia Photonic Sensors Market, by Application
- 8.4.4.4.3 Saudi Arabia Photonic Sensors Market, by Technology
- 8.4.4.5 South Africa Photonic Sensors Market
- 8.4.4.5.1 South Africa Photonic Sensors Market, by Product
- 8.4.4.5.2 South Africa Photonic Sensors Market, by Application
- 8.4.4.5.3 South Africa Photonic Sensors Market, by Technology
- 8.4.4.6 Nigeria Photonic Sensors Market
- 8.4.4.6.1 Nigeria Photonic Sensors Market, by Product
- 8.4.4.6.2 Nigeria Photonic Sensors Market, by Application
- 8.4.4.6.3 Nigeria Photonic Sensors Market, by Technology
- 8.4.4.7 Rest of LAMEA Photonic Sensors Market
- 8.4.4.7.1 Rest of LAMEA Photonic Sensors Market, by Product
- 8.4.4.7.2 Rest of LAMEA Photonic Sensors Market, by Application
- 8.4.4.7.3 Rest of LAMEA Photonic Sensors Market, by Technology
- 8.4.4.1 Brazil Photonic Sensors Market
- 8.4.1 LAMEA Photonic Sensors Market, by Product
Chapter 9. Company Profiles
- 9.1 Baumer Holding AG
- 9.1.1 Company Overview
- 9.1.2 SWOT Analysis
- 9.2 Banner Engineering Corporation
- 9.2.1 Company Overview
- 9.2.2 SWOT Analysis
- 9.3 Honeywell International, Inc.
- 9.3.1 Company Overview
- 9.3.2 Financial Analysis
- 9.3.3 Segmental and Regional Analysis
- 9.3.4 Research & Development Expenses
- 9.3.5 Recent strategies and developments:
- 9.3.5.1 Product Launches and Product Expansions:
- 9.3.5.2 Acquisition and Mergers:
- 9.3.6 SWOT Analysis
- 9.4 Samsung Electronics Co., Ltd. (Samsung Group)
- 9.4.1 Company Overview
- 9.4.2 Financial Analysis
- 9.4.3 Segmental and Regional Analysis
- 9.4.4 Recent strategies and developments:
- 9.4.4.1 Acquisition and Mergers:
- 9.4.5 SWOT Analysis
- 9.5 Toshiba Corporation
- 9.5.1 Company Overview
- 9.5.2 Financial Analysis
- 9.5.3 Segmental and Regional Analysis
- 9.5.4 Research and Development Expense
- 9.5.5 SWOT Analysis
- 9.6 Fujifilm Holdings Corporation
- 9.6.1 Company Overview
- 9.6.2 Financial Analysis
- 9.6.3 Segmental and Regional Analysis
- 9.6.4 Research & Development Expenses
- 9.6.5 Recent strategies and developments:
- 9.6.5.1 Acquisition and Mergers:
- 9.6.6 SWOT Analysis
- 9.7 Motorola Solutions, Inc.
- 9.7.1 Company Overview
- 9.7.2 Financial Analysis
- 9.7.3 Regional & Segmental Analysis
- 9.7.4 Research & Development Expenses
- 9.7.5 SWOT Analysis
- 9.8 General Electric Company
- 9.8.1 Company Overview
- 9.8.2 Financial Analysis
- 9.8.3 Segmental and Regional Analysis
- 9.8.4 Research & Development Expense
- 9.8.5 Recent strategies and developments:
- 9.8.5.1 Acquisition and Mergers:
- 9.8.6 SWOT Analysis
- 9.9 BAE Systems PLC
- 9.9.1 Company Overview
- 9.9.2 Financial Analysis
- 9.9.3 Segmental and Regional Analysis
- 9.9.4 Research & Development Expenses
- 9.9.5 SWOT Analysis
- 9.10. General Dynamics Corporation
- 9.10.1 Company Overview
- 9.10.2 Financial Analysis
- 9.10.3 Segmental and Regional Analysis
- 9.10.4 Research & Development Expenses
- 9.10.5 SWOT Analysis