|
|
市場調査レポート
商品コード
1395708
イメージセンサーの世界市場規模、シェア、業界動向分析レポート:タイプ別、業種別、地域別展望と予測、2023年~2030年Global Image Sensor Market Size, Share & Industry Trends Analysis Report By Type (CMOS (Front Side Illuminated (FSI), and Back Side Illuminated (BSI)), and CCD), By Vertical, By Regional Outlook and Forecast, 2023 - 2030 |
||||||
|
|
|||||||


| イメージセンサーの世界市場規模、シェア、業界動向分析レポート:タイプ別、業種別、地域別展望と予測、2023年~2030年 |
|
出版日: 2023年11月30日
発行: KBV Research
ページ情報: 英文 394 Pages
納期: 即納可能
|
- 全表示
- 概要
- 図表
- 目次
イメージセンサー市場規模は、予測期間中にCAGR 12.2%で成長し、2030年には643億米ドルに達すると予測されます。2022年の市場規模は6億4,355万200台、成長率は16.1%(2019-2022年)。
KBV Cardinalマトリックスに示された分析によると、サムスン電子が市場の先駆者です。2023年11月、サムスン電子は、102dBのダイナミックレンジの画像を生成する能力を持つイメージセンサーであるISOCELL GNKを発表しました。この新製品は、1.2ミクロンの画素サイズと、前身であるISOCELL GN1と同様の1/1.3インチセンサーフォーマットの50MPカメラという特徴を持ち、同時に3つの異なるISOモードによるダイナミックレンジを提供します。さらに、ISOCELL GNKは、Proモードで14ビットのRAW画像をキャプチャします。ソニー株式会社、STMicroelectronics N.V.、Canon, Inc.などの企業が、市場における主要なイノベーターです。
市場成長要因
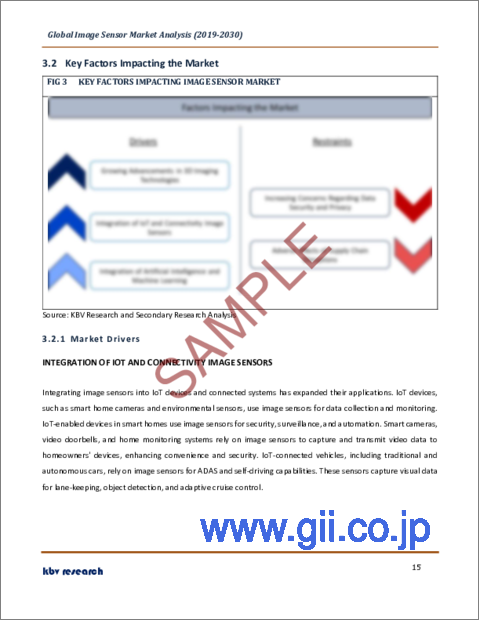
IoTとコネクティビティイメージセンサーの統合
イメージセンサーをIoTデバイスやコネクテッドシステムに統合することで、その用途が拡大しています。スマートホームカメラや環境センサーなどのIoTデバイスは、データ収集やモニタリングにこれらを使用しています。スマートホームのIoT対応デバイスは、セキュリティ、監視、自動化のためにこれらを使用します。スマートカメラ、ビデオドアベル、ホームモニタリングシステムは、これらを利用してビデオ・データをキャプチャし、住宅所有者のデバイスに送信することで、利便性とセキュリティを強化しています。IoTとコネクティビティイメージセンサーの統合により、市場は大きく拡大しています。
3Dイメージング技術の進歩
生体認証と顔認識は、ToFセンサーや構造化光を含む3Dイメージング技術によって可能になります。これらのセンサーは、セキュリティアプリケーション、入退室管理、モバイル機器に不可欠な、より安全で正確な個人識別方法を提供します。3D画像は、ゲーム、車載インフォテインメントシステム、ヒューマンマシンインターフェースなど、さまざまなアプリケーションでタッチレスジェスチャーコントロールを可能にします。ユーザーは物理的な接触なしに機器やシステムと対話することができ、ユーザー体験と安全性が向上します。3Dイメージング技術の進歩の結果、市場は大幅に拡大すると予想されます。
市場抑制要因
サプライチェーンの混乱による悪影響
サプライチェーンの混乱により、製造の遅れが生じる可能性があります。部品不足、輸送の中断、工場の閉鎖はすべて製造スケジュールに影響を及ぼし、製品入手の遅れを引き起こす可能性があります。サプライチェーンの混乱による重要な部品や原材料の不足は、コストを上昇させる可能性があります。製造業者は必要な投入資材を確保するためにより高い価格を支払うことになり、それが最終的に製品の価格設定に影響を及ぼす可能性があります。このように、サプライチェーンの混乱による悪影響は、市場の成長を鈍化させる可能性があります。
タイプ別展望
タイプ別に見ると、市場はCMOSとCCDに二分されます。2022年の市場では、CCDセグメントがかなりの収益シェアを占めています。CCDセンサーは通常、低い読み取りノイズと暗電流を示し、低照度条件下でもノイズのないクリーンな画像を実現します。この低ノイズ性能は、天体写真や顕微鏡など、長時間の露光が必要なアプリケーションに有利です。CCDセンサーは、暗い天体の撮影、化学反応の研究、生物発光現象の撮影など、長時間露光を必要とする用途に適しています。
CMOSの展望
CMOSタイプでは、市場は前面照射型(FSI)と背面照射型(BSI)に区分されます。2022年には、前面照射型(FSI)セグメントが市場で最大の収益シェアを占めました。FSIイメージセンサーは、入射光に対する感度を最大化するように設計されています。この結果、低照度性能が向上し、FSIセンサーは十分な照明が課題であるアプリケーションに最適です。光感度の向上は、低照度下での写真撮影やビデオ撮影、監視、医療用画像処理において特に有益です。FSIイメージセンサーは信頼性と性能において実績があり、多くの業界で信頼されています。
業種別展望
業種別では、コンシューマーエレクトロニクス、防衛・航空宇宙、医療、産業、自動車、セキュリティ・監視、その他に分類されます。2022年には、コンシューマーエレクトロニクスセグメントが最大の収益シェアで市場を独占しました。冒険やスポーツ活動を撮影するために使用されるアクションカメラの人気は、コンパクトで高性能なイメージセンサーの需要増につながっています。これらのセンサーは、優れた画質を実現し、さまざまな環境条件に対応する必要があります。スマートドアベルやセキュリティカメラなどのモノのインターネット(IoT)デバイスは、モニタリングや監視のためにこれらを使用しています。
地域別展望
地域別に見ると、市場は北米、欧州、アジア太平洋、LAMEAで分析されます。2022年には、アジア太平洋地域が最も高い収益シェアを獲得して市場をリードしました。アジア太平洋地域は、世界の自動車セクターにおいて著名なプレーヤーです。これらは、ADAS、バックカメラ、車内モニタリングのために自動車に使用されています。安全でスマートな自動車に対する需要の高まりが、画像センサーの採用を後押ししています。アジア太平洋地域の農業は、精密農業や作物モニタリングのために画像センサーの恩恵を受けています。ドローンや農業機械は、作物の健康評価や収穫量の最適化などの作業にこれらのセンサーを使用しています。
目次
第1章 市場範囲と調査手法
- 市場の定義
- 目的
- 市場範囲
- セグメンテーション
- 調査手法
第2章 市場要覧
- 主なハイライト
第3章 市場概要
- イントロダクション
- 概要
- 市場構成とシナリオ
- 概要
- 市場に影響を与える主な要因
- 市場促進要因
- 市場抑制要因
第4章 競合分析-世界
- KBV Cardinal Matrix
- 最近の業界全体の戦略的展開
- パートナーシップ、コラボレーション、および契約
- 製品の発売と製品の拡大
- 地理的拡大
- 市場シェア分析、2022年
- 主要成功戦略
- 主な戦略
- 主要な戦略的動き
- ポーターのファイブフォース分析
第5章 世界のイメージセンサー市場:タイプ別
- 世界のCMOS市場:地域別
- 世界のイメージセンサー市場:CMOSタイプ別
- 世界の前面照射型(FSI)市場:地域別
- 世界の裏面照射型(BSI)市場:地域別
- 世界のCCD市場:地域別
第6章 世界のイメージセンサー市場:業種別
- 世界のコンシューマーエレクトロニクス市場:地域別
- 世界の自動車市場:地域別
- 世界の防衛・航空宇宙市場:地域別
- 世界の産業市場:地域別
- 世界の医療市場:地域別
- 世界のセキュリティ・監視市場:地域別
- 世界のその他の市場:地域別
第7章 世界のイメージセンサー市場:地域別
- 北米の市場
- 欧州の市場
- アジア太平洋の市場
- ラテンアメリカ・中東・アフリカの市場
第8章 企業プロファイル
- Sony Corporation
- Samsung Electronics Co, Ltd.(Samsung Group)
- OmniVision Technologies, Inc
- STMicroelectronics NV
- ON Semiconductor Corporation
- Panasonic Holdings Corporation
- Canon, Inc
- GalaxyCore Shanghai Limited Corporation
- PixArt Imaging, Inc
- Toshiba Corporation
第9章 市場の成功必須条件
LIST OF TABLES
- TABLE 1 Global Image Sensor Market, 2019 - 2022, USD Million
- TABLE 2 Global Image Sensor Market, 2023 - 2030, USD Million
- TABLE 3 Global Image Sensor Market, 2019 - 2022, Thousand Units
- TABLE 4 Global Image Sensor Market, 2023 - 2030, Thousand Units
- TABLE 5 Partnerships, Collaborations and Agreements- Image Sensor Market
- TABLE 6 Product Launches And Product Expansions- Image Sensor Market
- TABLE 7 Geographical Expansions - Image Sensor Market
- TABLE 8 Global Image Sensor Market, By Type, 2019 - 2022, USD Million
- TABLE 9 Global Image Sensor Market, By Type, 2023 - 2030, USD Million
- TABLE 10 Global Image Sensor Market, By Type, 2019 - 2022, Thousand Units
- TABLE 11 Global Image Sensor Market, By Type, 2023 - 2030, Thousand Units
- TABLE 12 Global CMOS Market, By Region, 2019 - 2022, USD Million
- TABLE 13 Global CMOS Market, By Region, 2023 - 2030, USD Million
- TABLE 14 Global CMOS Market, By Region, 2019 - 2022, Thousand Units
- TABLE 15 Global CMOS Market, By Region, 2023 - 2030, Thousand Units
- TABLE 16 Global Image Sensor Market, By CMOS Type, 2019 - 2022, USD Million
- TABLE 17 Global Image Sensor Market, By CMOS Type, 2023 - 2030, USD Million
- TABLE 18 Global Image Sensor Market, By CMOS Type, 2019 - 2022, Thousand Units
- TABLE 19 Global Image Sensor Market, By CMOS Type, 2023 - 2030, Thousand Units
- TABLE 20 Global Front Side Illuminated (FSI) Market, By Region, 2019 - 2022, USD Million
- TABLE 21 Global Front Side Illuminated (FSI) Market, By Region, 2023 - 2030, USD Million
- TABLE 22 Global Front Side Illuminated (FSI) Market, By Region, 2019 - 2022, Thousand Units
- TABLE 23 Global Front Side Illuminated (FSI) Market, By Region, 2023 - 2030, Thousand Units
- TABLE 24 Global Back Side Illuminated (BSI) Market, By Region, 2019 - 2022, USD Million
- TABLE 25 Global Back Side Illuminated (BSI) Market, By Region, 2023 - 2030, USD Million
- TABLE 26 Global Back Side Illuminated (BSI) Market, By Region, 2019 - 2022, Thousand Units
- TABLE 27 Global Back Side Illuminated (BSI) Market, By Region, 2023 - 2030, Thousand Units
- TABLE 28 Global CCD Market, By Region, 2019 - 2022, USD Million
- TABLE 29 Global CCD Market, By Region, 2023 - 2030, USD Million
- TABLE 30 Global CCD Market, By Region, 2019 - 2022, Thousand Units
- TABLE 31 Global CCD Market, By Region, 2023 - 2030, Thousand Units
- TABLE 32 Global Image Sensor Market, By Vertical, 2019 - 2022, USD Million
- TABLE 33 Global Image Sensor Market, By Vertical, 2023 - 2030, USD Million
- TABLE 34 Global Image Sensor Market, By Vertical, 2019 - 2022, Thousand Units
- TABLE 35 Global Image Sensor Market, By Vertical, 2023 - 2030, Thousand Units
- TABLE 36 Global Consumer Electronics Market, By Region, 2019 - 2022, USD Million
- TABLE 37 Global Consumer Electronics Market, By Region, 2023 - 2030, USD Million
- TABLE 38 Global Consumer Electronics Market, By Region, 2019 - 2022, Thousand Units
- TABLE 39 Global Consumer Electronics Market, By Region, 2023 - 2030, Thousand Units
- TABLE 40 Global Automotive Market, By Region, 2019 - 2022, USD Million
- TABLE 41 Global Automotive Market, By Region, 2023 - 2030, USD Million
- TABLE 42 Global Automotive Market, By Region, 2019 - 2022, Thousand Units
- TABLE 43 Global Automotive Market, By Region, 2023 - 2030, Thousand Units
- TABLE 44 Global Defense & Aerospace Market, By Region, 2019 - 2022, USD Million
- TABLE 45 Global Defense & Aerospace Market, By Region, 2023 - 2030, USD Million
- TABLE 46 Global Defense & Aerospace Market, By Region, 2019 - 2022, Thousand Units
- TABLE 47 Global Defense & Aerospace Market, By Region, 2023 - 2030, Thousand Units
- TABLE 48 Global Industrial Market, By Region, 2019 - 2022, USD Million
- TABLE 49 Global Industrial Market, By Region, 2023 - 2030, USD Million
- TABLE 50 Global Industrial Market, By Region, 2019 - 2022, Thousand Units
- TABLE 51 Global Industrial Market, By Region, 2023 - 2030, Thousand Units
- TABLE 52 Global Medical Market, By Region, 2019 - 2022, USD Million
- TABLE 53 Global Medical Market, By Region, 2023 - 2030, USD Million
- TABLE 54 Global Medical Market, By Region, 2019 - 2022, Thousand Units
- TABLE 55 Global Medical Market, By Region, 2023 - 2030, Thousand Units
- TABLE 56 Global Security & Surveillance Market, By Region, 2019 - 2022, USD Million
- TABLE 57 Global Security & Surveillance Market, By Region, 2023 - 2030, USD Million
- TABLE 58 Global Security & Surveillance Market, By Region, 2019 - 2022, Thousand Units
- TABLE 59 Global Security & Surveillance Market, By Region, 2023 - 2030, Thousand Units
- TABLE 60 Global Others Market, By Region, 2019 - 2022, USD Million
- TABLE 61 Global Others Market, By Region, 2023 - 2030, USD Million
- TABLE 62 Global Others Market, By Region, 2019 - 2022, Thousand Units
- TABLE 63 Global Others Market, By Region, 2023 - 2030, Thousand Units
- TABLE 64 Global Image Sensor Market, By Region, 2019 - 2022, USD Million
- TABLE 65 Global Image Sensor Market, By Region, 2023 - 2030, USD Million
- TABLE 66 Global Image Sensor Market, By Region, 2019 - 2022, Thousand Units
- TABLE 67 Global Image Sensor Market, By Region, 2023 - 2030, Thousand Units
- TABLE 68 North America Image Sensor Market, 2019 - 2022, USD Million
- TABLE 69 North America Image Sensor Market, 2023 - 2030, USD Million
- TABLE 70 North America Image Sensor Market, 2019 - 2022, Thousand Units
- TABLE 71 North America Image Sensor Market, 2023 - 2030, Thousand Units
- TABLE 72 North America Image Sensor Market, By Type, 2019 - 2022, USD Million
- TABLE 73 North America Image Sensor Market, By Type, 2023 - 2030, USD Million
- TABLE 74 North America Image Sensor Market, By Type, 2019 - 2022, Thousand Units
- TABLE 75 North America Image Sensor Market, By Type, 2023 - 2030, Thousand Units
- TABLE 76 North America CMOS Market, By Country, 2019 - 2022, USD Million
- TABLE 77 North America CMOS Market, By Country, 2023 - 2030, USD Million
- TABLE 78 North America CMOS Market, By Country, 2019 - 2022, Thousand Units
- TABLE 79 North America CMOS Market, By Country, 2023 - 2030, Thousand Units
- TABLE 80 North America Image Sensor Market, By CMOS Type, 2019 - 2022, USD Million
- TABLE 81 North America Image Sensor Market, By CMOS Type, 2023 - 2030, USD Million
- TABLE 82 North America Image Sensor Market, By CMOS Type, 2019 - 2022, Thousand Units
- TABLE 83 North America Image Sensor Market, By CMOS Type, 2023 - 2030, Thousand Units
- TABLE 84 North America Front Side Illuminated (FSI) Market, By Country, 2019 - 2022, USD Million
- TABLE 85 North America Front Side Illuminated (FSI) Market, By Country, 2023 - 2030, USD Million
- TABLE 86 North America Front Side Illuminated (FSI) Market, By Country, 2019 - 2022, Thousand Units
- TABLE 87 North America Front Side Illuminated (FSI) Market, By Country, 2023 - 2030, Thousand Units
- TABLE 88 North America Back Side Illuminated (BSI) Market, By Country, 2019 - 2022, USD Million
- TABLE 89 North America Back Side Illuminated (BSI) Market, By Country, 2023 - 2030, USD Million
- TABLE 90 North America Back Side Illuminated (BSI) Market, By Country, 2019 - 2022, Thousand Units
- TABLE 91 North America Back Side Illuminated (BSI) Market, By Country, 2023 - 2030, Thousand Units
- TABLE 92 North America CCD Market, By Country, 2019 - 2022, USD Million
- TABLE 93 North America CCD Market, By Country, 2023 - 2030, USD Million
- TABLE 94 North America CCD Market, By Country, 2019 - 2022, Thousand Units
- TABLE 95 North America CCD Market, By Country, 2023 - 2030, Thousand Units
- TABLE 96 North America Image Sensor Market, By Vertical, 2019 - 2022, USD Million
- TABLE 97 North America Image Sensor Market, By Vertical, 2023 - 2030, USD Million
- TABLE 98 North America Image Sensor Market, By Vertical, 2019 - 2022, Thousand Units
- TABLE 99 North America Image Sensor Market, By Vertical, 2023 - 2030, Thousand Units
- TABLE 100 North America Consumer Electronics Market, By Country, 2019 - 2022, USD Million
- TABLE 101 North America Consumer Electronics Market, By Country, 2023 - 2030, USD Million
- TABLE 102 North America Consumer Electronics Market, By Country, 2019 - 2022, Thousand Units
- TABLE 103 North America Consumer Electronics Market, By Country, 2023 - 2030, Thousand Units
- TABLE 104 North America Automotive Market, By Country, 2019 - 2022, USD Million
- TABLE 105 North America Automotive Market, By Country, 2023 - 2030, USD Million
- TABLE 106 North America Automotive Market, By Country, 2019 - 2022, Thousand Units
- TABLE 107 North America Automotive Market, By Country, 2023 - 2030, Thousand Units
- TABLE 108 North America Defense & Aerospace Market, By Country, 2019 - 2022, USD Million
- TABLE 109 North America Defense & Aerospace Market, By Country, 2023 - 2030, USD Million
- TABLE 110 North America Defense & Aerospace Market, By Country, 2019 - 2022, Thousand Units
- TABLE 111 North America Defense & Aerospace Market, By Country, 2023 - 2030, Thousand Units
- TABLE 112 North America Industrial Market, By Country, 2019 - 2022, USD Million
- TABLE 113 North America Industrial Market, By Country, 2023 - 2030, USD Million
- TABLE 114 North America Industrial Market, By Country, 2019 - 2022, Thousand Units
- TABLE 115 North America Industrial Market, By Country, 2023 - 2030, Thousand Units
- TABLE 116 North America Medical Market, By Country, 2019 - 2022, USD Million
- TABLE 117 North America Medical Market, By Country, 2023 - 2030, USD Million
- TABLE 118 North America Medical Market, By Country, 2019 - 2022, Thousand Units
- TABLE 119 North America Medical Market, By Country, 2023 - 2030, Thousand Units
- TABLE 120 North America Security & Surveillance Market, By Country, 2019 - 2022, USD Million
- TABLE 121 North America Security & Surveillance Market, By Country, 2023 - 2030, USD Million
- TABLE 122 North America Security & Surveillance Market, By Country, 2019 - 2022, Thousand Units
- TABLE 123 North America Security & Surveillance Market, By Country, 2023 - 2030, Thousand Units
- TABLE 124 North America Others Market, By Country, 2019 - 2022, USD Million
- TABLE 125 North America Others Market, By Country, 2023 - 2030, USD Million
- TABLE 126 North America Others Market, By Country, 2019 - 2022, Thousand Units
- TABLE 127 North America Others Market, By Country, 2023 - 2030, Thousand Units
- TABLE 128 North America Image Sensor Market, By Country, 2019 - 2022, USD Million
- TABLE 129 North America Image Sensor Market, By Country, 2023 - 2030, USD Million
- TABLE 130 North America Image Sensor Market, By Country, 2019 - 2022, Thousand Units
- TABLE 131 North America Image Sensor Market, By Country, 2023 - 2030, Thousand Units
- TABLE 132 US Image Sensor Market, 2019 - 2022, USD Million
- TABLE 133 US Image Sensor Market, 2023 - 2030, USD Million
- TABLE 134 US Image Sensor Market, 2019 - 2022, Thousand Units
- TABLE 135 US Image Sensor Market, 2023 - 2030, Thousand Units
- TABLE 136 US Image Sensor Market, By Type, 2019 - 2022, USD Million
- TABLE 137 US Image Sensor Market, By Type, 2023 - 2030, USD Million
- TABLE 138 US Image Sensor Market, By Type, 2019 - 2022, Thousand Units
- TABLE 139 US Image Sensor Market, By Type, 2023 - 2030, Thousand Units
- TABLE 140 US Image Sensor Market, By CMOS Type, 2019 - 2022, USD Million
- TABLE 141 US Image Sensor Market, By CMOS Type, 2023 - 2030, USD Million
- TABLE 142 US Image Sensor Market, By CMOS Type, 2019 - 2022, Thousand Units
- TABLE 143 US Image Sensor Market, By CMOS Type, 2023 - 2030, Thousand Units
- TABLE 144 US Image Sensor Market, By Vertical, 2019 - 2022, USD Million
- TABLE 145 US Image Sensor Market, By Vertical, 2023 - 2030, USD Million
- TABLE 146 US Image Sensor Market, By Vertical, 2019 - 2022, Thousand Units
- TABLE 147 US Image Sensor Market, By Vertical, 2023 - 2030, Thousand Units
- TABLE 148 Canada Image Sensor Market, 2019 - 2022, USD Million
- TABLE 149 Canada Image Sensor Market, 2023 - 2030, USD Million
- TABLE 150 Canada Image Sensor Market, 2019 - 2022, Thousand Units
- TABLE 151 Canada Image Sensor Market, 2023 - 2030, Thousand Units
- TABLE 152 Canada Image Sensor Market, By Type, 2019 - 2022, USD Million
- TABLE 153 Canada Image Sensor Market, By Type, 2023 - 2030, USD Million
- TABLE 154 Canada Image Sensor Market, By Type, 2019 - 2022, Thousand Units
- TABLE 155 Canada Image Sensor Market, By Type, 2023 - 2030, Thousand Units
- TABLE 156 Canada Image Sensor Market, By CMOS Type, 2019 - 2022, USD Million
- TABLE 157 Canada Image Sensor Market, By CMOS Type, 2023 - 2030, USD Million
- TABLE 158 Canada Image Sensor Market, By CMOS Type, 2019 - 2022, Thousand Units
- TABLE 159 Canada Image Sensor Market, By CMOS Type, 2023 - 2030, Thousand Units
- TABLE 160 Canada Image Sensor Market, By Vertical, 2019 - 2022, USD Million
- TABLE 161 Canada Image Sensor Market, By Vertical, 2023 - 2030, USD Million
- TABLE 162 Canada Image Sensor Market, By Vertical, 2019 - 2022, Thousand Units
- TABLE 163 Canada Image Sensor Market, By Vertical, 2023 - 2030, Thousand Units
- TABLE 164 Mexico Image Sensor Market, 2019 - 2022, USD Million
- TABLE 165 Mexico Image Sensor Market, 2023 - 2030, USD Million
- TABLE 166 Mexico Image Sensor Market, 2019 - 2022, Thousand Units
- TABLE 167 Mexico Image Sensor Market, 2023 - 2030, Thousand Units
- TABLE 168 Mexico Image Sensor Market, By Type, 2019 - 2022, USD Million
- TABLE 169 Mexico Image Sensor Market, By Type, 2023 - 2030, USD Million
- TABLE 170 Mexico Image Sensor Market, By Type, 2019 - 2022, Thousand Units
- TABLE 171 Mexico Image Sensor Market, By Type, 2023 - 2030, Thousand Units
- TABLE 172 Mexico Image Sensor Market, By CMOS Type, 2019 - 2022, USD Million
- TABLE 173 Mexico Image Sensor Market, By CMOS Type, 2023 - 2030, USD Million
- TABLE 174 Mexico Image Sensor Market, By CMOS Type, 2019 - 2022, Thousand Units
- TABLE 175 Mexico Image Sensor Market, By CMOS Type, 2023 - 2030, Thousand Units
- TABLE 176 Mexico Image Sensor Market, By Vertical, 2019 - 2022, USD Million
- TABLE 177 Mexico Image Sensor Market, By Vertical, 2023 - 2030, USD Million
- TABLE 178 Mexico Image Sensor Market, By Vertical, 2019 - 2022, Thousand Units
- TABLE 179 Mexico Image Sensor Market, By Vertical, 2023 - 2030, Thousand Units
- TABLE 180 Rest of North America Image Sensor Market, 2019 - 2022, USD Million
- TABLE 181 Rest of North America Image Sensor Market, 2023 - 2030, USD Million
- TABLE 182 Rest of North America Image Sensor Market, 2019 - 2022, Thousand Units
- TABLE 183 Rest of North America Image Sensor Market, 2023 - 2030, Thousand Units
- TABLE 184 Rest of North America Image Sensor Market, By Type, 2019 - 2022, USD Million
- TABLE 185 Rest of North America Image Sensor Market, By Type, 2023 - 2030, USD Million
- TABLE 186 Rest of North America Image Sensor Market, By Type, 2019 - 2022, Thousand Units
- TABLE 187 Rest of North America Image Sensor Market, By Type, 2023 - 2030, Thousand Units
- TABLE 188 Rest of North America Image Sensor Market, By CMOS Type, 2019 - 2022, USD Million
- TABLE 189 Rest of North America Image Sensor Market, By CMOS Type, 2023 - 2030, USD Million
- TABLE 190 Rest of North America Image Sensor Market, By CMOS Type, 2019 - 2022, Thousand Units
- TABLE 191 Rest of North America Image Sensor Market, By CMOS Type, 2023 - 2030, Thousand Units
- TABLE 192 Rest of North America Image Sensor Market, By Vertical, 2019 - 2022, USD Million
- TABLE 193 Rest of North America Image Sensor Market, By Vertical, 2023 - 2030, USD Million
- TABLE 194 Rest of North America Image Sensor Market, By Vertical, 2019 - 2022, Thousand Units
- TABLE 195 Rest of North America Image Sensor Market, By Vertical, 2023 - 2030, Thousand Units
- TABLE 196 Europe Image Sensor Market, 2019 - 2022, USD Million
- TABLE 197 Europe Image Sensor Market, 2023 - 2030, USD Million
- TABLE 198 Europe Image Sensor Market, 2019 - 2022, Thousand Units
- TABLE 199 Europe Image Sensor Market, 2023 - 2030, Thousand Units
- TABLE 200 Europe Image Sensor Market, By Type, 2019 - 2022, USD Million
- TABLE 201 Europe Image Sensor Market, By Type, 2023 - 2030, USD Million
- TABLE 202 Europe Image Sensor Market, By Type, 2019 - 2022, Thousand Units
- TABLE 203 Europe Image Sensor Market, By Type, 2023 - 2030, Thousand Units
- TABLE 204 Europe CMOS Market, By Country, 2019 - 2022, USD Million
- TABLE 205 Europe CMOS Market, By Country, 2023 - 2030, USD Million
- TABLE 206 Europe CMOS Market, By Country, 2019 - 2022, Thousand Units
- TABLE 207 Europe CMOS Market, By Country, 2023 - 2030, Thousand Units
- TABLE 208 Europe Image Sensor Market, By CMOS Type, 2019 - 2022, USD Million
- TABLE 209 Europe Image Sensor Market, By CMOS Type, 2023 - 2030, USD Million
- TABLE 210 Europe Image Sensor Market, By CMOS Type, 2019 - 2022, Thousand Units
- TABLE 211 Europe Image Sensor Market, By CMOS Type, 2023 - 2030, Thousand Units
- TABLE 212 Europe Front Side Illuminated (FSI) Market, By Country, 2019 - 2022, USD Million
- TABLE 213 Europe Front Side Illuminated (FSI) Market, By Country, 2023 - 2030, USD Million
- TABLE 214 Europe Front Side Illuminated (FSI) Market, By Country, 2019 - 2022, Thousand Units
- TABLE 215 Europe Front Side Illuminated (FSI) Market, By Country, 2023 - 2030, Thousand Units
- TABLE 216 Europe Back Side Illuminated (BSI) Market, By Country, 2019 - 2022, USD Million
- TABLE 217 Europe Back Side Illuminated (BSI) Market, By Country, 2023 - 2030, USD Million
- TABLE 218 Europe Back Side Illuminated (BSI) Market, By Country, 2019 - 2022, Thousand Units
- TABLE 219 Europe Back Side Illuminated (BSI) Market, By Country, 2023 - 2030, Thousand Units
- TABLE 220 Europe CCD Market, By Country, 2019 - 2022, USD Million
- TABLE 221 Europe CCD Market, By Country, 2023 - 2030, USD Million
- TABLE 222 Europe CCD Market, By Country, 2019 - 2022, Thousand Units
- TABLE 223 Europe CCD Market, By Country, 2023 - 2030, Thousand Units
- TABLE 224 Europe Image Sensor Market, By Vertical, 2019 - 2022, USD Million
- TABLE 225 Europe Image Sensor Market, By Vertical, 2023 - 2030, USD Million
- TABLE 226 Europe Image Sensor Market, By Vertical, 2019 - 2022, Thousand Units
- TABLE 227 Europe Image Sensor Market, By Vertical, 2023 - 2030, Thousand Units
- TABLE 228 Europe Consumer Electronics Market, By Country, 2019 - 2022, USD Million
- TABLE 229 Europe Consumer Electronics Market, By Country, 2023 - 2030, USD Million
- TABLE 230 Europe Consumer Electronics Market, By Country, 2019 - 2022, Thousand Units
- TABLE 231 Europe Consumer Electronics Market, By Country, 2023 - 2030, Thousand Units
- TABLE 232 Europe Automotive Market, By Country, 2019 - 2022, USD Million
- TABLE 233 Europe Automotive Market, By Country, 2023 - 2030, USD Million
- TABLE 234 Europe Automotive Market, By Country, 2019 - 2022, Thousand Units
- TABLE 235 Europe Automotive Market, By Country, 2023 - 2030, Thousand Units
- TABLE 236 Europe Defense & Aerospace Market, By Country, 2019 - 2022, USD Million
- TABLE 237 Europe Defense & Aerospace Market, By Country, 2023 - 2030, USD Million
- TABLE 238 Europe Defense & Aerospace Market, By Country, 2019 - 2022, Thousand Units
- TABLE 239 Europe Defense & Aerospace Market, By Country, 2023 - 2030, Thousand Units
- TABLE 240 Europe Industrial Market, By Country, 2019 - 2022, USD Million
- TABLE 241 Europe Industrial Market, By Country, 2023 - 2030, USD Million
- TABLE 242 Europe Industrial Market, By Country, 2019 - 2022, Thousand Units
- TABLE 243 Europe Industrial Market, By Country, 2023 - 2030, Thousand Units
- TABLE 244 Europe Medical Market, By Country, 2019 - 2022, USD Million
- TABLE 245 Europe Medical Market, By Country, 2023 - 2030, USD Million
- TABLE 246 Europe Medical Market, By Country, 2019 - 2022, Thousand Units
- TABLE 247 Europe Medical Market, By Country, 2023 - 2030, Thousand Units
- TABLE 248 Europe Security & Surveillance Market, By Country, 2019 - 2022, USD Million
- TABLE 249 Europe Security & Surveillance Market, By Country, 2023 - 2030, USD Million
- TABLE 250 Europe Security & Surveillance Market, By Country, 2019 - 2022, Thousand Units
- TABLE 251 Europe Security & Surveillance Market, By Country, 2023 - 2030, Thousand Units
- TABLE 252 Europe Others Market, By Country, 2019 - 2022, USD Million
- TABLE 253 Europe Others Market, By Country, 2023 - 2030, USD Million
- TABLE 254 Europe Others Market, By Country, 2019 - 2022, Thousand Units
- TABLE 255 Europe Others Market, By Country, 2023 - 2030, Thousand Units
- TABLE 256 Europe Image Sensor Market, By Country, 2019 - 2022, USD Million
- TABLE 257 Europe Image Sensor Market, By Country, 2023 - 2030, USD Million
- TABLE 258 Europe Image Sensor Market, By Country, 2019 - 2022, Thousand Units
- TABLE 259 Europe Image Sensor Market, By Country, 2023 - 2030, Thousand Units
- TABLE 260 Germany Image Sensor Market, 2019 - 2022, USD Million
- TABLE 261 Germany Image Sensor Market, 2023 - 2030, USD Million
- TABLE 262 Germany Image Sensor Market, 2019 - 2022, Thousand Units
- TABLE 263 Germany Image Sensor Market, 2023 - 2030, Thousand Units
- TABLE 264 Germany Image Sensor Market, By Type, 2019 - 2022, USD Million
- TABLE 265 Germany Image Sensor Market, By Type, 2023 - 2030, USD Million
- TABLE 266 Germany Image Sensor Market, By Type, 2019 - 2022, Thousand Units
- TABLE 267 Germany Image Sensor Market, By Type, 2023 - 2030, Thousand Units
- TABLE 268 Germany Image Sensor Market, By CMOS Type, 2019 - 2022, USD Million
- TABLE 269 Germany Image Sensor Market, By CMOS Type, 2023 - 2030, USD Million
- TABLE 270 Germany Image Sensor Market, By CMOS Type, 2019 - 2022, Thousand Units
- TABLE 271 Germany Image Sensor Market, By CMOS Type, 2023 - 2030, Thousand Units
- TABLE 272 Germany Image Sensor Market, By Vertical, 2019 - 2022, USD Million
- TABLE 273 Germany Image Sensor Market, By Vertical, 2023 - 2030, USD Million
- TABLE 274 Germany Image Sensor Market, By Vertical, 2019 - 2022, Thousand Units
- TABLE 275 Germany Image Sensor Market, By Vertical, 2023 - 2030, Thousand Units
The Global Image Sensor Market size is expected to reach $64.3 billion by 2030, rising at a market growth of 12.2% CAGR during the forecast period. In the year 2022, the market attained a volume of 6,43,550.2 thousand units, experiencing a growth of 16.1% (2019-2022).
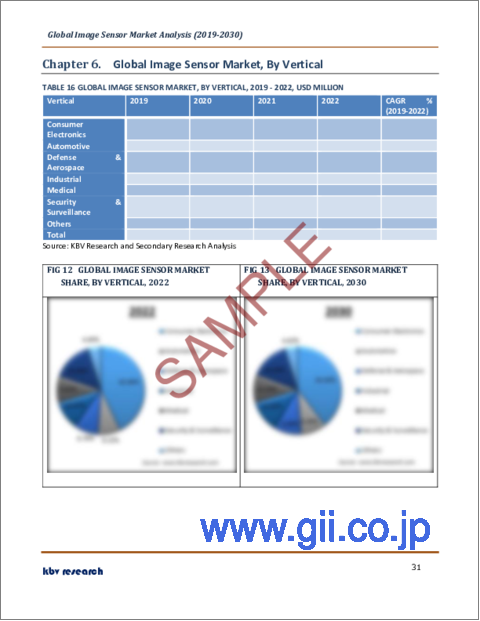
Closed-circuit television (CCTV) and IP cameras are commonly used in security and surveillance systems. Image sensors in these cameras capture high-resolution images and videos, allowing for real-time monitoring, recording, and remote access to surveillance footage. Therefore, the security & surveillance segment captured $3,860.0 million revenue in the market in 2022. These are integrated into license plate recognition (LPR) systems, which are employed for automated toll collection, parking management, and law enforcement. These systems capture license plate images for identification and tracking. Video management systems use these to store, manage, and retrieve video footage from multiple cameras. These systems are essential for centralized surveillance control and data storage.
The major strategies followed by the market participants are Product Launches as the key developmental strategy to keep pace with the changing demands of end users. For instance, in September, 2023, OmniVision Technologies, Inc. launched the OX08D10 8-megapixel (MP) CMOS image sensor with 2.1-micron (µm) TheiaCel technology. The OX08D10 8-megapixel (MP) CMOS image sensor has the features of low light performance and low power consumption within a compact size. In May, 2023, Sony Electronics Inc., a subsidiary of Sony Corporation, launched the Xperia 1 V, a smartphone with the provision of a CMOS image sensor and a Transistor Pixel of two layers. The Xperia 1 V offers the cutting-edge technology of Sony while also meeting the requirements of the creators.
Based on the Analysis presented in the KBV Cardinal matrix; Samsung Electronics Co., Ltd. is the forerunners in the market. In November, 2023, Samsung Electronics Co., Ltd. unveiled the ISOCELL GNK, which is an image sensor with the capability of producing images in a dynamic range of 102dB. The new product has the features of a 1.2-micron pixel size and a 50 MP camera in a 1/1.3" sensor format similar to its predecessor, the ISOCELL GN1, and at the same time provides a dynamic range with three different ISO modes. Additionally, the ISOCELL GNK captures 14-bit RAW images in Pro mode. Companies such as Sony Corporation, STMicroelectronics N.V., Canon, Inc. are some of the key innovators in market.
Market Growth Factors
Integration of IoT and connectivity image sensors
Integrating image sensors into IoT devices and connected systems has expanded their applications. IoT devices, such as smart home cameras and environmental sensors, use these for data collection and monitoring. IoT-enabled devices in smart homes use these for security, surveillance, and automation. Smart cameras, video doorbells, and home monitoring systems rely on these to capture and transmit video data to homeowners' devices, enhancing convenience and security. The market is expanding significantly due to the integration of IoT and connectivity image sensors.
Growing advancements in 3D imaging technologies
Biometric identification and facial recognition are enabled by 3D imaging technologies, including ToF sensors and structured light. These sensors provide a more secure and accurate way to identify individuals, essential in security applications, access control, and mobile devices. 3D imaging enables touchless gesture control in various applications, including gaming, automotive infotainment systems, and human-machine interfaces. Users can interact with devices and systems without physical contact, enhancing user experience and safety. As a result of the growing advancements in 3D imaging technologies, the market is anticipated to increase significantly.
Market Restraining Factors
Adverse effects of supply chain disruptions
Production delays of these may result from disturbances in the supply chain. Component shortages, transportation interruptions, and factory closures can all impact manufacturing timelines, causing delays in product availability. The scarcity of critical components or materials due to supply chain disruptions can increase costs. Manufacturers pay higher prices to secure necessary inputs, which can ultimately affect the pricing of these. Thus, adverse effects of supply chain disruptions can slow down the growth of the market.
Type Outlook
By type, the market is bifurcated into CMOS and CCD. The CCD segment covered a considerable revenue share in the market in 2022. CCD sensors typically exhibit low read noise and dark current, which leads to clean and noise-free images, even in low-light conditions. This low noise performance is advantageous for applications that require long exposure times, such as astrophotography and microscopy. CCD sensors are well-suited for applications that require long exposure times, such as capturing faint astronomical objects, studying chemical reactions, or imaging bioluminescent phenomena.
CMOS Outlook
Under CMOS type, the market is segmented into front side illuminated (FSI) and back side illuminated (BSI). In 2022, the front side illuminated (FSI) segment witnessed the largest revenue share in the market. FSI image sensors are designed to maximize their sensitivity to incoming light. This results in better low-light performance, making FSI sensors ideal for applications where adequate illumination is a challenge. Enhanced light sensitivity is particularly beneficial in low-light photography and videography, surveillance, and medical imaging. FSI image sensors have a proven track record of reliability and performance, which makes them a trusted choice for many industries.
Vertical Outlook
Based on vertical, the market is classified into consumer electronics, defense & aerospace, medical, industrial, automotive, security & surveillance, and others. In 2022, the consumer electronics segment dominated the market with maximum revenue share. The popularity of action cameras, used for capturing adventures and sports activities, has led to increased demand for compact, high-performance image sensors. These sensors need to deliver excellent image quality and handle various environmental conditions. Internet of Things (IoT) devices, such as smart doorbells and security cameras, use these for monitoring and surveillance.
Regional Outlook
Region-wise, the market is analysed across North America, Europe, Asia Pacific, and LAMEA. In 2022, the Asia Pacific region led the market by generating the highest revenue share. The Asia Pacific region is a prominent player in the global automotive sector. These are used in vehicles for ADAS, rearview cameras, and in-cabin monitoring. The growing demand for safe and smart vehicles propels the adoption of image sensors. Agriculture in Asia Pacific benefits from these for precision agriculture and crop monitoring. Drones and agricultural machinery use these sensors for tasks such as crop health assessment and yield optimization.
The market research report covers the analysis of key stake holders of the market. Key companies profiled in the report include Sony Corporation, Samsung Electronics Co., Ltd. (Samsung Group), OmniVision Technologies, Inc., STMicroelectronics N.V., ON Semiconductor Corporation, Panasonic Holdings Corporation, Canon, Inc., GalaxyCore Shanghai Limited Corporation, PixArt Imaging, Inc., and Toshiba Corporation
Recent Strategies Deployed in the Image Sensor Market
Partnerships, Collaborations, and Agreements:
Aug-2023: OmniVision Technologies, Inc. joined hands with iCatch Technology, Inc., a world-leading company in surveillance equipment. Under this collaboration, the OA07600 ultra-low-power of OmniVision was combined with the Vi57 artificial intelligence (AI) imaging system-on-chip (SoC) of iCatch Technology to provide storage of pre-event colour video footage.
May-2022: OmniVision Technologies, Inc. teamed up with Leopard Imaging, Inc., a global leader providing high-definition embedded cameras. Under this collaboration, AI camera solutions for autonomous machines were introduced that support the OAX8000 and the OA8000 camera video processors. Additionally, this collaboration provided hardware and software development and customized manufacturing services for the clients.
Product Launches and Product Expansions:
Nov-2023: Samsung Electronics Co., Ltd. unveiled the ISOCELL GNK, which is an image sensor with the capability of producing images in a dynamic range of 102dB. The new product has the features of a 1.2-micron pixel size and a 50 MP camera in a 1/1.3" sensor format similar to its predecessor, the ISOCELL GN1, and at the same time provides a dynamic range with three different ISO modes. Additionally, the ISOCELL GNK captures 14-bit RAW images in Pro mode.
Sep-2023: OmniVision Technologies, Inc. launched the OX08D10 8-megapixel (MP) CMOS image sensor with 2.1-micron (µm) TheiaCel technology. The OX08D10 8-megapixel (MP) CMOS image sensor has the features of low light performance and low power consumption within a compact size. The new product increases safety in automobiles and assists drivers through image quality and improved resolution in the external cameras for providing advanced driver assistance systems (ADAS) and autonomous driving (AD).
Jul-2023: STMicroelectronics N.V. launched the FlightSense multi-zone distance sensor. The new product has the features of a 90° field of view and is 33% larger than the previous generations. The new product assists in 3D scene mapping and measures the distance of multiple objects in multiple zones.
May-2023: Sony Electronics Inc., a subsidiary of Sony Corporation, launched the Xperia 1 V, a smartphone with the provision of a CMOS image sensor and a Transistor Pixel of two layers. The Xperia 1 V offers the cutting-edge technology of Sony while also meeting the requirements of the creators.
Jan-2023: Samsung Electronics Co., Ltd. introduced the ISOCELL HP2, which has a 200-megapixel (MP) image sensor and better pixel technology for offering mobile images in smartphones. The ISOCELL HP2 has the capacity of packing 200 million 0.6-micrometer (μm) pixels in a 1/1.3" optical format. The new product provides high resolutions to customers without having to face large camera bumps on their devices.
Jan-2023: Canon Inc. launched a 1.0-inch, back-illuminated stacked CMOS sensor for monitoring those applications that require a pixel count of approximately 12.6 million pixels and a range of 148 decibels. The new product separates the image into 736 areas and hence determines the best exposure setting for each particular area.
May-2022: STMicroelectronics N.V. introduced the VB56G4A, a global-shutter image sensor for driver monitoring systems (DMSs), to enhance its vehicle safety product portfolio. The VB56G4A strengthens the in-house manufacturing of 3D-stacked backside illuminated (BSI-3D) image sensors for the company.
Sep-2021: Samsung Electronics Co., Ltd. unveiled two products, the ISOCELL HP1 and the ISOCELL GN5. The ISOCELL HP1 has the features of a 200-megapixel (MP) image sensor with 0.64μm pixels, while the ISOCELL GN5 has the capacity to accommodate the all-directional Dual Pixel Pro technology with two photodiodes into a single 1.0μm pixel.
Jul-2021: Sony Corporation introduced the Alpha ZV-E10, an Alpha series camera with interchangeable lenses. The Alpha ZV-E10 has the features of a BIONZ X image processing engine and a 24.2-megapixel APS-C Exmor CMOS sensor. The new product incorporates the imaging technology of Sony with a customized feature set.
Jun-2020: OmniVision Technologies, Inc. released the OVM9284 CameraCubeChip module. The new product is based on the OmniPixel 3-GS global-shutter pixel architecture of OmniVision and has a quantum efficiency of 940 nm for providing high-quality images even in the dark.
Geographical Expansions:
Feb-2022: Toshiba Electronic Devices & Storage Corporation, a subsidiary of Toshiba Corporation, expanded its geographical footprints by constructing a 300-millimeter wafer fabrication factory in Ishikawa Prefecture. The construction occurred in two phases. The construction of phase 1 increased the power semiconductor production capacity by 2.5 times.
Scope of the Study
Market Segments covered in the Report:
By Type (Volume, Thousand Units, USD Billion, 2019 to 2030)
- CMOS
- Front Side Illuminated (FSI)
- Back Side Illuminated (BSI)
- CCD
By Vertical (Volume, Thousand Units, USD Billion, 2019 to 2030)
- Consumer Electronics
- Automotive
- Defense & Aerospace
- Industrial
- Medical
- Security & Surveillance
- Others
By Geography (Volume, Thousand Units, USD Billion, 2019 to 2030)
- North America
- US
- Canada
- Mexico
- Rest of North America
- Europe
- Germany
- UK
- France
- Russia
- Spain
- Italy
- Rest of Europe
- Asia Pacific
- China
- Japan
- India
- South Korea
- Singapore
- Malaysia
- Rest of Asia Pacific
- LAMEA
- Brazil
- Argentina
- UAE
- Saudi Arabia
- South Africa
- Nigeria
- Rest of LAMEA
Companies Profiled
- Sony Corporation
- Samsung Electronics Co., Ltd. (Samsung Group)
- OmniVision Technologies, Inc.
- STMicroelectronics N.V.
- ON Semiconductor Corporation
- Panasonic Holdings Corporation
- Canon, Inc.
- GalaxyCore Shanghai Limited Corporation
- PixArt Imaging, Inc.
- Toshiba Corporation
Unique Offerings from KBV Research
- Exhaustive coverage
- Highest number of market tables and figures
- Subscription based model available
- Guaranteed best price
- Assured post sales research support with 10% customization free
Table of Contents
Chapter 1. Market Scope & Methodology
- 1.1 Market Definition
- 1.2 Objectives
- 1.3 Market Scope
- 1.4 Segmentation
- 1.4.1 Global Image Sensor Market, by Type
- 1.4.2 Global Image Sensor Market, by Vertical
- 1.4.3 Global Image Sensor Market, by Geography
- 1.5 Methodology for the research
Chapter 2. Market at a Glance
- 2.1 Key Highlights
Chapter 3. Market Overview
- 3.1 Introduction
- 3.1.1 Overview
- 3.1.1.1 Market Composition and Scenario
- 3.1.1 Overview
- 3.2 Key Factors Impacting the Market
- 3.2.1 Market Drivers
- 3.2.2 Market Restraints
Chapter 4. Competition Analysis - Global
- 4.1 KBV Cardinal Matrix
- 4.2 Recent Industry Wide Strategic Developments
- 4.2.1 Partnerships, Collaborations and Agreements
- 4.2.2 Product Launches and Product Expansions
- 4.2.3 Geographical Expansions
- 4.3 Market Share Analysis, 2022
- 4.4 Top Winning Strategies
- 4.4.1 Key Leading Strategies: Percentage Distribution (2019-2023)
- 4.4.2 Key Strategic Move: (Product Launches and Product Expansions : 2020, Jun - 2023, Nov) Leading Players
- 4.5 Porter's Five Forces Analysis
Chapter 5. Global Image Sensor Market, By Type
- 5.1 Global CMOS Market, By Region
- 5.2 Global Image Sensor Market, By CMOS Type
- 5.2.1 Global Front Side Illuminated (FSI) Market, By Region
- 5.2.2 Global Back Side Illuminated (BSI) Market, By Region
- 5.3 Global CCD Market, By Region
Chapter 6. Global Image Sensor Market, By Vertical
- 6.1 Global Consumer Electronics Market, By Region
- 6.2 Global Automotive Market, By Region
- 6.3 Global Defense & Aerospace Market, By Region
- 6.4 Global Industrial Market, By Region
- 6.5 Global Medical Market, By Region
- 6.6 Global Security & Surveillance Market, By Region
- 6.7 Global Others Market, By Region
Chapter 7. Global Image Sensor Market, By Region
- 7.1 North America Image Sensor Market
- 7.1.1 North America Image Sensor Market, By Type
- 7.1.1.1 North America CMOS Market, By Country
- 7.1.1.2 North America Image Sensor Market, By CMOS Type
- 7.1.1.2.1 North America Front Side Illuminated (FSI) Market, By Country
- 7.1.1.2.2 North America Back Side Illuminated (BSI) Market, By Country
- 7.1.1.3 North America CCD Market, By Country
- 7.1.2 North America Image Sensor Market, By Vertical
- 7.1.2.1 North America Consumer Electronics Market, By Country
- 7.1.2.2 North America Automotive Market, By Country
- 7.1.2.3 North America Defense & Aerospace Market, By Country
- 7.1.2.4 North America Industrial Market, By Country
- 7.1.2.5 North America Medical Market, By Country
- 7.1.2.6 North America Security & Surveillance Market, By Country
- 7.1.2.7 North America Others Market, By Country
- 7.1.3 North America Image Sensor Market, By Country
- 7.1.3.1 US Image Sensor Market
- 7.1.3.1.1 US Image Sensor Market, By Type
- 7.1.3.1.2 US Image Sensor Market, By Vertical
- 7.1.3.2 Canada Image Sensor Market
- 7.1.3.2.1 Canada Image Sensor Market, By Type
- 7.1.3.2.2 Canada Image Sensor Market, By Vertical
- 7.1.3.3 Mexico Image Sensor Market
- 7.1.3.3.1 Mexico Image Sensor Market, By Type
- 7.1.3.3.2 Mexico Image Sensor Market, By Vertical
- 7.1.3.4 Rest of North America Image Sensor Market
- 7.1.3.4.1 Rest of North America Image Sensor Market, By Type
- 7.1.3.4.2 Rest of North America Image Sensor Market, By Vertical
- 7.1.3.1 US Image Sensor Market
- 7.1.1 North America Image Sensor Market, By Type
- 7.2 Europe Image Sensor Market
- 7.2.1 Europe Image Sensor Market, By Type
- 7.2.1.1 Europe CMOS Market, By Country
- 7.2.1.2 Europe Image Sensor Market, By CMOS Type
- 7.2.1.2.1 Europe Front Side Illuminated (FSI) Market, By Country
- 7.2.1.2.2 Europe Back Side Illuminated (BSI) Market, By Country
- 7.2.1.3 Europe CCD Market, By Country
- 7.2.2 Europe Image Sensor Market, By Vertical
- 7.2.2.1 Europe Consumer Electronics Market, By Country
- 7.2.2.2 Europe Automotive Market, By Country
- 7.2.2.3 Europe Defense & Aerospace Market, By Country
- 7.2.2.4 Europe Industrial Market, By Country
- 7.2.2.5 Europe Medical Market, By Country
- 7.2.2.6 Europe Security & Surveillance Market, By Country
- 7.2.2.7 Europe Others Market, By Country
- 7.2.3 Europe Image Sensor Market, By Country
- 7.2.3.1 Germany Image Sensor Market
- 7.2.3.1.1 Germany Image Sensor Market, By Type
- 7.2.3.1.2 Germany Image Sensor Market, By Vertical
- 7.2.3.2 UK Image Sensor Market
- 7.2.3.2.1 UK Image Sensor Market, By Type
- 7.2.3.2.2 UK Image Sensor Market, By Vertical
- 7.2.3.3 France Image Sensor Market
- 7.2.3.3.1 France Image Sensor Market, By Type
- 7.2.3.3.2 France Image Sensor Market, By Vertical
- 7.2.3.4 Russia Image Sensor Market
- 7.2.3.4.1 Russia Image Sensor Market, By Type
- 7.2.3.4.2 Russia Image Sensor Market, By Vertical
- 7.2.3.5 Spain Image Sensor Market
- 7.2.3.5.1 Spain Image Sensor Market, By Type
- 7.2.3.5.2 Spain Image Sensor Market, By Vertical
- 7.2.3.6 Italy Image Sensor Market
- 7.2.3.6.1 Italy Image Sensor Market, By Type
- 7.2.3.6.2 Italy Image Sensor Market, By Vertical
- 7.2.3.7 Rest of Europe Image Sensor Market
- 7.2.3.7.1 Rest of Europe Image Sensor Market, By Type
- 7.2.3.7.2 Rest of Europe Image Sensor Market, By Vertical
- 7.2.3.1 Germany Image Sensor Market
- 7.2.1 Europe Image Sensor Market, By Type
- 7.3 Asia Pacific Image Sensor Market
- 7.3.1 Asia Pacific Image Sensor Market, By Type
- 7.3.1.1 Asia Pacific CMOS Market, By Country
- 7.3.1.2 Asia Pacific Image Sensor Market, By CMOS Type
- 7.3.1.2.1 Asia Pacific Front Side Illuminated (FSI) Market, By Country
- 7.3.1.2.2 Asia Pacific Back Side Illuminated (BSI) Market, By Country
- 7.3.1.3 Asia Pacific CCD Market, By Country
- 7.3.2 Asia Pacific Image Sensor Market, By Vertical
- 7.3.2.1 Asia Pacific Consumer Electronics Market, By Country
- 7.3.2.2 Asia Pacific Automotive Market, By Country
- 7.3.2.3 Asia Pacific Defense & Aerospace Market, By Country
- 7.3.2.4 Asia Pacific Industrial Market, By Country
- 7.3.2.5 Asia Pacific Medical Market, By Country
- 7.3.2.6 Asia Pacific Security & Surveillance Market, By Country
- 7.3.2.7 Asia Pacific Others Market, By Country
- 7.3.3 Asia Pacific Image Sensor Market, By Country
- 7.3.3.1 China Image Sensor Market
- 7.3.3.1.1 China Image Sensor Market, By Type
- 7.3.3.1.2 China Image Sensor Market, By Vertical
- 7.3.3.2 Japan Image Sensor Market
- 7.3.3.2.1 Japan Image Sensor Market, By Type
- 7.3.3.2.2 Japan Image Sensor Market, By Vertical
- 7.3.3.3 India Image Sensor Market
- 7.3.3.3.1 India Image Sensor Market, By Type
- 7.3.3.3.2 India Image Sensor Market, By Vertical
- 7.3.3.4 South Korea Image Sensor Market
- 7.3.3.4.1 South Korea Image Sensor Market, By Type
- 7.3.3.4.2 South Korea Image Sensor Market, By Vertical
- 7.3.3.5 Singapore Image Sensor Market
- 7.3.3.5.1 Singapore Image Sensor Market, By Type
- 7.3.3.5.2 Singapore Image Sensor Market, By Vertical
- 7.3.3.6 Malaysia Image Sensor Market
- 7.3.3.6.1 Malaysia Image Sensor Market, By Type
- 7.3.3.6.2 Malaysia Image Sensor Market, By Vertical
- 7.3.3.7 Rest of Asia Pacific Image Sensor Market
- 7.3.3.7.1 Rest of Asia Pacific Image Sensor Market, By Type
- 7.3.3.7.2 Rest of Asia Pacific Image Sensor Market, By Vertical
- 7.3.3.1 China Image Sensor Market
- 7.3.1 Asia Pacific Image Sensor Market, By Type
- 7.4 LAMEA Image Sensor Market
- 7.4.1 LAMEA Image Sensor Market, By Type
- 7.4.1.1 LAMEA CMOS Market, By Country
- 7.4.1.2 LAMEA Image Sensor Market, By CMOS Type
- 7.4.1.2.1 LAMEA Front Side Illuminated (FSI) Market, By Country
- 7.4.1.2.2 LAMEA Back Side Illuminated (BSI) Market, By Country
- 7.4.1.3 LAMEA CCD Market, By Country
- 7.4.2 LAMEA Image Sensor Market, By Vertical
- 7.4.2.1 LAMEA Consumer Electronics Market, By Country
- 7.4.2.2 LAMEA Automotive Market, By Country
- 7.4.2.3 LAMEA Defense & Aerospace Market, By Country
- 7.4.2.4 LAMEA Industrial Market, By Country
- 7.4.2.5 LAMEA Medical Market, By Country
- 7.4.2.6 LAMEA Security & Surveillance Market, By Country
- 7.4.2.7 LAMEA Others Market, By Country
- 7.4.3 LAMEA Image Sensor Market, By Country
- 7.4.3.1 Brazil Image Sensor Market
- 7.4.3.1.1 Brazil Image Sensor Market, By Type
- 7.4.3.1.2 Brazil Image Sensor Market, By Vertical
- 7.4.3.2 Argentina Image Sensor Market
- 7.4.3.2.1 Argentina Image Sensor Market, By Type
- 7.4.3.2.2 Argentina Image Sensor Market, By Vertical
- 7.4.3.3 UAE Image Sensor Market
- 7.4.3.3.1 UAE Image Sensor Market, By Type
- 7.4.3.3.2 UAE Image Sensor Market, By Vertical
- 7.4.3.4 Saudi Arabia Image Sensor Market
- 7.4.3.4.1 Saudi Arabia Image Sensor Market, By Type
- 7.4.3.4.2 Saudi Arabia Image Sensor Market, By Vertical
- 7.4.3.5 South Africa Image Sensor Market
- 7.4.3.5.1 South Africa Image Sensor Market, By Type
- 7.4.3.5.2 South Africa Image Sensor Market, By Vertical
- 7.4.3.6 Nigeria Image Sensor Market
- 7.4.3.6.1 Nigeria Image Sensor Market, By Type
- 7.4.3.6.2 Nigeria Image Sensor Market, By Vertical
- 7.4.3.7 Rest of LAMEA Image Sensor Market
- 7.4.3.7.1 Rest of LAMEA Image Sensor Market, By Type
- 7.4.3.7.2 Rest of LAMEA Image Sensor Market, By Vertical
- 7.4.3.1 Brazil Image Sensor Market
- 7.4.1 LAMEA Image Sensor Market, By Type
Chapter 8. Company Profiles
- 8.1 Sony Corporation
- 8.1.1 Company Overview
- 8.1.2 Financial Analysis
- 8.1.3 Segmental and Regional Analysis
- 8.1.4 Research & Development Expenses
- 8.1.5 Recent strategies and developments:
- 8.1.5.1 Product Launches and Product Expansions:
- 8.1.6 SWOT Analysis
- 8.2 Samsung Electronics Co., Ltd. (Samsung Group)
- 8.2.1 Company Overview
- 8.2.2 Financial Analysis
- 8.2.3 Segmental and Regional Analysis
- 8.2.4 Recent strategies and developments:
- 8.2.4.1 Product Launches and Product Expansions:
- 8.2.5 SWOT Analysis
- 8.3 OmniVision Technologies, Inc.
- 8.3.1 Company Overview
- 8.3.2 Recent strategies and developments:
- 8.3.2.1 Partnerships, Collaborations, and Agreements:
- 8.3.2.2 Product Launches and Product Expansions:
- 8.3.3 SWOT Analysis
- 8.4 STMicroelectronics N.V.
- 8.4.1 Company Overview
- 8.4.2 Financial Analysis
- 8.4.3 Segmental and Regional Analysis
- 8.4.4 Research & Development Expense
- 8.4.5 Recent strategies and developments:
- 8.4.5.1 Product Launches and Product Expansions:
- 8.4.6 SWOT Analysis
- 8.5 ON Semiconductor Corporation
- 8.5.1 Company Overview
- 8.5.2 Financial Analysis
- 8.5.3 Segmental and Regional Analysis
- 8.5.4 Research & Development Expense
- 8.5.5 SWOT Analysis
- 8.6 Panasonic Holdings Corporation
- 8.6.1 Company Overview
- 8.6.2 Financial Analysis
- 8.6.3 Segmental and Regional Analysis
- 8.6.4 Research & Development Expenses
- 8.6.5 SWOT Analysis
- 8.7 Canon, Inc.
- 8.7.1 Company Overview
- 8.7.2 Financial Analysis
- 8.7.3 Segmental and Regional Analysis
- 8.7.4 Research & Development Expenses
- 8.7.5 Recent strategies and developments:
- 8.7.5.1 Product Launches and Product Expansions:
- 8.7.6 SWOT Analysis
- 8.8 GalaxyCore Shanghai Limited Corporation
- 8.8.1 Company Overview
- 8.8.2 SWOT Analysis
- 8.9 PixArt Imaging, Inc.
- 8.9.1 Company Overview
- 8.9.2 Financial Analysis
- 8.9.3 Regional Analysis
- 8.9.4 Research & Development Expenses
- 8.9.5 SWOT Analysis
- 8.10. Toshiba Corporation
- 8.10.1 Company Overview
- 8.10.2 Financial Analysis
- 8.10.3 Segmental and Regional Analysis
- 8.10.4 Research and Development Expense
- 8.10.5 Recent strategies and developments:
- 8.10.5.1 Geographical Expansions:
- 8.10.6 SWOT Analysis