|
|
市場調査レポート
商品コード
1276841
ドライバーモニタリングシステムの世界市場規模、シェア、産業動向分析レポート:車両推進方式別、販売チャネル別、コンポーネント別、モニタリングタイプ別、車種別、地域別展望と予測、2023~2029年Global Driver Monitoring Systems Market Size, Share & Industry Trends Analysis Report By Vehicle Propulsion, By Sales Channel (OEM and Aftermarket), By Component, By Type of Monitoring, By Vehicle type, By Regional Outlook and Forecast, 2023 - 2029 |
||||||
|
|
|||||||


| ドライバーモニタリングシステムの世界市場規模、シェア、産業動向分析レポート:車両推進方式別、販売チャネル別、コンポーネント別、モニタリングタイプ別、車種別、地域別展望と予測、2023~2029年 |
|
出版日: 2023年04月28日
発行: KBV Research
ページ情報: 英文 304 Pages
納期: 即納可能
|
- 全表示
- 概要
- 図表
- 目次
ドライバーモニタリングシステム市場規模は2029年までに34億米ドルに達すると予測され、予測期間中のCAGRは9.6%の市場成長率で上昇すると予想されています。
10代の若者は交通事故による死亡事故の発生率が高いです。自動車の安全機能に対するニーズが高まっているのは、こうした要因によるものです。自動車メーカーは、顧客の要求を満たすために、安全機能の革新と実装を進めています。ドライバーモニタリングシステム市場の成長は、安全機能に対する高い需要に後押しされています。
世界各国の政府は、指定された期間内に自動車に安全システムを搭載することを義務付けています。例えば、政府は眠気モニタリングシステム、車線逸脱システム、ドライバーモニタリングシステムなどの技術を自動車に搭載することを義務付けています。さらに、エアバッグ、シートベルト、子供用安全装置、歩行者用安全装置などの安全機能の搭載が義務付けられています。
COVID-19の影響分析
ドライバーモニタリングシステム市場は、COVID-19の流行により通勤が制限され、市場参入企業の財務状況に悪影響を及ぼすことが予想されます。経済的な影響により、市場参入企業は戦略的なコスト削減計画を策定しています。これらの要因は、予測期間内の市場の成長に寄与すると予想されます。このように、交通事故の増加により規制が緩和され、これらのシステムに対する需要が増加することで、市場は成長を遂げることが予想されます。このような成長により、市場は初期損失から回復することが期待されます。
市場の成長要因
自動車用安全システムの需要拡大
自動車安全システムは、負傷の可能性を減らし、事故を防止し、衝突の影響を軽減することを目的とした必須機器です。このシステムは、自動的に機能するように設計されており、また、 ドライバーの要求に応じて作動させる必要があります。電気自動車メーカーは、安全性を確保するために、自動操縦モードと連動するドライバーモニタリングシステムを導入する必要があります。自動車安全システム業界は、顕著な動向として、技術的進歩の人気が急上昇していることを示しています。自動車部門では、さまざまな地形や環境での安全性を高めるために、インテリジェントで安全な安全システムを自動車に組み込むことを重視しています。
輸送・物流業界におけるモニタリングの増加
ドライバーモニタリングシステムのアプリケーションの増加は、産業部門、物流部門、輸送部門の成長によってもたらされています。フリートマネジメントソリューションは、ドライバーモニタリングシステムの導入により、データの収集、保存、モニタリング、分析、報告、エクスポートが可能です。 ドライバーのパフォーマンスをモニタリングすることで、漫然運転の防止、ドライバーの健康促進、飲酒運転事故のリスク低減などの対策を含む、安全規制や法的要件の遵守を保証することができます。
市場抑制要因
非常に複雑なシステム
ドライバーモニタリングシステムは、モニタリング・パラメーターの数が増え、 ドライバーの状態を正確に検出する必要があるため、複雑さが増しています。偽陽性や偽陰性の発生を最小限に抑えることは、ビジネスにおいて極めて重要な目的です。ビジョンベースのDMS技術の実装に関連する主な技術的課題は、露出過多または露出不足の画像をもたらす可能性のある、さまざまな照明条件下で安定した性能を発揮する能力です。自動車産業におけるDMSの検証や開発は、複雑さが増すため、利害関係者にとって大きな課題となります。また、ドライバーモニタリングシステムは新しいコンセプトであるため、一般消費者の認知度は極めて低いです。
車両推進方式の展望
ドライバーモニタリングシステム市場は、車両推進方式別に、内燃機関車と電気自動車に分類されます。2022年のドライバーモニタリングシステム市場では、ICE機関車セグメントが最大の収益シェアを示しました。これは、ドライバーモニタリングシステムが眠気や注意力不足の兆候を識別できることに起因しています。これらのシステムが発展し続けると、パーソナライズされた機能、強化された安全対策、エンターテイメントオプション、スマートホームシステムとの接続機能を提供する包括的なインテリアセンシングプラットフォームに統合されるでしょう。ドライバーモニタリングシステム(DMS)は、 ドライバーを認識し、温度、シート、サイドミラーなどの設定を好みに応じてカスタマイズすることができます。
販売チャネルの展望
販売チャネルに基づいて、ドライバーモニタリングシステム市場は、OEMとアフターマーケットに区分されます。2022年のドライバーモニタリングシステム市場では、アフターマーケットセグメントが突出した収益シェアを獲得しています。これは、世界的に道路を走るトラックやバスの数が多いため、自動車グレードのDMSソフトウェアの市場が拡大したためです。これらのソリューションは、プラグアンドプレイオプションとして提供されています。インストール作業は簡単で、車両がドライバーの疲労や集中力の欠如などを検知し、各インストールの交通安全性を高めることができるため、このセグメントの成長機会となります。
コンポーネントの展望
ドライバーモニタリングシステム市場は、コンポーネント別にカメラ、センサー、その他に分類されます。センサー分野は、2022年のドライバーモニタリングシステム市場で最も高い収益シェアを記録しました。これは、アクティブセーフティ(ADAS)および自律走行に関する人間と機械の相互作用(HMI)の重要なサポートシステムとして機能するDMSシステムの需要が増加していることに起因しています。さらに、情報が氾濫している車両環境において、インテリジェントなダッシュボードや関連するHMIを実現するためのユーザーインターフェース改善のニーズが高まっています。
モニタリングタイプ別展望
モニタリングタイプに基づいて、ドライバーモニタリングシステム市場は ドライバー状態モニタリングと ドライバーヘルスモニタリングに分けられます。 ドライバーヘルスモニタリングセグメントは、2022年のドライバーモニタリングシステム市場において、かなりの収益シェアを調達しました。これは、これらのシステムが、スマートグラスやユーザーフレンドリーなIOTデバイスの使用を通じて、交通事故の発生を低減することを目的としているためです。IOTベースの健康モニタリングシステムは、 ドライバーの血圧、グルコース、脈拍を常にモニタリングすることを保証します。何らかの問題が検出された場合、システムは速やかに適切な病院にアラートメッセージを送信します。
車種別展望
ドライバーモニタリングシステム市場は、車種別に乗用車、小型商用車、大型商用車に区分されます。乗用車セグメントは、2022年に最大の収益シェアを獲得してドライバーモニタリングシステム市場を独占しました。これは、ドライバーの安全性に関する政府規制の高まりによるもので、便利で豪華な車両機能に対する消費者の需要の高まりがこの動向に寄与しています。ドライバーモニタリングシステムは、乗用車に不可欠なコンポーネントです。乗用車にドライバーモニタリングシステムを導入することで、事故の発生を大幅に抑制することができます。
地域別展望
ドライバーモニタリングシステム市場は、北米、欧州、アジア太平洋、LAMEAの各地域で分析されています。2022年のドライバーモニタリングシステム市場では、欧州地域が最も高い収益シェアを獲得しています。欧州は交通安全を優先しており、この分野ではリーダー的存在です。同地域の政府は、同地域で交通事故ゼロを達成するために取り組んでいます。重要な安全コンポーネントとして、 ドライバーモニタリングソリューションが認識されています。欧州では、居眠り運転による事故が根強い問題となっています。交通事故は人命を大きく損なうため、DMSはドライバーの注意力を高めるための重要なソリューションとなっています。また、DMSの利害関係者は、確立された市場で仕事をし、大きな機会を生かすことができるため、この地域の市場成長を加速させることになるでしょう。
目次
第1章 市場範囲と調査手法
- 市場の定義
- 目的
- 市場範囲
- セグメンテーション
- 調査手法
第2章 市場概要
- イントロダクション
- 概要
- 市場構成とシナリオ
- 概要
- 市場に影響を与える主な要因
- 市場促進要因
- 市場抑制要因
第3章 競合分析- 世界
- KBVカーディナルマトリックス
- 最近の業界全体の戦略的展開
- パートナーシップ、コラボレーション、および契約
- 製品の発売と製品の拡大
- 買収と合併
- 地理的拡大
- 事業拡大
- 主要成功戦略
- 主要なリーディングストラテジー
第4章 世界のドライバーモニタリングシステム市場:車両推進方式別
- 世界の内燃機関車市場:地域別
- 世界の電気自動車市場:地域別
第5章 世界のドライバーモニタリングシステム市場:販売チャネル別
- 世界のOEM市場:地域別
- 世界のアフターマーケット市場:地域別
第6章 世界のドライバーモニタリングシステム市場:コンポーネント別
- 世界のセンサー市場:地域別
- 世界のカメラ市場:地域別
- 世界のその他の市場:地域別
第7章 世界のドライバーモニタリングシステム市場:モニタリングの種類別
- 世界のドライバー状態モニタリング市場:地域別
- 世界のドライバーヘルスモニタリング市場:地域別
第8章 世界のドライバーモニタリングシステム市場:車種別
- 世界の乗用車市場:地域別
- 世界の小型商用車市場:地域別
- 世界の大型商用車市場:地域別
第9章 世界のドライバーモニタリングシステム市場:地域別
- 北米
- 北米の市場:国別
- 米国
- カナダ
- メキシコ
- その他北米地域
- 北米の市場:国別
- 欧州
- 欧州の市場:国別
- ドイツ
- 英国
- フランス
- ロシア
- スペイン
- イタリア
- その他欧州地域
- 欧州の市場:国別
- アジア太平洋
- アジア太平洋の市場:国別
- 中国
- 日本
- インド
- 韓国
- シンガポール
- マレーシア
- その他アジア太平洋地域
- アジア太平洋の市場:国別
- ラテンアメリカ・中東・アフリカ
- ラテンアメリカ・中東・アフリカの市場:国別
- ブラジル
- アルゼンチン
- アラブ首長国連邦
- サウジアラビア
- 南アフリカ
- ナイジェリア
- その他ラテンアメリカ・中東・アフリカ地域
- ラテンアメリカ・中東・アフリカの市場:国別
第10章 企業プロファイル
- Continental AG
- NXP Semiconductors NV
- Intel Corporation
- Robert Bosch GmbH
- Panasonic Holdings Corporation
- Hitachi, Ltd
- Renesas Electronics Corporation
- ZF Friedrichshafen AG
- Denso Corporation
- Valeo SA
LIST OF TABLES
- TABLE 1 Global Driver Monitoring Systems Market, 2019 - 2022, USD Million
- TABLE 2 Global Driver Monitoring Systems Market, 2023 - 2029, USD Million
- TABLE 3 Partnerships, Collaborations and Agreements- Driver Monitoring Systems Market
- TABLE 4 Product Launches And Product Expansions- Driver Monitoring Systems Market
- TABLE 5 Acquisition and Mergers- Driver Monitoring Systems Market
- TABLE 6 Geographical expansions - Driver Monitoring Systems Market
- TABLE 7 Business expansions - Driver Monitoring Systems Market
- TABLE 8 Global Driver Monitoring Systems Market by Vehicle Propulsion, 2019 - 2022, USD Million
- TABLE 9 Global Driver Monitoring Systems Market by Vehicle Propulsion, 2023 - 2029, USD Million
- TABLE 10 Global ICE Vehicles Market by Region, 2019 - 2022, USD Million
- TABLE 11 Global ICE Vehicles Market by Region, 2023 - 2029, USD Million
- TABLE 12 Global Electric Vehicles Market by Region, 2019 - 2022, USD Million
- TABLE 13 Global Electric Vehicles Market by Region, 2023 - 2029, USD Million
- TABLE 14 Global Driver Monitoring Systems Market by Sales Channel, 2019 - 2022, USD Million
- TABLE 15 Global Driver Monitoring Systems Market by Sales Channel, 2023 - 2029, USD Million
- TABLE 16 Global OEM Market by Region, 2019 - 2022, USD Million
- TABLE 17 Global OEM Market by Region, 2023 - 2029, USD Million
- TABLE 18 Global Aftermarket Market by Region, 2019 - 2022, USD Million
- TABLE 19 Global Aftermarket Market by Region, 2023 - 2029, USD Million
- TABLE 20 Global Driver Monitoring Systems Market by Component, 2019 - 2022, USD Million
- TABLE 21 Global Driver Monitoring Systems Market by Component, 2023 - 2029, USD Million
- TABLE 22 Global Sensors Market by Region, 2019 - 2022, USD Million
- TABLE 23 Global Sensors Market by Region, 2023 - 2029, USD Million
- TABLE 24 Global Cameras Market by Region, 2019 - 2022, USD Million
- TABLE 25 Global Cameras Market by Region, 2023 - 2029, USD Million
- TABLE 26 Global Others Market by Region, 2019 - 2022, USD Million
- TABLE 27 Global Others Market by Region, 2023 - 2029, USD Million
- TABLE 28 Global Driver Monitoring Systems Market by Type of Monitoring, 2019 - 2022, USD Million
- TABLE 29 Global Driver Monitoring Systems Market by Type of Monitoring, 2023 - 2029, USD Million
- TABLE 30 Global Driver State Monitoring Market by Region, 2019 - 2022, USD Million
- TABLE 31 Global Driver State Monitoring Market by Region, 2023 - 2029, USD Million
- TABLE 32 Global Driver Health Monitoring Market by Region, 2019 - 2022, USD Million
- TABLE 33 Global Driver Health Monitoring Market by Region, 2023 - 2029, USD Million
- TABLE 34 Global Driver Monitoring Systems Market by Vehicle Type, 2019 - 2022, USD Million
- TABLE 35 Global Driver Monitoring Systems Market by Vehicle Type, 2023 - 2029, USD Million
- TABLE 36 Global Passenger Cars Market by Region, 2019 - 2022, USD Million
- TABLE 37 Global Passenger Cars Market by Region, 2023 - 2029, USD Million
- TABLE 38 Global Light Commercial Vehicles Market by Region, 2019 - 2022, USD Million
- TABLE 39 Global Light Commercial Vehicles Market by Region, 2023 - 2029, USD Million
- TABLE 40 Global Heavy Commercial Vehicles Market by Region, 2019 - 2022, USD Million
- TABLE 41 Global Heavy Commercial Vehicles Market by Region, 2023 - 2029, USD Million
- TABLE 42 Global Driver Monitoring Systems Market by Region, 2019 - 2022, USD Million
- TABLE 43 Global Driver Monitoring Systems Market by Region, 2023 - 2029, USD Million
- TABLE 44 North America Driver Monitoring Systems Market, 2019 - 2022, USD Million
- TABLE 45 North America Driver Monitoring Systems Market, 2023 - 2029, USD Million
- TABLE 46 North America Driver Monitoring Systems Market by Vehicle Propulsion, 2019 - 2022, USD Million
- TABLE 47 North America Driver Monitoring Systems Market by Vehicle Propulsion, 2023 - 2029, USD Million
- TABLE 48 North America ICE Vehicles Market by Country, 2019 - 2022, USD Million
- TABLE 49 North America ICE Vehicles Market by Country, 2023 - 2029, USD Million
- TABLE 50 North America Electric Vehicles Market by Country, 2019 - 2022, USD Million
- TABLE 51 North America Electric Vehicles Market by Country, 2023 - 2029, USD Million
- TABLE 52 North America Driver Monitoring Systems Market by Sales Channel, 2019 - 2022, USD Million
- TABLE 53 North America Driver Monitoring Systems Market by Sales Channel, 2023 - 2029, USD Million
- TABLE 54 North America OEM Market by Country, 2019 - 2022, USD Million
- TABLE 55 North America OEM Market by Country, 2023 - 2029, USD Million
- TABLE 56 North America Aftermarket Market by Country, 2019 - 2022, USD Million
- TABLE 57 North America Aftermarket Market by Country, 2023 - 2029, USD Million
- TABLE 58 North America Driver Monitoring Systems Market by Component, 2019 - 2022, USD Million
- TABLE 59 North America Driver Monitoring Systems Market by Component, 2023 - 2029, USD Million
- TABLE 60 North America Sensors Market by Country, 2019 - 2022, USD Million
- TABLE 61 North America Sensors Market by Country, 2023 - 2029, USD Million
- TABLE 62 North America Cameras Market by Country, 2019 - 2022, USD Million
- TABLE 63 North America Cameras Market by Country, 2023 - 2029, USD Million
- TABLE 64 North America Others Market by Country, 2019 - 2022, USD Million
- TABLE 65 North America Others Market by Country, 2023 - 2029, USD Million
- TABLE 66 North America Driver Monitoring Systems Market by Type of Monitoring, 2019 - 2022, USD Million
- TABLE 67 North America Driver Monitoring Systems Market by Type of Monitoring, 2023 - 2029, USD Million
- TABLE 68 North America Driver State Monitoring Market by Country, 2019 - 2022, USD Million
- TABLE 69 North America Driver State Monitoring Market by Country, 2023 - 2029, USD Million
- TABLE 70 North America Driver Health Monitoring Market by Country, 2019 - 2022, USD Million
- TABLE 71 North America Driver Health Monitoring Market by Country, 2023 - 2029, USD Million
- TABLE 72 North America Driver Monitoring Systems Market by Vehicle Type, 2019 - 2022, USD Million
- TABLE 73 North America Driver Monitoring Systems Market by Vehicle Type, 2023 - 2029, USD Million
- TABLE 74 North America Passenger Cars Market by Country, 2019 - 2022, USD Million
- TABLE 75 North America Passenger Cars Market by Country, 2023 - 2029, USD Million
- TABLE 76 North America Light Commercial Vehicles Market by Country, 2019 - 2022, USD Million
- TABLE 77 North America Light Commercial Vehicles Market by Country, 2023 - 2029, USD Million
- TABLE 78 North America Heavy Commercial Vehicles Market by Country, 2019 - 2022, USD Million
- TABLE 79 North America Heavy Commercial Vehicles Market by Country, 2023 - 2029, USD Million
- TABLE 80 North America Driver Monitoring Systems Market by Country, 2019 - 2022, USD Million
- TABLE 81 North America Driver Monitoring Systems Market by Country, 2023 - 2029, USD Million
- TABLE 82 US Driver Monitoring Systems Market, 2019 - 2022, USD Million
- TABLE 83 US Driver Monitoring Systems Market, 2023 - 2029, USD Million
- TABLE 84 US Driver Monitoring Systems Market by Vehicle Propulsion, 2019 - 2022, USD Million
- TABLE 85 US Driver Monitoring Systems Market by Vehicle Propulsion, 2023 - 2029, USD Million
- TABLE 86 US Driver Monitoring Systems Market by Sales Channel, 2019 - 2022, USD Million
- TABLE 87 US Driver Monitoring Systems Market by Sales Channel, 2023 - 2029, USD Million
- TABLE 88 US Driver Monitoring Systems Market by Component, 2019 - 2022, USD Million
- TABLE 89 US Driver Monitoring Systems Market by Component, 2023 - 2029, USD Million
- TABLE 90 US Driver Monitoring Systems Market by Type of Monitoring, 2019 - 2022, USD Million
- TABLE 91 US Driver Monitoring Systems Market by Type of Monitoring, 2023 - 2029, USD Million
- TABLE 92 US Driver Monitoring Systems Market by Vehicle Type, 2019 - 2022, USD Million
- TABLE 93 US Driver Monitoring Systems Market by Vehicle Type, 2023 - 2029, USD Million
- TABLE 94 Canada Driver Monitoring Systems Market, 2019 - 2022, USD Million
- TABLE 95 Canada Driver Monitoring Systems Market, 2023 - 2029, USD Million
- TABLE 96 Canada Driver Monitoring Systems Market by Vehicle Propulsion, 2019 - 2022, USD Million
- TABLE 97 Canada Driver Monitoring Systems Market by Vehicle Propulsion, 2023 - 2029, USD Million
- TABLE 98 Canada Driver Monitoring Systems Market by Sales Channel, 2019 - 2022, USD Million
- TABLE 99 Canada Driver Monitoring Systems Market by Sales Channel, 2023 - 2029, USD Million
- TABLE 100 Canada Driver Monitoring Systems Market by Component, 2019 - 2022, USD Million
- TABLE 101 Canada Driver Monitoring Systems Market by Component, 2023 - 2029, USD Million
- TABLE 102 Canada Driver Monitoring Systems Market by Type of Monitoring, 2019 - 2022, USD Million
- TABLE 103 Canada Driver Monitoring Systems Market by Type of Monitoring, 2023 - 2029, USD Million
- TABLE 104 Canada Driver Monitoring Systems Market by Vehicle Type, 2019 - 2022, USD Million
- TABLE 105 Canada Driver Monitoring Systems Market by Vehicle Type, 2023 - 2029, USD Million
- TABLE 106 Mexico Driver Monitoring Systems Market, 2019 - 2022, USD Million
- TABLE 107 Mexico Driver Monitoring Systems Market, 2023 - 2029, USD Million
- TABLE 108 Mexico Driver Monitoring Systems Market by Vehicle Propulsion, 2019 - 2022, USD Million
- TABLE 109 Mexico Driver Monitoring Systems Market by Vehicle Propulsion, 2023 - 2029, USD Million
- TABLE 110 Mexico Driver Monitoring Systems Market by Sales Channel, 2019 - 2022, USD Million
- TABLE 111 Mexico Driver Monitoring Systems Market by Sales Channel, 2023 - 2029, USD Million
- TABLE 112 Mexico Driver Monitoring Systems Market by Component, 2019 - 2022, USD Million
- TABLE 113 Mexico Driver Monitoring Systems Market by Component, 2023 - 2029, USD Million
- TABLE 114 Mexico Driver Monitoring Systems Market by Type of Monitoring, 2019 - 2022, USD Million
- TABLE 115 Mexico Driver Monitoring Systems Market by Type of Monitoring, 2023 - 2029, USD Million
- TABLE 116 Mexico Driver Monitoring Systems Market by Vehicle Type, 2019 - 2022, USD Million
- TABLE 117 Mexico Driver Monitoring Systems Market by Vehicle Type, 2023 - 2029, USD Million
- TABLE 118 Rest of North America Driver Monitoring Systems Market, 2019 - 2022, USD Million
- TABLE 119 Rest of North America Driver Monitoring Systems Market, 2023 - 2029, USD Million
- TABLE 120 Rest of North America Driver Monitoring Systems Market by Vehicle Propulsion, 2019 - 2022, USD Million
- TABLE 121 Rest of North America Driver Monitoring Systems Market by Vehicle Propulsion, 2023 - 2029, USD Million
- TABLE 122 Rest of North America Driver Monitoring Systems Market by Sales Channel, 2019 - 2022, USD Million
- TABLE 123 Rest of North America Driver Monitoring Systems Market by Sales Channel, 2023 - 2029, USD Million
- TABLE 124 Rest of North America Driver Monitoring Systems Market by Component, 2019 - 2022, USD Million
- TABLE 125 Rest of North America Driver Monitoring Systems Market by Component, 2023 - 2029, USD Million
- TABLE 126 Rest of North America Driver Monitoring Systems Market by Type of Monitoring, 2019 - 2022, USD Million
- TABLE 127 Rest of North America Driver Monitoring Systems Market by Type of Monitoring, 2023 - 2029, USD Million
- TABLE 128 Rest of North America Driver Monitoring Systems Market by Vehicle Type, 2019 - 2022, USD Million
- TABLE 129 Rest of North America Driver Monitoring Systems Market by Vehicle Type, 2023 - 2029, USD Million
- TABLE 130 Europe Driver Monitoring Systems Market, 2019 - 2022, USD Million
- TABLE 131 Europe Driver Monitoring Systems Market, 2023 - 2029, USD Million
- TABLE 132 Europe Driver Monitoring Systems Market by Vehicle Propulsion, 2019 - 2022, USD Million
- TABLE 133 Europe Driver Monitoring Systems Market by Vehicle Propulsion, 2023 - 2029, USD Million
- TABLE 134 Europe ICE Vehicles Market by Country, 2019 - 2022, USD Million
- TABLE 135 Europe ICE Vehicles Market by Country, 2023 - 2029, USD Million
- TABLE 136 Europe Electric Vehicles Market by Country, 2019 - 2022, USD Million
- TABLE 137 Europe Electric Vehicles Market by Country, 2023 - 2029, USD Million
- TABLE 138 Europe Driver Monitoring Systems Market by Sales Channel, 2019 - 2022, USD Million
- TABLE 139 Europe Driver Monitoring Systems Market by Sales Channel, 2023 - 2029, USD Million
- TABLE 140 Europe OEM Market by Country, 2019 - 2022, USD Million
- TABLE 141 Europe OEM Market by Country, 2023 - 2029, USD Million
- TABLE 142 Europe Aftermarket Market by Country, 2019 - 2022, USD Million
- TABLE 143 Europe Aftermarket Market by Country, 2023 - 2029, USD Million
- TABLE 144 Europe Driver Monitoring Systems Market by Component, 2019 - 2022, USD Million
- TABLE 145 Europe Driver Monitoring Systems Market by Component, 2023 - 2029, USD Million
- TABLE 146 Europe Sensors Market by Country, 2019 - 2022, USD Million
- TABLE 147 Europe Sensors Market by Country, 2023 - 2029, USD Million
- TABLE 148 Europe Cameras Market by Country, 2019 - 2022, USD Million
- TABLE 149 Europe Cameras Market by Country, 2023 - 2029, USD Million
- TABLE 150 Europe Others Market by Country, 2019 - 2022, USD Million
- TABLE 151 Europe Others Market by Country, 2023 - 2029, USD Million
- TABLE 152 Europe Driver Monitoring Systems Market by Type of Monitoring, 2019 - 2022, USD Million
- TABLE 153 Europe Driver Monitoring Systems Market by Type of Monitoring, 2023 - 2029, USD Million
- TABLE 154 Europe Driver State Monitoring Market by Country, 2019 - 2022, USD Million
- TABLE 155 Europe Driver State Monitoring Market by Country, 2023 - 2029, USD Million
- TABLE 156 Europe Driver Health Monitoring Market by Country, 2019 - 2022, USD Million
- TABLE 157 Europe Driver Health Monitoring Market by Country, 2023 - 2029, USD Million
- TABLE 158 Europe Driver Monitoring Systems Market by Vehicle Type, 2019 - 2022, USD Million
- TABLE 159 Europe Driver Monitoring Systems Market by Vehicle Type, 2023 - 2029, USD Million
- TABLE 160 Europe Passenger Cars Market by Country, 2019 - 2022, USD Million
- TABLE 161 Europe Passenger Cars Market by Country, 2023 - 2029, USD Million
- TABLE 162 Europe Light Commercial Vehicles Market by Country, 2019 - 2022, USD Million
- TABLE 163 Europe Light Commercial Vehicles Market by Country, 2023 - 2029, USD Million
- TABLE 164 Europe Heavy Commercial Vehicles Market by Country, 2019 - 2022, USD Million
- TABLE 165 Europe Heavy Commercial Vehicles Market by Country, 2023 - 2029, USD Million
- TABLE 166 Europe Driver Monitoring Systems Market by Country, 2019 - 2022, USD Million
- TABLE 167 Europe Driver Monitoring Systems Market by Country, 2023 - 2029, USD Million
- TABLE 168 Germany Driver Monitoring Systems Market, 2019 - 2022, USD Million
- TABLE 169 Germany Driver Monitoring Systems Market, 2023 - 2029, USD Million
- TABLE 170 Germany Driver Monitoring Systems Market by Vehicle Propulsion, 2019 - 2022, USD Million
- TABLE 171 Germany Driver Monitoring Systems Market by Vehicle Propulsion, 2023 - 2029, USD Million
- TABLE 172 Germany Driver Monitoring Systems Market by Sales Channel, 2019 - 2022, USD Million
- TABLE 173 Germany Driver Monitoring Systems Market by Sales Channel, 2023 - 2029, USD Million
- TABLE 174 Germany Driver Monitoring Systems Market by Component, 2019 - 2022, USD Million
- TABLE 175 Germany Driver Monitoring Systems Market by Component, 2023 - 2029, USD Million
- TABLE 176 Germany Driver Monitoring Systems Market by Type of Monitoring, 2019 - 2022, USD Million
- TABLE 177 Germany Driver Monitoring Systems Market by Type of Monitoring, 2023 - 2029, USD Million
- TABLE 178 Germany Driver Monitoring Systems Market by Vehicle Type, 2019 - 2022, USD Million
- TABLE 179 Germany Driver Monitoring Systems Market by Vehicle Type, 2023 - 2029, USD Million
- TABLE 180 UK Driver Monitoring Systems Market, 2019 - 2022, USD Million
- TABLE 181 UK Driver Monitoring Systems Market, 2023 - 2029, USD Million
- TABLE 182 UK Driver Monitoring Systems Market by Vehicle Propulsion, 2019 - 2022, USD Million
- TABLE 183 UK Driver Monitoring Systems Market by Vehicle Propulsion, 2023 - 2029, USD Million
- TABLE 184 UK Driver Monitoring Systems Market by Sales Channel, 2019 - 2022, USD Million
- TABLE 185 UK Driver Monitoring Systems Market by Sales Channel, 2023 - 2029, USD Million
- TABLE 186 UK Driver Monitoring Systems Market by Component, 2019 - 2022, USD Million
- TABLE 187 UK Driver Monitoring Systems Market by Component, 2023 - 2029, USD Million
- TABLE 188 UK Driver Monitoring Systems Market by Type of Monitoring, 2019 - 2022, USD Million
- TABLE 189 UK Driver Monitoring Systems Market by Type of Monitoring, 2023 - 2029, USD Million
- TABLE 190 UK Driver Monitoring Systems Market by Vehicle Type, 2019 - 2022, USD Million
- TABLE 191 UK Driver Monitoring Systems Market by Vehicle Type, 2023 - 2029, USD Million
- TABLE 192 France Driver Monitoring Systems Market, 2019 - 2022, USD Million
- TABLE 193 France Driver Monitoring Systems Market, 2023 - 2029, USD Million
- TABLE 194 France Driver Monitoring Systems Market by Vehicle Propulsion, 2019 - 2022, USD Million
- TABLE 195 France Driver Monitoring Systems Market by Vehicle Propulsion, 2023 - 2029, USD Million
- TABLE 196 France Driver Monitoring Systems Market by Sales Channel, 2019 - 2022, USD Million
- TABLE 197 France Driver Monitoring Systems Market by Sales Channel, 2023 - 2029, USD Million
- TABLE 198 France Driver Monitoring Systems Market by Component, 2019 - 2022, USD Million
- TABLE 199 France Driver Monitoring Systems Market by Component, 2023 - 2029, USD Million
- TABLE 200 France Driver Monitoring Systems Market by Type of Monitoring, 2019 - 2022, USD Million
- TABLE 201 France Driver Monitoring Systems Market by Type of Monitoring, 2023 - 2029, USD Million
- TABLE 202 France Driver Monitoring Systems Market by Vehicle Type, 2019 - 2022, USD Million
- TABLE 203 France Driver Monitoring Systems Market by Vehicle Type, 2023 - 2029, USD Million
- TABLE 204 Russia Driver Monitoring Systems Market, 2019 - 2022, USD Million
- TABLE 205 Russia Driver Monitoring Systems Market, 2023 - 2029, USD Million
- TABLE 206 Russia Driver Monitoring Systems Market by Vehicle Propulsion, 2019 - 2022, USD Million
- TABLE 207 Russia Driver Monitoring Systems Market by Vehicle Propulsion, 2023 - 2029, USD Million
- TABLE 208 Russia Driver Monitoring Systems Market by Sales Channel, 2019 - 2022, USD Million
- TABLE 209 Russia Driver Monitoring Systems Market by Sales Channel, 2023 - 2029, USD Million
- TABLE 210 Russia Driver Monitoring Systems Market by Component, 2019 - 2022, USD Million
- TABLE 211 Russia Driver Monitoring Systems Market by Component, 2023 - 2029, USD Million
- TABLE 212 Russia Driver Monitoring Systems Market by Type of Monitoring, 2019 - 2022, USD Million
- TABLE 213 Russia Driver Monitoring Systems Market by Type of Monitoring, 2023 - 2029, USD Million
- TABLE 214 Russia Driver Monitoring Systems Market by Vehicle Type, 2019 - 2022, USD Million
- TABLE 215 Russia Driver Monitoring Systems Market by Vehicle Type, 2023 - 2029, USD Million
- TABLE 216 Spain Driver Monitoring Systems Market, 2019 - 2022, USD Million
- TABLE 217 Spain Driver Monitoring Systems Market, 2023 - 2029, USD Million
- TABLE 218 Spain Driver Monitoring Systems Market by Vehicle Propulsion, 2019 - 2022, USD Million
- TABLE 219 Spain Driver Monitoring Systems Market by Vehicle Propulsion, 2023 - 2029, USD Million
- TABLE 220 Spain Driver Monitoring Systems Market by Sales Channel, 2019 - 2022, USD Million
- TABLE 221 Spain Driver Monitoring Systems Market by Sales Channel, 2023 - 2029, USD Million
- TABLE 222 Spain Driver Monitoring Systems Market by Component, 2019 - 2022, USD Million
- TABLE 223 Spain Driver Monitoring Systems Market by Component, 2023 - 2029, USD Million
- TABLE 224 Spain Driver Monitoring Systems Market by Type of Monitoring, 2019 - 2022, USD Million
- TABLE 225 Spain Driver Monitoring Systems Market by Type of Monitoring, 2023 - 2029, USD Million
- TABLE 226 Spain Driver Monitoring Systems Market by Vehicle Type, 2019 - 2022, USD Million
- TABLE 227 Spain Driver Monitoring Systems Market by Vehicle Type, 2023 - 2029, USD Million
- TABLE 228 Italy Driver Monitoring Systems Market, 2019 - 2022, USD Million
- TABLE 229 Italy Driver Monitoring Systems Market, 2023 - 2029, USD Million
- TABLE 230 Italy Driver Monitoring Systems Market by Vehicle Propulsion, 2019 - 2022, USD Million
- TABLE 231 Italy Driver Monitoring Systems Market by Vehicle Propulsion, 2023 - 2029, USD Million
- TABLE 232 Italy Driver Monitoring Systems Market by Sales Channel, 2019 - 2022, USD Million
- TABLE 233 Italy Driver Monitoring Systems Market by Sales Channel, 2023 - 2029, USD Million
- TABLE 234 Italy Driver Monitoring Systems Market by Component, 2019 - 2022, USD Million
- TABLE 235 Italy Driver Monitoring Systems Market by Component, 2023 - 2029, USD Million
- TABLE 236 Italy Driver Monitoring Systems Market by Type of Monitoring, 2019 - 2022, USD Million
- TABLE 237 Italy Driver Monitoring Systems Market by Type of Monitoring, 2023 - 2029, USD Million
- TABLE 238 Italy Driver Monitoring Systems Market by Vehicle Type, 2019 - 2022, USD Million
- TABLE 239 Italy Driver Monitoring Systems Market by Vehicle Type, 2023 - 2029, USD Million
- TABLE 240 Rest of Europe Driver Monitoring Systems Market, 2019 - 2022, USD Million
- TABLE 241 Rest of Europe Driver Monitoring Systems Market, 2023 - 2029, USD Million
- TABLE 242 Rest of Europe Driver Monitoring Systems Market by Vehicle Propulsion, 2019 - 2022, USD Million
- TABLE 243 Rest of Europe Driver Monitoring Systems Market by Vehicle Propulsion, 2023 - 2029, USD Million
- TABLE 244 Rest of Europe Driver Monitoring Systems Market by Sales Channel, 2019 - 2022, USD Million
- TABLE 245 Rest of Europe Driver Monitoring Systems Market by Sales Channel, 2023 - 2029, USD Million
- TABLE 246 Rest of Europe Driver Monitoring Systems Market by Component, 2019 - 2022, USD Million
- TABLE 247 Rest of Europe Driver Monitoring Systems Market by Component, 2023 - 2029, USD Million
- TABLE 248 Rest of Europe Driver Monitoring Systems Market by Type of Monitoring, 2019 - 2022, USD Million
- TABLE 249 Rest of Europe Driver Monitoring Systems Market by Type of Monitoring, 2023 - 2029, USD Million
- TABLE 250 Rest of Europe Driver Monitoring Systems Market by Vehicle Type, 2019 - 2022, USD Million
- TABLE 251 Rest of Europe Driver Monitoring Systems Market by Vehicle Type, 2023 - 2029, USD Million
- TABLE 252 Asia Pacific Driver Monitoring Systems Market, 2019 - 2022, USD Million
- TABLE 253 Asia Pacific Driver Monitoring Systems Market, 2023 - 2029, USD Million
- TABLE 254 Asia Pacific Driver Monitoring Systems Market by Vehicle Propulsion, 2019 - 2022, USD Million
- TABLE 255 Asia Pacific Driver Monitoring Systems Market by Vehicle Propulsion, 2023 - 2029, USD Million
- TABLE 256 Asia Pacific ICE Vehicles Market by Country, 2019 - 2022, USD Million
- TABLE 257 Asia Pacific ICE Vehicles Market by Country, 2023 - 2029, USD Million
- TABLE 258 Asia Pacific Electric Vehicles Market by Country, 2019 - 2022, USD Million
- TABLE 259 Asia Pacific Electric Vehicles Market by Country, 2023 - 2029, USD Million
- TABLE 260 Asia Pacific Driver Monitoring Systems Market by Sales Channel, 2019 - 2022, USD Million
- TABLE 261 Asia Pacific Driver Monitoring Systems Market by Sales Channel, 2023 - 2029, USD Million
- TABLE 262 Asia Pacific OEM Market by Country, 2019 - 2022, USD Million
- TABLE 263 Asia Pacific OEM Market by Country, 2023 - 2029, USD Million
- TABLE 264 Asia Pacific Aftermarket Market by Country, 2019 - 2022, USD Million
- TABLE 265 Asia Pacific Aftermarket Market by Country, 2023 - 2029, USD Million
- TABLE 266 Asia Pacific Driver Monitoring Systems Market by Component, 2019 - 2022, USD Million
- TABLE 267 Asia Pacific Driver Monitoring Systems Market by Component, 2023 - 2029, USD Million
- TABLE 268 Asia Pacific Sensors Market by Country, 2019 - 2022, USD Million
- TABLE 269 Asia Pacific Sensors Market by Country, 2023 - 2029, USD Million
- TABLE 270 Asia Pacific Cameras Market by Country, 2019 - 2022, USD Million
- TABLE 271 Asia Pacific Cameras Market by Country, 2023 - 2029, USD Million
- TABLE 272 Asia Pacific Others Market by Country, 2019 - 2022, USD Million
- TABLE 273 Asia Pacific Others Market by Country, 2023 - 2029, USD Million
- TABLE 274 Asia Pacific Driver Monitoring Systems Market by Type of Monitoring, 2019 - 2022, USD Million
- TABLE 275 Asia Pacific Driver Monitoring Systems Market by Type of Monitoring, 2023 - 2029, USD Million
- TABLE 276 Asia Pacific Driver State Monitoring Market by Country, 2019 - 2022, USD Million
- TABLE 277 Asia Pacific Driver State Monitoring Market by Country, 2023 - 2029, USD Million
- TABLE 278 Asia Pacific Driver Health Monitoring Market by Country, 2019 - 2022, USD Million
- TABLE 279 Asia Pacific Driver Health Monitoring Market by Country, 2023 - 2029, USD Million
- TABLE 280 Asia Pacific Driver Monitoring Systems Market by Vehicle Type, 2019 - 2022, USD Million
- TABLE 281 Asia Pacific Driver Monitoring Systems Market by Vehicle Type, 2023 - 2029, USD Million
- TABLE 282 Asia Pacific Passenger Cars Market by Country, 2019 - 2022, USD Million
- TABLE 283 Asia Pacific Passenger Cars Market by Country, 2023 - 2029, USD Million
- TABLE 284 Asia Pacific Light Commercial Vehicles Market by Country, 2019 - 2022, USD Million
- TABLE 285 Asia Pacific Light Commercial Vehicles Market by Country, 2023 - 2029, USD Million
- TABLE 286 Asia Pacific Heavy Commercial Vehicles Market by Country, 2019 - 2022, USD Million
- TABLE 287 Asia Pacific Heavy Commercial Vehicles Market by Country, 2023 - 2029, USD Million
- TABLE 288 Asia Pacific Driver Monitoring Systems Market by Country, 2019 - 2022, USD Million
- TABLE 289 Asia Pacific Driver Monitoring Systems Market by Country, 2023 - 2029, USD Million
- TABLE 290 China Driver Monitoring Systems Market, 2019 - 2022, USD Million
- TABLE 291 China Driver Monitoring Systems Market, 2023 - 2029, USD Million
- TABLE 292 China Driver Monitoring Systems Market by Vehicle Propulsion, 2019 - 2022, USD Million
- TABLE 293 China Driver Monitoring Systems Market by Vehicle Propulsion, 2023 - 2029, USD Million
- TABLE 294 China Driver Monitoring Systems Market by Sales Channel, 2019 - 2022, USD Million
- TABLE 295 China Driver Monitoring Systems Market by Sales Channel, 2023 - 2029, USD Million
- TABLE 296 China Driver Monitoring Systems Market by Component, 2019 - 2022, USD Million
- TABLE 297 China Driver Monitoring Systems Market by Component, 2023 - 2029, USD Million
- TABLE 298 China Driver Monitoring Systems Market by Type of Monitoring, 2019 - 2022, USD Million
- TABLE 299 China Driver Monitoring Systems Market by Type of Monitoring, 2023 - 2029, USD Million
- TABLE 300 China Driver Monitoring Systems Market by Vehicle Type, 2019 - 2022, USD Million
- TABLE 301 China Driver Monitoring Systems Market by Vehicle Type, 2023 - 2029, USD Million
- TABLE 302 Japan Driver Monitoring Systems Market, 2019 - 2022, USD Million
- TABLE 303 Japan Driver Monitoring Systems Market, 2023 - 2029, USD Million
- TABLE 304 Japan Driver Monitoring Systems Market by Vehicle Propulsion, 2019 - 2022, USD Million
- TABLE 305 Japan Driver Monitoring Systems Market by Vehicle Propulsion, 2023 - 2029, USD Million
- TABLE 306 Japan Driver Monitoring Systems Market by Sales Channel, 2019 - 2022, USD Million
- TABLE 307 Japan Driver Monitoring Systems Market by Sales Channel, 2023 - 2029, USD Million
- TABLE 308 Japan Driver Monitoring Systems Market by Component, 2019 - 2022, USD Million
- TABLE 309 Japan Driver Monitoring Systems Market by Component, 2023 - 2029, USD Million
- TABLE 310 Japan Driver Monitoring Systems Market by Type of Monitoring, 2019 - 2022, USD Million
- TABLE 311 Japan Driver Monitoring Systems Market by Type of Monitoring, 2023 - 2029, USD Million
- TABLE 312 Japan Driver Monitoring Systems Market by Vehicle Type, 2019 - 2022, USD Million
- TABLE 313 Japan Driver Monitoring Systems Market by Vehicle Type, 2023 - 2029, USD Million
- TABLE 314 India Driver Monitoring Systems Market, 2019 - 2022, USD Million
- TABLE 315 India Driver Monitoring Systems Market, 2023 - 2029, USD Million
- TABLE 316 India Driver Monitoring Systems Market by Vehicle Propulsion, 2019 - 2022, USD Million
- TABLE 317 India Driver Monitoring Systems Market by Vehicle Propulsion, 2023 - 2029, USD Million
- TABLE 318 India Driver Monitoring Systems Market by Sales Channel, 2019 - 2022, USD Million
- TABLE 319 India Driver Monitoring Systems Market by Sales Channel, 2023 - 2029, USD Million
- TABLE 320 India Driver Monitoring Systems Market by Component, 2019 - 2022, USD Million
- TABLE 321 India Driver Monitoring Systems Market by Component, 2023 - 2029, USD Million
- TABLE 322 India Driver Monitoring Systems Market by Type of Monitoring, 2019 - 2022, USD Million
- TABLE 323 India Driver Monitoring Systems Market by Type of Monitoring, 2023 - 2029, USD Million
- TABLE 324 India Driver Monitoring Systems Market by Vehicle Type, 2019 - 2022, USD Million
- TABLE 325 India Driver Monitoring Systems Market by Vehicle Type, 2023 - 2029, USD Million
- TABLE 326 South Korea Driver Monitoring Systems Market, 2019 - 2022, USD Million
- TABLE 327 South Korea Driver Monitoring Systems Market, 2023 - 2029, USD Million
- TABLE 328 South Korea Driver Monitoring Systems Market by Vehicle Propulsion, 2019 - 2022, USD Million
- TABLE 329 South Korea Driver Monitoring Systems Market by Vehicle Propulsion, 2023 - 2029, USD Million
- TABLE 330 South Korea Driver Monitoring Systems Market by Sales Channel, 2019 - 2022, USD Million
- TABLE 331 South Korea Driver Monitoring Systems Market by Sales Channel, 2023 - 2029, USD Million
- TABLE 332 South Korea Driver Monitoring Systems Market by Component, 2019 - 2022, USD Million
- TABLE 333 South Korea Driver Monitoring Systems Market by Component, 2023 - 2029, USD Million
- TABLE 334 South Korea Driver Monitoring Systems Market by Type of Monitoring, 2019 - 2022, USD Million
- TABLE 335 South Korea Driver Monitoring Systems Market by Type of Monitoring, 2023 - 2029, USD Million
- TABLE 336 South Korea Driver Monitoring Systems Market by Vehicle Type, 2019 - 2022, USD Million
- TABLE 337 South Korea Driver Monitoring Systems Market by Vehicle Type, 2023 - 2029, USD Million
- TABLE 338 Singapore Driver Monitoring Systems Market, 2019 - 2022, USD Million
- TABLE 339 Singapore Driver Monitoring Systems Market, 2023 - 2029, USD Million
- TABLE 340 Singapore Driver Monitoring Systems Market by Vehicle Propulsion, 2019 - 2022, USD Million
- TABLE 341 Singapore Driver Monitoring Systems Market by Vehicle Propulsion, 2023 - 2029, USD Million
- TABLE 342 Singapore Driver Monitoring Systems Market by Sales Channel, 2019 - 2022, USD Million
- TABLE 343 Singapore Driver Monitoring Systems Market by Sales Channel, 2023 - 2029, USD Million
- TABLE 344 Singapore Driver Monitoring Systems Market by Component, 2019 - 2022, USD Million
- TABLE 345 Singapore Driver Monitoring Systems Market by Component, 2023 - 2029, USD Million
- TABLE 346 Singapore Driver Monitoring Systems Market by Type of Monitoring, 2019 - 2022, USD Million
- TABLE 347 Singapore Driver Monitoring Systems Market by Type of Monitoring, 2023 - 2029, USD Million
- TABLE 348 Singapore Driver Monitoring Systems Market by Vehicle Type, 2019 - 2022, USD Million
- TABLE 349 Singapore Driver Monitoring Systems Market by Vehicle Type, 2023 - 2029, USD Million
- TABLE 350 Malaysia Driver Monitoring Systems Market, 2019 - 2022, USD Million
- TABLE 351 Malaysia Driver Monitoring Systems Market, 2023 - 2029, USD Million
- TABLE 352 Malaysia Driver Monitoring Systems Market by Vehicle Propulsion, 2019 - 2022, USD Million
- TABLE 353 Malaysia Driver Monitoring Systems Market by Vehicle Propulsion, 2023 - 2029, USD Million
- TABLE 354 Malaysia Driver Monitoring Systems Market by Sales Channel, 2019 - 2022, USD Million
- TABLE 355 Malaysia Driver Monitoring Systems Market by Sales Channel, 2023 - 2029, USD Million
- TABLE 356 Malaysia Driver Monitoring Systems Market by Component, 2019 - 2022, USD Million
- TABLE 357 Malaysia Driver Monitoring Systems Market by Component, 2023 - 2029, USD Million
- TABLE 358 Malaysia Driver Monitoring Systems Market by Type of Monitoring, 2019 - 2022, USD Million
- TABLE 359 Malaysia Driver Monitoring Systems Market by Type of Monitoring, 2023 - 2029, USD Million
- TABLE 360 Malaysia Driver Monitoring Systems Market by Vehicle Type, 2019 - 2022, USD Million
- TABLE 361 Malaysia Driver Monitoring Systems Market by Vehicle Type, 2023 - 2029, USD Million
- TABLE 362 Rest of Asia Pacific Driver Monitoring Systems Market, 2019 - 2022, USD Million
- TABLE 363 Rest of Asia Pacific Driver Monitoring Systems Market, 2023 - 2029, USD Million
- TABLE 364 Rest of Asia Pacific Driver Monitoring Systems Market by Vehicle Propulsion, 2019 - 2022, USD Million
- TABLE 365 Rest of Asia Pacific Driver Monitoring Systems Market by Vehicle Propulsion, 2023 - 2029, USD Million
- TABLE 366 Rest of Asia Pacific Driver Monitoring Systems Market by Sales Channel, 2019 - 2022, USD Million
- TABLE 367 Rest of Asia Pacific Driver Monitoring Systems Market by Sales Channel, 2023 - 2029, USD Million
- TABLE 368 Rest of Asia Pacific Driver Monitoring Systems Market by Component, 2019 - 2022, USD Million
- TABLE 369 Rest of Asia Pacific Driver Monitoring Systems Market by Component, 2023 - 2029, USD Million
- TABLE 370 Rest of Asia Pacific Driver Monitoring Systems Market by Type of Monitoring, 2019 - 2022, USD Million
- TABLE 371 Rest of Asia Pacific Driver Monitoring Systems Market by Type of Monitoring, 2023 - 2029, USD Million
- TABLE 372 Rest of Asia Pacific Driver Monitoring Systems Market by Vehicle Type, 2019 - 2022, USD Million
- TABLE 373 Rest of Asia Pacific Driver Monitoring Systems Market by Vehicle Type, 2023 - 2029, USD Million
- TABLE 374 LAMEA Driver Monitoring Systems Market, 2019 - 2022, USD Million
- TABLE 375 LAMEA Driver Monitoring Systems Market, 2023 - 2029, USD Million
- TABLE 376 LAMEA Driver Monitoring Systems Market by Vehicle Propulsion, 2019 - 2022, USD Million
- TABLE 377 LAMEA Driver Monitoring Systems Market by Vehicle Propulsion, 2023 - 2029, USD Million
- TABLE 378 LAMEA ICE Vehicles Market by Country, 2019 - 2022, USD Million
- TABLE 379 LAMEA ICE Vehicles Market by Country, 2023 - 2029, USD Million
- TABLE 380 LAMEA Electric Vehicles Market by Country, 2019 - 2022, USD Million
- TABLE 381 LAMEA Electric Vehicles Market by Country, 2023 - 2029, USD Million
- TABLE 382 LAMEA Driver Monitoring Systems Market by Sales Channel, 2019 - 2022, USD Million
- TABLE 383 LAMEA Driver Monitoring Systems Market by Sales Channel, 2023 - 2029, USD Million
- TABLE 384 LAMEA OEM Market by Country, 2019 - 2022, USD Million
- TABLE 385 LAMEA OEM Market by Country, 2023 - 2029, USD Million
- TABLE 386 LAMEA Aftermarket Market by Country, 2019 - 2022, USD Million
- TABLE 387 LAMEA Aftermarket Market by Country, 2023 - 2029, USD Million
- TABLE 388 LAMEA Driver Monitoring Systems Market by Component, 2019 - 2022, USD Million
- TABLE 389 LAMEA Driver Monitoring Systems Market by Component, 2023 - 2029, USD Million
- TABLE 390 LAMEA Sensors Market by Country, 2019 - 2022, USD Million
- TABLE 391 LAMEA Sensors Market by Country, 2023 - 2029, USD Million
- TABLE 392 LAMEA Cameras Market by Country, 2019 - 2022, USD Million
- TABLE 393 LAMEA Cameras Market by Country, 2023 - 2029, USD Million
- TABLE 394 LAMEA Others Market by Country, 2019 - 2022, USD Million
- TABLE 395 LAMEA Others Market by Country, 2023 - 2029, USD Million
- TABLE 396 LAMEA Driver Monitoring Systems Market by Type of Monitoring, 2019 - 2022, USD Million
- TABLE 397 LAMEA Driver Monitoring Systems Market by Type of Monitoring, 2023 - 2029, USD Million
- TABLE 398 LAMEA Driver State Monitoring Market by Country, 2019 - 2022, USD Million
- TABLE 399 LAMEA Driver State Monitoring Market by Country, 2023 - 2029, USD Million
- TABLE 400 LAMEA Driver Health Monitoring Market by Country, 2019 - 2022, USD Million
- TABLE 401 LAMEA Driver Health Monitoring Market by Country, 2023 - 2029, USD Million
- TABLE 402 LAMEA Driver Monitoring Systems Market by Vehicle Type, 2019 - 2022, USD Million
- TABLE 403 LAMEA Driver Monitoring Systems Market by Vehicle Type, 2023 - 2029, USD Million
- TABLE 404 LAMEA Passenger Cars Market by Country, 2019 - 2022, USD Million
- TABLE 405 LAMEA Passenger Cars Market by Country, 2023 - 2029, USD Million
- TABLE 406 LAMEA Light Commercial Vehicles Market by Country, 2019 - 2022, USD Million
- TABLE 407 LAMEA Light Commercial Vehicles Market by Country, 2023 - 2029, USD Million
- TABLE 408 LAMEA Heavy Commercial Vehicles Market by Country, 2019 - 2022, USD Million
- TABLE 409 LAMEA Heavy Commercial Vehicles Market by Country, 2023 - 2029, USD Million
- TABLE 410 LAMEA Driver Monitoring Systems Market by Country, 2019 - 2022, USD Million
- TABLE 411 LAMEA Driver Monitoring Systems Market by Country, 2023 - 2029, USD Million
- TABLE 412 Brazil Driver Monitoring Systems Market, 2019 - 2022, USD Million
- TABLE 413 Brazil Driver Monitoring Systems Market, 2023 - 2029, USD Million
- TABLE 414 Brazil Driver Monitoring Systems Market by Vehicle Propulsion, 2019 - 2022, USD Million
- TABLE 415 Brazil Driver Monitoring Systems Market by Vehicle Propulsion, 2023 - 2029, USD Million
- TABLE 416 Brazil Driver Monitoring Systems Market by Sales Channel, 2019 - 2022, USD Million
- TABLE 417 Brazil Driver Monitoring Systems Market by Sales Channel, 2023 - 2029, USD Million
- TABLE 418 Brazil Driver Monitoring Systems Market by Component, 2019 - 2022, USD Million
- TABLE 419 Brazil Driver Monitoring Systems Market by Component, 2023 - 2029, USD Million
- TABLE 420 Brazil Driver Monitoring Systems Market by Type of Monitoring, 2019 - 2022, USD Million
- TABLE 421 Brazil Driver Monitoring Systems Market by Type of Monitoring, 2023 - 2029, USD Million
- TABLE 422 Brazil Driver Monitoring Systems Market by Vehicle Type, 2019 - 2022, USD Million
- TABLE 423 Brazil Driver Monitoring Systems Market by Vehicle Type, 2023 - 2029, USD Million
- TABLE 424 Argentina Driver Monitoring Systems Market, 2019 - 2022, USD Million
- TABLE 425 Argentina Driver Monitoring Systems Market, 2023 - 2029, USD Million
- TABLE 426 Argentina Driver Monitoring Systems Market by Vehicle Propulsion, 2019 - 2022, USD Million
- TABLE 427 Argentina Driver Monitoring Systems Market by Vehicle Propulsion, 2023 - 2029, USD Million
- TABLE 428 Argentina Driver Monitoring Systems Market by Sales Channel, 2019 - 2022, USD Million
- TABLE 429 Argentina Driver Monitoring Systems Market by Sales Channel, 2023 - 2029, USD Million
- TABLE 430 Argentina Driver Monitoring Systems Market by Component, 2019 - 2022, USD Million
- TABLE 431 Argentina Driver Monitoring Systems Market by Component, 2023 - 2029, USD Million
- TABLE 432 Argentina Driver Monitoring Systems Market by Type of Monitoring, 2019 - 2022, USD Million
- TABLE 433 Argentina Driver Monitoring Systems Market by Type of Monitoring, 2023 - 2029, USD Million
- TABLE 434 Argentina Driver Monitoring Systems Market by Vehicle Type, 2019 - 2022, USD Million
- TABLE 435 Argentina Driver Monitoring Systems Market by Vehicle Type, 2023 - 2029, USD Million
- TABLE 436 UAE Driver Monitoring Systems Market, 2019 - 2022, USD Million
- TABLE 437 UAE Driver Monitoring Systems Market, 2023 - 2029, USD Million
- TABLE 438 UAE Driver Monitoring Systems Market by Vehicle Propulsion, 2019 - 2022, USD Million
- TABLE 439 UAE Driver Monitoring Systems Market by Vehicle Propulsion, 2023 - 2029, USD Million
- TABLE 440 UAE Driver Monitoring Systems Market by Sales Channel, 2019 - 2022, USD Million
- TABLE 441 UAE Driver Monitoring Systems Market by Sales Channel, 2023 - 2029, USD Million
- TABLE 442 UAE Driver Monitoring Systems Market by Component, 2019 - 2022, USD Million
- TABLE 443 UAE Driver Monitoring Systems Market by Component, 2023 - 2029, USD Million
- TABLE 444 UAE Driver Monitoring Systems Market by Type of Monitoring, 2019 - 2022, USD Million
- TABLE 445 UAE Driver Monitoring Systems Market by Type of Monitoring, 2023 - 2029, USD Million
- TABLE 446 UAE Driver Monitoring Systems Market by Vehicle Type, 2019 - 2022, USD Million
- TABLE 447 UAE Driver Monitoring Systems Market by Vehicle Type, 2023 - 2029, USD Million
- TABLE 448 Saudi Arabia Driver Monitoring Systems Market, 2019 - 2022, USD Million
- TABLE 449 Saudi Arabia Driver Monitoring Systems Market, 2023 - 2029, USD Million
- TABLE 450 Saudi Arabia Driver Monitoring Systems Market by Vehicle Propulsion, 2019 - 2022, USD Million
- TABLE 451 Saudi Arabia Driver Monitoring Systems Market by Vehicle Propulsion, 2023 - 2029, USD Million
- TABLE 452 Saudi Arabia Driver Monitoring Systems Market by Sales Channel, 2019 - 2022, USD Million
- TABLE 453 Saudi Arabia Driver Monitoring Systems Market by Sales Channel, 2023 - 2029, USD Million
- TABLE 454 Saudi Arabia Driver Monitoring Systems Market by Component, 2019 - 2022, USD Million
- TABLE 455 Saudi Arabia Driver Monitoring Systems Market by Component, 2023 - 2029, USD Million
- TABLE 456 Saudi Arabia Driver Monitoring Systems Market by Type of Monitoring, 2019 - 2022, USD Million
- TABLE 457 Saudi Arabia Driver Monitoring Systems Market by Type of Monitoring, 2023 - 2029, USD Million
- TABLE 458 Saudi Arabia Driver Monitoring Systems Market by Vehicle Type, 2019 - 2022, USD Million
- TABLE 459 Saudi Arabia Driver Monitoring Systems Market by Vehicle Type, 2023 - 2029, USD Million
- TABLE 460 South Africa Driver Monitoring Systems Market, 2019 - 2022, USD Million
- TABLE 461 South Africa Driver Monitoring Systems Market, 2023 - 2029, USD Million
- TABLE 462 South Africa Driver Monitoring Systems Market by Vehicle Propulsion, 2019 - 2022, USD Million
- TABLE 463 South Africa Driver Monitoring Systems Market by Vehicle Propulsion, 2023 - 2029, USD Million
- TABLE 464 South Africa Driver Monitoring Systems Market by Sales Channel, 2019 - 2022, USD Million
- TABLE 465 South Africa Driver Monitoring Systems Market by Sales Channel, 2023 - 2029, USD Million
- TABLE 466 South Africa Driver Monitoring Systems Market by Component, 2019 - 2022, USD Million
- TABLE 467 South Africa Driver Monitoring Systems Market by Component, 2023 - 2029, USD Million
- TABLE 468 South Africa Driver Monitoring Systems Market by Type of Monitoring, 2019 - 2022, USD Million
- TABLE 469 South Africa Driver Monitoring Systems Market by Type of Monitoring, 2023 - 2029, USD Million
- TABLE 470 South Africa Driver Monitoring Systems Market by Vehicle Type, 2019 - 2022, USD Million
- TABLE 471 South Africa Driver Monitoring Systems Market by Vehicle Type, 2023 - 2029, USD Million
- TABLE 472 Nigeria Driver Monitoring Systems Market, 2019 - 2022, USD Million
- TABLE 473 Nigeria Driver Monitoring Systems Market, 2023 - 2029, USD Million
- TABLE 474 Nigeria Driver Monitoring Systems Market by Vehicle Propulsion, 2019 - 2022, USD Million
- TABLE 475 Nigeria Driver Monitoring Systems Market by Vehicle Propulsion, 2023 - 2029, USD Million
- TABLE 476 Nigeria Driver Monitoring Systems Market by Sales Channel, 2019 - 2022, USD Million
- TABLE 477 Nigeria Driver Monitoring Systems Market by Sales Channel, 2023 - 2029, USD Million
- TABLE 478 Nigeria Driver Monitoring Systems Market by Component, 2019 - 2022, USD Million
- TABLE 479 Nigeria Driver Monitoring Systems Market by Component, 2023 - 2029, USD Million
- TABLE 480 Nigeria Driver Monitoring Systems Market by Type of Monitoring, 2019 - 2022, USD Million
- TABLE 481 Nigeria Driver Monitoring Systems Market by Type of Monitoring, 2023 - 2029, USD Million
- TABLE 482 Nigeria Driver Monitoring Systems Market by Vehicle Type, 2019 - 2022, USD Million
- TABLE 483 Nigeria Driver Monitoring Systems Market by Vehicle Type, 2023 - 2029, USD Million
- TABLE 484 Rest of LAMEA Driver Monitoring Systems Market, 2019 - 2022, USD Million
- TABLE 485 Rest of LAMEA Driver Monitoring Systems Market, 2023 - 2029, USD Million
- TABLE 486 Rest of LAMEA Driver Monitoring Systems Market by Vehicle Propulsion, 2019 - 2022, USD Million
- TABLE 487 Rest of LAMEA Driver Monitoring Systems Market by Vehicle Propulsion, 2023 - 2029, USD Million
- TABLE 488 Rest of LAMEA Driver Monitoring Systems Market by Sales Channel, 2019 - 2022, USD Million
- TABLE 489 Rest of LAMEA Driver Monitoring Systems Market by Sales Channel, 2023 - 2029, USD Million
- TABLE 490 Rest of LAMEA Driver Monitoring Systems Market by Component, 2019 - 2022, USD Million
- TABLE 491 Rest of LAMEA Driver Monitoring Systems Market by Component, 2023 - 2029, USD Million
- TABLE 492 Rest of LAMEA Driver Monitoring Systems Market by Type of Monitoring, 2019 - 2022, USD Million
- TABLE 493 Rest of LAMEA Driver Monitoring Systems Market by Type of Monitoring, 2023 - 2029, USD Million
- TABLE 494 Rest of LAMEA Driver Monitoring Systems Market by Vehicle Type, 2019 - 2022, USD Million
- TABLE 495 Rest of LAMEA Driver Monitoring Systems Market by Vehicle Type, 2023 - 2029, USD Million
- TABLE 496 Key Information - Continental AG
- TABLE 497 Key Information - NXP Semiconductors N.V.
- TABLE 498 Key Information - Intel Corporation
- TABLE 499 key information - Robert Bosch GmbH
- TABLE 500 Key Information - Panasonic Holdings Corporation
- TABLE 501 Key Information - Hitachi, Ltd.
- TABLE 502 key information - Renesas Electronics Corporation
- TABLE 503 Key Information - ZF Friedrichshafen AG
- TABLE 504 key information - Denso Corporation
- TABLE 505 key information - Valeo SA
List of Figures
- FIG 1 Methodology for the research
- FIG 2 KBV Cardinal Matrix
- FIG 3 Key Leading Strategies: Percentage Distribution (2019-2023)
- FIG 4 Global Driver Monitoring Systems Market share by Vehicle Propulsion, 2022
- FIG 5 Global Driver Monitoring Systems Market share by Vehicle Propulsion, 2029
- FIG 6 Global Driver Monitoring Systems Market by Vehicle Propulsion, 2019 - 2029, USD Million
- FIG 7 Global Driver Monitoring Systems Market share by Sales Channel, 2022
- FIG 8 Global Driver Monitoring Systems Market share by Sales Channel, 2029
- FIG 9 Global Driver Monitoring Systems Market by Sales Channel, 2019 - 2029, USD Million
- FIG 10 Global Driver Monitoring Systems Market share by Component, 2022
- FIG 11 Global Driver Monitoring Systems Market share by Component, 2029
- FIG 12 Global Driver Monitoring Systems Market by Component, 2019 - 2029, USD Million
- FIG 13 Global Driver Monitoring Systems Market share by Type of Monitoring, 2022
- FIG 14 Global Driver Monitoring Systems Market share by Type of Monitoring, 2029
- FIG 15 Global Driver Monitoring Systems Market by Type of Monitoring, 2019 - 2029, USD Million
- FIG 16 Global Driver Monitoring Systems Market share by Vehicle Type, 2022
- FIG 17 Global Driver Monitoring Systems Market share by Vehicle Type, 2029
- FIG 18 Global Driver Monitoring Systems Market by Vehicle Type, 2019 - 2029, USD Million
- FIG 19 Global Driver Monitoring Systems Market share by Region, 2022
- FIG 20 Global Driver Monitoring Systems Market share by Region, 2029
- FIG 21 Global Driver Monitoring Systems Market by Region, 2019 - 2029, USD Million
- FIG 22 Recent strategies and developments: Continental AG
- FIG 23 SWOT Analysis: Continental AG
- FIG 24 Swot analysis: NXP semiconductors N.V.
- FIG 25 SWOT analysis: Intel corporation
- FIG 26 Swot analysis: Robert Bosch GmbH
- FIG 27 SWOT Analysis: Panasonic Holdings Corporation
- FIG 28 SWOT Analysis: Hitachi, ltd.
- FIG 29 Recent strategies and developments: Renesas Electronics Corporation
- FIG 30 Recent strategies and developments: ZF Friedrichshafen AG
The Global Driver Monitoring Systems Market size is expected to reach $3.4 billion by 2029, rising at a market growth of 9.6% CAGR during the forecast period.
A safety feature in cars called the Driver Monitoring System (DMS), often referred to as the Driver State Sensing (DSS) system, aids in preventing accidents brought on by driver weariness. The DMS system employs multiple cameras to monitor the driver's eyes and alert the driver if their attention level is diminished. This product incorporates a driver-facing camera that is equipped with infrared LEDs to detect the driver's face and eyes, even in low-light conditions or if the driver is wearing sunglasses. In addition, the DMS system can detect driver attentiveness by monitoring engagement in different activities such as drinking, eating, using a cell phone, and more.
The demand for safety features, including driver monitoring systems, parking assistance, lane departure warnings, collision avoidance systems, traction control, tire pressure monitors, electronic stability control, airbags, and telematics, is growing due to the rise in road accidents globally. Additionally, it has been noted that there has been a significant rise in fatalities resulting from traffic accidents.
Teenagers have a higher incidence of fatal road traffic injuries. The growing need for safety features in automobiles is driven by these factors. Automotive manufacturers are innovating and implementing safety features to fulfill customer demands. The growth of the driver monitoring system market is driven by the high demand for safety features.
Governments globally have mandated the installation of safety systems in vehicles within specified timeframes. For example, governments mandate the installation of technologies such as drowsiness monitoring systems, lane departure systems, and driver monitoring systems in vehicles. Additionally, airbags, seat belts, child safety systems, pedestrian safety systems, and other safety features are required to be present in vehicles.
COVID-19 Impact Analysis
The driver monitoring system market has been adversely affected by the COVID-19 pandemic due to limitations on commuting, which is anticipated to have a detrimental effect on the financial performance of market participants. The economic impact has led market participants to develop strategic cost-saving plans. These factors are expected to contribute to the market's growth within the forecast timeframe. Thus, the market is expected to experience growth as restrictions ease and demand for these systems increases due to a rise in road accidents. This growth is expected to help the market recover from initial losses.
Market Growth Factor
The automotive safety systems are experiencing an increase in demand
Automotive safety systems are essential devices that aim to reduce the likelihood of injuries, prevent accidents, and lessen the effects of collisions. The systems are engineered to function automatically or require drivers to activate them per their requirements. Electric vehicle manufacturers must implement driver monitoring systems that can work with autopilot mode to ensure safety. The automotive safety systems industry is witnessing a surge in the popularity of technological advancements as a prominent trend. The automotive sector emphasizes incorporating intelligent and secure safety systems in automobiles to enhance safety across various terrains and environments.
Increase in surveillance in transportation and logistics industries
The increasing applications of driver monitoring systems have been driven by the growth of the industrial sectors, logistics, and transportation sectors. Fleet management solutions can gather, store, monitor, analyze, report, and export data through the implementation of driver monitoring systems. The driver's performance can be monitored to ensure compliance with safety regulations and legal requirements, including measures to prevent distracted driving, promote driver health, and reduce the risk of drunk driving incidents.
Market Restraining Factor
A highly complex system
The complexity of Driver Monitoring Systems is increasing due to the growing number of monitoring parameters and the need for precise driver state detection. Minimizing the occurrence of false positives and false negatives is a crucial objective in business. The primary technical challenge associated with implementing vision based DMS technology is its ability to perform consistently in varying lighting conditions, which can result in overexposed or underexposed images. The validation and development of DMS in the automotive industry pose significant challenges for stakeholders due to heightened complexity. Moreover, the Driver Monitoring System is a new concept; hence, the awareness of this system among the general public is quite limited.
Vehicle Propulsion Outlook
By vehicle propulsion, the driver monitoring systems market is classified into ICE vehicles and electric vehicles. The ICE vehicles segment witnessed the largest revenue share in the driver monitoring systems market in 2022. This is due to the fact that driver-monitoring systems can identify signs of drowsiness or lack of attention. As these systems continue to develop, they will integrate into a comprehensive interior sensing platform that offers personalized features, enhanced safety measures, entertainment options, and the ability to connect with smart home systems. The Driver Monitoring System (DMS) can recognize the driver and customize the temperature, seat, side mirror, and other settings according to their preferences.
Sales Channel Outlook
On the basis of sales channel, the driver monitoring systems market is segmented into OEM and aftermarket. The aftermarket segment acquired a prominent revenue share in the driver monitoring systems market in 2022. This is because the market for automotive-grade DMS software has grown due to the high number of trucks and buses on the roads globally. These solutions are available as plug-and-play options. The installation process is simple, and the product enables the vehicle to detect driver fatigue, lack of focus, and other factors that enhance road safety for each installation providing growth opportunities for the segment.
Component Outlook
Based on the component, the driver monitoring systems market is bifurcated into cameras, sensors and others. The sensors segment registered the highest revenue share in the driver monitoring systems market in 2022. This is due to the increased demand for DMS systems, which serve as crucial support systems for human-machine interactions (HMI) concerning active safety (ADAS) and autonomous driving. Additionally, there is a growing need for user interface improvements to create intelligent dashboards and related HMI in vehicle settings, which are becoming overwhelmed with information.
Type of Monitoring Outlook
On the basis of type of monitoring, the driver monitoring systems market is divided into driver state monitoring and driver health monitoring. The driver health monitoring segment procured a substantial revenue share in the driver monitoring systems market in 2022. This is because these systems aim to reduce the occurrence of road accidents through the use of smart glasses and user-friendly IOT devices. The IOT-based health monitoring system ensures that the driver's blood pressure, glucose, and pulse rate are constantly monitored. If any issues are detected, the system will promptly send an alert message to the appropriate hospital.
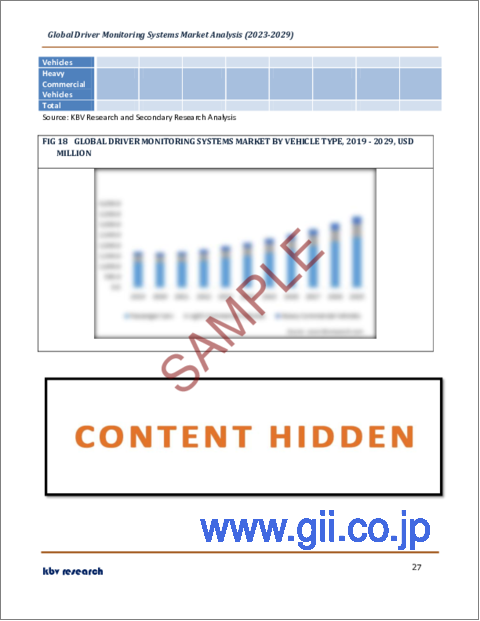
Vehicle Type Outlook
Based on vehicle type, the driver monitoring systems market is segmented into passenger cars, light commercial vehicles and heavy commercial vehicles. The passenger cars segment dominated the driver monitoring systems market with maximum revenue share in 2022. This is due to the rise in government regulations regarding driver safety, and the growing consumer demand for convenient and luxurious vehicle features has contributed to this trend. Driver monitoring systems are an essential component in passenger vehicles. The implementation of driver monitoring systems in passenger vehicles can significantly reduce the occurrence of accidents.
Regional Outlook
Region-wise, the driver monitoring systems market is analyzed across North America, Europe, Asia Pacific, and LAMEA. The Europe region generated the highest revenue share in the driver monitoring systems market in 2022. Europe has prioritized road safety and is a leader in this area. The government in the region are working to achieve zero traffic accidents in the region. As a crucial safety component, a driver Monitoring Solution has been recognized. Distracted driving accidents have been a persistent issue in Europe. Road accidents result in significant loss of life, making DMS a crucial solution for enhancing driver attentiveness. In addition, the DMS stakeholders will have the chance to work in an established market and capitalize on significant opportunities, which will surge the market growth in the region.
The major strategies followed by the market participants are Product Launches. Based on the Analysis presented in the Cardinal matrix; Intel Corporation is the forerunner in the Driver Monitoring Systems Market. Companies such as Renesas Electronics Corporation, NXP Semiconductors N.V., and ZF Friedrichshafen AG are some of the key innovators in Driver Monitoring Systems Market.
The market research report covers the analysis of key stakeholders of the market. Key companies profiled in the report include Continental AG, Denso Corporation, Robert Bosch GmbH, NXP Semiconductors N.V., Panasonic Holdings Corporation, ZF Friedrichshafen AG, Intel Corporation, Hitachi, Ltd., Valeo SA and Renesas Electronics Corporation
Recent Strategies Deployed in Driver Monitoring Systems Market
Partnerships, Collaborations and Agreements:
Sep-2022: Continental Automotive Singapore Pte Ltd, a subsidiary of Continental AG has signed an agreement with Go-Ahead and Nanyang Technological University to develop and improve the driving safety systems of Go-Ahead's buses. Go-Ahead is a provider of passenger transportation services. The purpose of the partnership is to find out the root causes of risks through increasing descriptive analytics in predictive capabilities, next level, and building diagnostics.
Sep-2022: Intel teamed up with Cipia, an Israel -based provider of in-cabin sensing solutions. The collaboration focuses on enhancing road safety at large. Intel will Integrate Cipia's driver monitoring system into its SaaS solutions.
Jun-2021: Valeo came into partnership with Navya, a France-based company operating in the automotive industry. The partnership enables Valeo to test its latest ADAS technologies and focuses on various components including ECUs, Cameras, sensors, and AI software.
May-2021: Continental Engineering Services (CES) entered into a collaboration with TriEye, an Israel-based developer of short-wave infrared imaging systems. The partnership aims at inspecting how SWIR can benefit driver monitoring systems. The integration of TriEye's SWIR sensing technology is advantageous to CES's driver monitoring and interior sensing solutions.
Acquisitions and Mergers:
Oct-2022: Renesas completed the acquisition of Steradian, a semiconductor company that provides 4D imaging radar solutions. The acquisition enables Renesas to broaden its dominance in automotive segments, by cashing in on the acquired company's radar technology and engineering talent.
Mar-2022: Bosch took over Atlatec, a 3D map manufacturing company that helps in automated driving. The acquisition will increase Bosch's proficiency in digital maps and make the company a full-service provider for automated driving.
Product Launches and Expansions:
Jan-2023: NXP Semiconductors released advanced automotive SAF85xx one-chip family for autonomous driving and ADAS. The new family of radars features combined multi-core radar processors and radar transceivers. The one-chip family facilitates 4D sensing for front and corner radars which are used in ADAS applications.
Jun-2022: NXP Semiconductors N.V. launched S32Z and S32E processor families. The S32Z is useful for zonal control and safety processing. The S32E is useful for smart actuation and electric vehicle control.
Oct-2021: NXP unveiled Real-Time Drivers (RTD) software for its S32 processor series. The software features a High-level interface for AUTOSAR and a low-level interface for non-AUTOSAR, ISO 26262 safety compliance up to ASIL D AUTOSAR 4.4 including multi-core and security support Comprehensive IP coverage via AUTOSAR standard and complex device drivers Configurable using NXP's S32 Configuration Tool or AUTOSAR partner toolchains.
Jul-2021: Renesas has launched a new series of R-car SoCs. The range of new SoCs includes six new chips. The new series of chips comes with the following features: Increased CPU performance, BOM cost reduction, Shortened and development duration.
Mar-2021: Renesas introduced R-car V3H. The new updates are intended for systems built on R-Car V3H system-on-chip (SoC). Key features include programmable output voltage, dynamic voltage frequency scaling, and built-in support for R-Car V3H SoC.
Business Expansions:
Jan-2022: ZF expanded its business by launching Commercial Vehicle Solutions (CVS) division. The new division will focus on providing solutions for digitized transport. The new division will aid ZF in its growth strategy, and perfectly align with the company's Next Generation Mobility corporate strategy.
Scope of the Study
Market Segments covered in the Report:
By Vehicle Propulsion
- ICE Vehicles
- Electric Vehicles
By Sales Channel
- OEM
- Aftermarket
By Component
- Sensors
- Cameras
- Others
By Type of Monitoring
- Driver State Monitoring
- Driver Health Monitoring
By Vehicle Type
- Passenger Cars
- Light Commercial Vehicles
- Heavy Commercial Vehicles
By Geography
- North America
- US
- Canada
- Mexico
- Rest of North America
- Europe
- Germany
- UK
- France
- Russia
- Spain
- Italy
- Rest of Europe
- Asia Pacific
- China
- Japan
- India
- South Korea
- Singapore
- Malaysia
- Rest of Asia Pacific
- LAMEA
- Brazil
- Argentina
- UAE
- Saudi Arabia
- South Africa
- Nigeria
- Rest of LAMEA
Companies Profiled
- Continental AG
- Denso Corporation
- Robert Bosch GmbH
- NXP Semiconductors N.V.
- Panasonic Holdings Corporation
- ZF Friedrichshafen AG
- Intel Corporation
- Hitachi, Ltd.
- Valeo SA
- Renesas Electronics Corporation
Unique Offerings from KBV Research
- Exhaustive coverage
- Highest number of market tables and figures
- Subscription based model available
- Guaranteed best price
- Assured post sales research support with 10% customization free
Table of Contents
Chapter 1. Market Scope & Methodology
- 1.1 Market Definition
- 1.2 Objectives
- 1.3 Market Scope
- 1.4 Segmentation
- 1.4.1 Global Driver Monitoring Systems Market, by Vehicle Propulsion
- 1.4.2 Global Driver Monitoring Systems Market, by Sales Channel
- 1.4.3 Global Driver Monitoring Systems Market, by Component
- 1.4.4 Global Driver Monitoring Systems Market, by Type of Monitoring
- 1.4.5 Global Driver Monitoring Systems Market, by Vehicle Type
- 1.4.6 Global Driver Monitoring Systems Market, by Geography
- 1.5 Methodology for the research
Chapter 2. Market Overview
- 2.1 Introduction
- 2.1.1 Overview
- 2.1.1.1 Market composition & scenario
- 2.1.1 Overview
- 2.2 Key Factors Impacting the Market
- 2.2.1 Market Drivers
- 2.2.2 Market Restraints
Chapter 3. Competition Analysis - Global
- 3.1 KBV Cardinal Matrix
- 3.2 Recent Industry Wide Strategic Developments
- 3.2.1 Partnerships, Collaborations and Agreements
- 3.2.2 Product Launches and Product Expansions
- 3.2.3 Acquisition and Mergers
- 3.2.4 Geographical Expansions
- 3.2.5 Business Expansions
- 3.3 Top Winning Strategies
- 3.3.1 Key Leading Strategies: Percentage Distribution (2019-2023)
Chapter 4. Global Driver Monitoring Systems Market by Vehicle Propulsion
- 4.1 Global ICE Vehicles Market by Region
- 4.2 Global Electric Vehicles Market by Region
Chapter 5. Global Driver Monitoring Systems Market by Sales Channel
- 5.1 Global OEM Market by Region
- 5.2 Global Aftermarket Market by Region
Chapter 6. Global Driver Monitoring Systems Market by Component
- 6.1 Global Sensors Market by Region
- 6.2 Global Cameras Market by Region
- 6.3 Global Others Market by Region
Chapter 7. Global Driver Monitoring Systems Market by Type of Monitoring
- 7.1 Global Driver State Monitoring Market by Region
- 7.2 Global Driver Health Monitoring Market by Region
Chapter 8. Global Driver Monitoring Systems Market by Vehicle Type
- 8.1 Global Passenger Cars Market by Region
- 8.2 Global Light Commercial Vehicles Market by Region
- 8.3 Global Heavy Commercial Vehicles Market by Region
Chapter 9. Global Driver Monitoring Systems Market by Region
- 9.1 North America Driver Monitoring Systems Market
- 9.1.1 North America Driver Monitoring Systems Market by Vehicle Propulsion
- 9.1.1.1 North America ICE Vehicles Market by Country
- 9.1.1.2 North America Electric Vehicles Market by Country
- 9.1.2 North America Driver Monitoring Systems Market by Sales Channel
- 9.1.2.1 North America OEM Market by Country
- 9.1.2.2 North America Aftermarket Market by Country
- 9.1.3 North America Driver Monitoring Systems Market by Component
- 9.1.3.1 North America Sensors Market by Country
- 9.1.3.2 North America Cameras Market by Country
- 9.1.3.3 North America Others Market by Country
- 9.1.4 North America Driver Monitoring Systems Market by Type of Monitoring
- 9.1.4.1 North America Driver State Monitoring Market by Country
- 9.1.4.2 North America Driver Health Monitoring Market by Country
- 9.1.5 North America Driver Monitoring Systems Market by Vehicle Type
- 9.1.5.1 North America Passenger Cars Market by Country
- 9.1.5.2 North America Light Commercial Vehicles Market by Country
- 9.1.5.3 North America Heavy Commercial Vehicles Market by Country
- 9.1.6 North America Driver Monitoring Systems Market by Country
- 9.1.6.1 US Driver Monitoring Systems Market
- 9.1.6.1.1 US Driver Monitoring Systems Market by Vehicle Propulsion
- 9.1.6.1.2 US Driver Monitoring Systems Market by Sales Channel
- 9.1.6.1.3 US Driver Monitoring Systems Market by Component
- 9.1.6.1.4 US Driver Monitoring Systems Market by Type of Monitoring
- 9.1.6.1.5 US Driver Monitoring Systems Market by Vehicle Type
- 9.1.6.2 Canada Driver Monitoring Systems Market
- 9.1.6.2.1 Canada Driver Monitoring Systems Market by Vehicle Propulsion
- 9.1.6.2.2 Canada Driver Monitoring Systems Market by Sales Channel
- 9.1.6.2.3 Canada Driver Monitoring Systems Market by Component
- 9.1.6.2.4 Canada Driver Monitoring Systems Market by Type of Monitoring
- 9.1.6.2.5 Canada Driver Monitoring Systems Market by Vehicle Type
- 9.1.6.3 Mexico Driver Monitoring Systems Market
- 9.1.6.3.1 Mexico Driver Monitoring Systems Market by Vehicle Propulsion
- 9.1.6.3.2 Mexico Driver Monitoring Systems Market by Sales Channel
- 9.1.6.3.3 Mexico Driver Monitoring Systems Market by Component
- 9.1.6.3.4 Mexico Driver Monitoring Systems Market by Type of Monitoring
- 9.1.6.3.5 Mexico Driver Monitoring Systems Market by Vehicle Type
- 9.1.6.4 Rest of North America Driver Monitoring Systems Market
- 9.1.6.4.1 Rest of North America Driver Monitoring Systems Market by Vehicle Propulsion
- 9.1.6.4.2 Rest of North America Driver Monitoring Systems Market by Sales Channel
- 9.1.6.4.3 Rest of North America Driver Monitoring Systems Market by Component
- 9.1.6.4.4 Rest of North America Driver Monitoring Systems Market by Type of Monitoring
- 9.1.6.4.5 Rest of North America Driver Monitoring Systems Market by Vehicle Type
- 9.1.6.1 US Driver Monitoring Systems Market
- 9.1.1 North America Driver Monitoring Systems Market by Vehicle Propulsion
- 9.2 Europe Driver Monitoring Systems Market
- 9.2.1 Europe Driver Monitoring Systems Market by Vehicle Propulsion
- 9.2.1.1 Europe ICE Vehicles Market by Country
- 9.2.1.2 Europe Electric Vehicles Market by Country
- 9.2.2 Europe Driver Monitoring Systems Market by Sales Channel
- 9.2.2.1 Europe OEM Market by Country
- 9.2.2.2 Europe Aftermarket Market by Country
- 9.2.3 Europe Driver Monitoring Systems Market by Component
- 9.2.3.1 Europe Sensors Market by Country
- 9.2.3.2 Europe Cameras Market by Country
- 9.2.3.3 Europe Others Market by Country
- 9.2.4 Europe Driver Monitoring Systems Market by Type of Monitoring
- 9.2.4.1 Europe Driver State Monitoring Market by Country
- 9.2.4.2 Europe Driver Health Monitoring Market by Country
- 9.2.5 Europe Driver Monitoring Systems Market by Vehicle Type
- 9.2.5.1 Europe Passenger Cars Market by Country
- 9.2.5.2 Europe Light Commercial Vehicles Market by Country
- 9.2.5.3 Europe Heavy Commercial Vehicles Market by Country
- 9.2.6 Europe Driver Monitoring Systems Market by Country
- 9.2.6.1 Germany Driver Monitoring Systems Market
- 9.2.6.1.1 Germany Driver Monitoring Systems Market by Vehicle Propulsion
- 9.2.6.1.2 Germany Driver Monitoring Systems Market by Sales Channel
- 9.2.6.1.3 Germany Driver Monitoring Systems Market by Component
- 9.2.6.1.4 Germany Driver Monitoring Systems Market by Type of Monitoring
- 9.2.6.1.5 Germany Driver Monitoring Systems Market by Vehicle Type
- 9.2.6.2 UK Driver Monitoring Systems Market
- 9.2.6.2.1 UK Driver Monitoring Systems Market by Vehicle Propulsion
- 9.2.6.2.2 UK Driver Monitoring Systems Market by Sales Channel
- 9.2.6.2.3 UK Driver Monitoring Systems Market by Component
- 9.2.6.2.4 UK Driver Monitoring Systems Market by Type of Monitoring
- 9.2.6.2.5 UK Driver Monitoring Systems Market by Vehicle Type
- 9.2.6.3 France Driver Monitoring Systems Market
- 9.2.6.3.1 France Driver Monitoring Systems Market by Vehicle Propulsion
- 9.2.6.3.2 France Driver Monitoring Systems Market by Sales Channel
- 9.2.6.3.3 France Driver Monitoring Systems Market by Component
- 9.2.6.3.4 France Driver Monitoring Systems Market by Type of Monitoring
- 9.2.6.3.5 France Driver Monitoring Systems Market by Vehicle Type
- 9.2.6.4 Russia Driver Monitoring Systems Market
- 9.2.6.4.1 Russia Driver Monitoring Systems Market by Vehicle Propulsion
- 9.2.6.4.2 Russia Driver Monitoring Systems Market by Sales Channel
- 9.2.6.4.3 Russia Driver Monitoring Systems Market by Component
- 9.2.6.4.4 Russia Driver Monitoring Systems Market by Type of Monitoring
- 9.2.6.4.5 Russia Driver Monitoring Systems Market by Vehicle Type
- 9.2.6.5 Spain Driver Monitoring Systems Market
- 9.2.6.5.1 Spain Driver Monitoring Systems Market by Vehicle Propulsion
- 9.2.6.5.2 Spain Driver Monitoring Systems Market by Sales Channel
- 9.2.6.5.3 Spain Driver Monitoring Systems Market by Component
- 9.2.6.5.4 Spain Driver Monitoring Systems Market by Type of Monitoring
- 9.2.6.5.5 Spain Driver Monitoring Systems Market by Vehicle Type
- 9.2.6.6 Italy Driver Monitoring Systems Market
- 9.2.6.6.1 Italy Driver Monitoring Systems Market by Vehicle Propulsion
- 9.2.6.6.2 Italy Driver Monitoring Systems Market by Sales Channel
- 9.2.6.6.3 Italy Driver Monitoring Systems Market by Component
- 9.2.6.6.4 Italy Driver Monitoring Systems Market by Type of Monitoring
- 9.2.6.6.5 Italy Driver Monitoring Systems Market by Vehicle Type
- 9.2.6.7 Rest of Europe Driver Monitoring Systems Market
- 9.2.6.7.1 Rest of Europe Driver Monitoring Systems Market by Vehicle Propulsion
- 9.2.6.7.2 Rest of Europe Driver Monitoring Systems Market by Sales Channel
- 9.2.6.7.3 Rest of Europe Driver Monitoring Systems Market by Component
- 9.2.6.7.4 Rest of Europe Driver Monitoring Systems Market by Type of Monitoring
- 9.2.6.7.5 Rest of Europe Driver Monitoring Systems Market by Vehicle Type
- 9.2.6.1 Germany Driver Monitoring Systems Market
- 9.2.1 Europe Driver Monitoring Systems Market by Vehicle Propulsion
- 9.3 Asia Pacific Driver Monitoring Systems Market
- 9.3.1 Asia Pacific Driver Monitoring Systems Market by Vehicle Propulsion
- 9.3.1.1 Asia Pacific ICE Vehicles Market by Country
- 9.3.1.2 Asia Pacific Electric Vehicles Market by Country
- 9.3.2 Asia Pacific Driver Monitoring Systems Market by Sales Channel
- 9.3.2.1 Asia Pacific OEM Market by Country
- 9.3.2.2 Asia Pacific Aftermarket Market by Country
- 9.3.3 Asia Pacific Driver Monitoring Systems Market by Component
- 9.3.3.1 Asia Pacific Sensors Market by Country
- 9.3.3.2 Asia Pacific Cameras Market by Country
- 9.3.3.3 Asia Pacific Others Market by Country
- 9.3.4 Asia Pacific Driver Monitoring Systems Market by Type of Monitoring
- 9.3.4.1 Asia Pacific Driver State Monitoring Market by Country
- 9.3.4.2 Asia Pacific Driver Health Monitoring Market by Country
- 9.3.5 Asia Pacific Driver Monitoring Systems Market by Vehicle Type
- 9.3.5.1 Asia Pacific Passenger Cars Market by Country
- 9.3.5.2 Asia Pacific Light Commercial Vehicles Market by Country
- 9.3.5.3 Asia Pacific Heavy Commercial Vehicles Market by Country
- 9.3.6 Asia Pacific Driver Monitoring Systems Market by Country
- 9.3.6.1 China Driver Monitoring Systems Market
- 9.3.6.1.1 China Driver Monitoring Systems Market by Vehicle Propulsion
- 9.3.6.1.2 China Driver Monitoring Systems Market by Sales Channel
- 9.3.6.1.3 China Driver Monitoring Systems Market by Component
- 9.3.6.1.4 China Driver Monitoring Systems Market by Type of Monitoring
- 9.3.6.1.5 China Driver Monitoring Systems Market by Vehicle Type
- 9.3.6.2 Japan Driver Monitoring Systems Market
- 9.3.6.2.1 Japan Driver Monitoring Systems Market by Vehicle Propulsion
- 9.3.6.2.2 Japan Driver Monitoring Systems Market by Sales Channel
- 9.3.6.2.3 Japan Driver Monitoring Systems Market by Component
- 9.3.6.2.4 Japan Driver Monitoring Systems Market by Type of Monitoring
- 9.3.6.2.5 Japan Driver Monitoring Systems Market by Vehicle Type
- 9.3.6.3 India Driver Monitoring Systems Market
- 9.3.6.3.1 India Driver Monitoring Systems Market by Vehicle Propulsion
- 9.3.6.3.2 India Driver Monitoring Systems Market by Sales Channel
- 9.3.6.3.3 India Driver Monitoring Systems Market by Component
- 9.3.6.3.4 India Driver Monitoring Systems Market by Type of Monitoring
- 9.3.6.3.5 India Driver Monitoring Systems Market by Vehicle Type
- 9.3.6.4 South Korea Driver Monitoring Systems Market
- 9.3.6.4.1 South Korea Driver Monitoring Systems Market by Vehicle Propulsion
- 9.3.6.4.2 South Korea Driver Monitoring Systems Market by Sales Channel
- 9.3.6.4.3 South Korea Driver Monitoring Systems Market by Component
- 9.3.6.4.4 South Korea Driver Monitoring Systems Market by Type of Monitoring
- 9.3.6.4.5 South Korea Driver Monitoring Systems Market by Vehicle Type
- 9.3.6.5 Singapore Driver Monitoring Systems Market
- 9.3.6.5.1 Singapore Driver Monitoring Systems Market by Vehicle Propulsion
- 9.3.6.5.2 Singapore Driver Monitoring Systems Market by Sales Channel
- 9.3.6.5.3 Singapore Driver Monitoring Systems Market by Component
- 9.3.6.5.4 Singapore Driver Monitoring Systems Market by Type of Monitoring
- 9.3.6.5.5 Singapore Driver Monitoring Systems Market by Vehicle Type
- 9.3.6.6 Malaysia Driver Monitoring Systems Market
- 9.3.6.6.1 Malaysia Driver Monitoring Systems Market by Vehicle Propulsion
- 9.3.6.6.2 Malaysia Driver Monitoring Systems Market by Sales Channel
- 9.3.6.6.3 Malaysia Driver Monitoring Systems Market by Component
- 9.3.6.6.4 Malaysia Driver Monitoring Systems Market by Type of Monitoring
- 9.3.6.6.5 Malaysia Driver Monitoring Systems Market by Vehicle Type
- 9.3.6.7 Rest of Asia Pacific Driver Monitoring Systems Market
- 9.3.6.7.1 Rest of Asia Pacific Driver Monitoring Systems Market by Vehicle Propulsion
- 9.3.6.7.2 Rest of Asia Pacific Driver Monitoring Systems Market by Sales Channel
- 9.3.6.7.3 Rest of Asia Pacific Driver Monitoring Systems Market by Component
- 9.3.6.7.4 Rest of Asia Pacific Driver Monitoring Systems Market by Type of Monitoring
- 9.3.6.7.5 Rest of Asia Pacific Driver Monitoring Systems Market by Vehicle Type
- 9.3.6.1 China Driver Monitoring Systems Market
- 9.3.1 Asia Pacific Driver Monitoring Systems Market by Vehicle Propulsion
- 9.4 LAMEA Driver Monitoring Systems Market
- 9.4.1 LAMEA Driver Monitoring Systems Market by Vehicle Propulsion
- 9.4.1.1 LAMEA ICE Vehicles Market by Country
- 9.4.1.2 LAMEA Electric Vehicles Market by Country
- 9.4.2 LAMEA Driver Monitoring Systems Market by Sales Channel
- 9.4.2.1 LAMEA OEM Market by Country
- 9.4.2.2 LAMEA Aftermarket Market by Country
- 9.4.3 LAMEA Driver Monitoring Systems Market by Component
- 9.4.3.1 LAMEA Sensors Market by Country
- 9.4.3.2 LAMEA Cameras Market by Country
- 9.4.3.3 LAMEA Others Market by Country
- 9.4.4 LAMEA Driver Monitoring Systems Market by Type of Monitoring
- 9.4.4.1 LAMEA Driver State Monitoring Market by Country
- 9.4.4.2 LAMEA Driver Health Monitoring Market by Country
- 9.4.5 LAMEA Driver Monitoring Systems Market by Vehicle Type
- 9.4.5.1 LAMEA Passenger Cars Market by Country
- 9.4.5.2 LAMEA Light Commercial Vehicles Market by Country
- 9.4.5.3 LAMEA Heavy Commercial Vehicles Market by Country
- 9.4.6 LAMEA Driver Monitoring Systems Market by Country
- 9.4.6.1 Brazil Driver Monitoring Systems Market
- 9.4.6.1.1 Brazil Driver Monitoring Systems Market by Vehicle Propulsion
- 9.4.6.1.2 Brazil Driver Monitoring Systems Market by Sales Channel
- 9.4.6.1.3 Brazil Driver Monitoring Systems Market by Component
- 9.4.6.1.4 Brazil Driver Monitoring Systems Market by Type of Monitoring
- 9.4.6.1.5 Brazil Driver Monitoring Systems Market by Vehicle Type
- 9.4.6.2 Argentina Driver Monitoring Systems Market
- 9.4.6.2.1 Argentina Driver Monitoring Systems Market by Vehicle Propulsion
- 9.4.6.2.2 Argentina Driver Monitoring Systems Market by Sales Channel
- 9.4.6.2.3 Argentina Driver Monitoring Systems Market by Component
- 9.4.6.2.4 Argentina Driver Monitoring Systems Market by Type of Monitoring
- 9.4.6.2.5 Argentina Driver Monitoring Systems Market by Vehicle Type
- 9.4.6.3 UAE Driver Monitoring Systems Market
- 9.4.6.3.1 UAE Driver Monitoring Systems Market by Vehicle Propulsion
- 9.4.6.3.2 UAE Driver Monitoring Systems Market by Sales Channel
- 9.4.6.3.3 UAE Driver Monitoring Systems Market by Component
- 9.4.6.3.4 UAE Driver Monitoring Systems Market by Type of Monitoring
- 9.4.6.3.5 UAE Driver Monitoring Systems Market by Vehicle Type
- 9.4.6.4 Saudi Arabia Driver Monitoring Systems Market
- 9.4.6.4.1 Saudi Arabia Driver Monitoring Systems Market by Vehicle Propulsion
- 9.4.6.4.2 Saudi Arabia Driver Monitoring Systems Market by Sales Channel
- 9.4.6.4.3 Saudi Arabia Driver Monitoring Systems Market by Component
- 9.4.6.4.4 Saudi Arabia Driver Monitoring Systems Market by Type of Monitoring
- 9.4.6.4.5 Saudi Arabia Driver Monitoring Systems Market by Vehicle Type
- 9.4.6.5 South Africa Driver Monitoring Systems Market
- 9.4.6.5.1 South Africa Driver Monitoring Systems Market by Vehicle Propulsion
- 9.4.6.5.2 South Africa Driver Monitoring Systems Market by Sales Channel
- 9.4.6.5.3 South Africa Driver Monitoring Systems Market by Component
- 9.4.6.5.4 South Africa Driver Monitoring Systems Market by Type of Monitoring
- 9.4.6.5.5 South Africa Driver Monitoring Systems Market by Vehicle Type
- 9.4.6.6 Nigeria Driver Monitoring Systems Market
- 9.4.6.6.1 Nigeria Driver Monitoring Systems Market by Vehicle Propulsion
- 9.4.6.6.2 Nigeria Driver Monitoring Systems Market by Sales Channel
- 9.4.6.6.3 Nigeria Driver Monitoring Systems Market by Component
- 9.4.6.6.4 Nigeria Driver Monitoring Systems Market by Type of Monitoring
- 9.4.6.6.5 Nigeria Driver Monitoring Systems Market by Vehicle Type
- 9.4.6.7 Rest of LAMEA Driver Monitoring Systems Market
- 9.4.6.7.1 Rest of LAMEA Driver Monitoring Systems Market by Vehicle Propulsion
- 9.4.6.7.2 Rest of LAMEA Driver Monitoring Systems Market by Sales Channel
- 9.4.6.7.3 Rest of LAMEA Driver Monitoring Systems Market by Component
- 9.4.6.7.4 Rest of LAMEA Driver Monitoring Systems Market by Type of Monitoring
- 9.4.6.7.5 Rest of LAMEA Driver Monitoring Systems Market by Vehicle Type
- 9.4.6.1 Brazil Driver Monitoring Systems Market
- 9.4.1 LAMEA Driver Monitoring Systems Market by Vehicle Propulsion
Chapter 10. Company Profiles
- 10.1 Continental AG
- 10.1.1 Company Overview
- 10.1.2 Financial Analysis
- 10.1.3 Segmental and Regional Analysis
- 10.1.4 Research & Development Expense
- 10.1.5 Recent strategies and developments:
- 10.1.5.1 Partnerships, Collaborations, and Agreements:
- 10.1.5.2 Geographical Expansions:
- 10.1.6 SWOT Analysis
- 10.2 NXP Semiconductors N.V.
- 10.2.1 Company Overview
- 10.2.2 Financial Analysis
- 10.2.3 Regional Analysis
- 10.2.4 Research & Development Expense
- 10.2.5 Recent strategies and developments:
- 10.2.5.1 Product Launches and Product Expansions:
- 10.2.6 SWOT Analysis
- 10.3 Intel Corporation
- 10.3.1 Company Overview
- 10.3.2 Financial Analysis
- 10.3.3 Segmental and Regional Analysis
- 10.3.4 Research & Development Expenses
- 10.3.5 Recent strategies and developments:
- 10.3.5.1 Partnerships, Collaborations, and Agreements:
- 10.3.6 SWOT Analysis
- 10.4 Robert Bosch GmbH
- 10.4.1 Company Overview
- 10.4.2 Financial Analysis
- 10.4.3 Segmental and Regional Analysis
- 10.4.4 Research & Development Expense
- 10.4.5 Recent strategies and developments:
- 10.4.5.1 Acquisition and Mergers:
- 10.4.6 SWOT Analysis
- 10.5 Panasonic Holdings Corporation
- 10.5.1 Company Overview
- 10.5.2 Financial Analysis
- 10.5.3 Segmental and Regional Analysis
- 10.5.4 Research & Development Expense
- 10.5.5 SWOT Analysis
- 10.6 Hitachi, Ltd.
- 10.6.1 Company Overview
- 10.6.2 Financial Analysis
- 10.6.3 Segmental and Regional Analysis
- 10.6.4 Research & Development Expenses
- 10.6.5 SWOT Analysis
- 10.7 Renesas Electronics Corporation
- 10.7.1 Company Overview
- 10.7.2 Financial Analysis
- 10.7.3 Segmental and Regional Analysis
- 10.7.4 Research & Development Expense
- 10.7.5 Recent strategies and developments:
- 10.7.5.1 Product Launches and Product Expansions:
- 10.7.5.2 Acquisition and Mergers:
- 10.8 ZF Friedrichshafen AG
- 10.8.1 Company Overview
- 10.8.2 Financial Analysis
- 10.8.3 Regional Analysis
- 10.8.4 Research & Development Expenses
- 10.8.5 Recent strategies and developments:
- 10.8.5.1 Product Launches and Product Expansions:
- 10.8.5.2 Acquisition and Mergers:
- 10.8.5.3 Geographical Expansions:
- 10.9 Denso Corporation
- 10.9.1 Company Overview
- 10.9.2 Financial Analysis
- 10.9.3 Regional Analysis
- 10.9.4 Research & Development Expense
- 10.9.5 Recent strategies and developments:
- 10.9.5.1 Partnerships, Collaborations, and Agreements:
- 10.10. Valeo SA
- 10.10.1 Company Overview
- 10.10.2 Financial Analysis
- 10.10.3 Segmental and Regional Analysis
- 10.10.4 Research & Development Expense
- 10.10.5 Recent strategies and developments:
- 10.10.5.1 Partnerships, Collaborations, and Agreements: