|
|
市場調査レポート
商品コード
1653012
石炭鉱業の世界市場、2025-2029年Global Coal Mining Market 2025-2029 |
||||||

|
|||||||
カスタマイズ可能
|
|||||||

| 石炭鉱業の世界市場、2025-2029年 |
|
出版日: 2025年01月30日
発行: TechNavio
ページ情報: 英文 204 Pages
納期: 即納可能
|

全表示
- 概要
- 目次
石炭鉱業市場は2024-2029年に863億米ドル、予測期間中のCAGRは2.6%で成長すると予測されます。
当レポートでは、石炭鉱業市場の全体的な分析、市場規模・予測、動向、成長促進要因、課題、約25のベンダーを網羅したベンダー分析などを掲載しています。
現在の市場シナリオ、最新動向と促進要因、市場環境全体に関する最新分析を提供しています。市場は、より優れた発電技術、石炭部門における鉱山計画ソフトウェアの使用、鉱業の成長を促進するロボット工学と無人運転技術によって牽引されています。
| 市場範囲 | |
|---|---|
| 基準年 | 2025 |
| 終了年 | 2029 |
| 予測期間 | 2025-2029 |
| 成長モメンタム | 加速 |
| 前年比2025年 | 2.5% |
| CAGR | 2.6% |
| 増分額 | 863億米ドル |
本調査は、業界の主要参加者からのインプットを含め、一次情報と二次情報を客観的に組み合わせて実施しました。本レポートには、主要企業の分析に加え、包括的な市場規模データ、地域分析によるセグメント、ベンダー情勢が含まれています。レポートには過去データと予測データがあります。
本調査では、今後数年間の石炭鉱業市場の成長を促進する主な理由の1つとして、燃料として、また発電用として液体状の石炭を使用することを挙げています。また、石炭燃焼による副産物を利用する利点や、石炭鉱業におけるオペレーショナルエクセレンスを達成するためのデータ駆動型知見の利用が、市場の大きな需要につながるでしょう。
目次
第1章 エグゼクティブサマリー
- 市場概要
第2章 Technavio分析
- 価格・ライフサイクル・顧客購入バスケット・採用率・購入基準の分析
- インプットの重要性と差別化の要因
- 混乱の要因
- 促進要因と課題の影響
第3章 市場情勢
- 市場エコシステム
- 市場の特徴
- バリューチェーン分析
第4章 市場規模
- 市場の定義
- 市場セグメント分析
- 市場規模 2024
- 市場の見通し 2024-2029
第5章 市場規模実績
- 石炭鉱業の世界市場 2019-2023
- 方法セグメント分析 2019-2023
- エンドユーザーセグメント分析 2019-2023
- 地域別セグメント分析 2019-2023
- 国別セグメント分析 2019-2023
第6章 定性分析
- AIの影響:石炭鉱業の世界市場
第7章 ファイブフォース分析
- ファイブフォースの要約
- 買い手の交渉力
- 供給企業の交渉力
- 新規参入業者の脅威
- 代替品の脅威
- 競争の脅威
- 市況
第8章 市場セグメンテーション:方法別
- 市場セグメント
- 比較:方法別
- 地下採掘:市場規模と予測 2024-2029
- 露天採掘:市場規模と予測 2024-2029
- 市場機会:方法別
第9章 市場セグメンテーション:エンドユーザー別
- 市場セグメント
- 比較:エンドユーザー別
- 火力発電:市場規模と予測 2024-2029
- セメント製造:市場規模と予測 2024-2029
- 鉄鋼製造:市場規模と予測 2024-2029
- その他:市場規模と予測 2024-2029
- 市場機会:エンドユーザー別
第10章 顧客情勢
- 顧客情勢の概要
第11章 地域別情勢
- 地域別セグメンテーション
- 地域別比較
- アジア太平洋:市場規模と予測 2024-2029
- 南米:市場規模と予測 2024-2029
- 北米:市場規模と予測 2024-2029
- 中東・アフリカ:市場規模と予測 2024-2029
- 欧州:市場規模と予測 2024-2029
- 中国:市場規模と予測 2024-2029
- インド:市場規模と予測 2024-2029
- インドネシア:市場規模と予測 2024-2029
- 米国:市場規模と予測 2024-2029
- オーストラリア:市場規模と予測 2024-2029
- ブラジル:市場規模と予測 2024-2029
- コロンビア:市場規模と予測 2024-2029
- カナダ:市場規模と予測 2024-2029
- アルゼンチン:市場規模と予測 2024-2029
- チリ:市場規模と予測 2024-2029
- 市場機会:地域情勢別
第12章 促進要因・課題・機会・抑制要因
- 市場促進要因
- 市場の課題
- 促進要因と課題の影響
- 市場の機会・抑制要因
第13章 競合情勢
- 概要
- 競合情勢
- 混乱の状況
- 業界のリスク
第14章 競合分析
- 企業プロファイル
- 企業ランキング指数
- 企業の市場ポジショニング
- Alpha Metallurgical Resources Inc.
- Anglo American plc
- Arch Resources Inc.
- BHP Group Ltd.
- China Shenhua Energy Co. Ltd.
- Coal India Ltd.
- Coronado Global Resources Inc.
- Glencore Plc
- Joint Stock Co. Siberian Coal Energy Co.
- NACCO Industries Inc.
- NTPC Ltd.
- Peabody Energy Corp.
- Sasol Ltd.
- Shaanxi Coal and Chemical Industry Group Co. Ltd.
- Teck Resources Ltd.
第15章 付録
The coal mining market is forecasted to grow by USD 86.3 billion during 2024-2029, accelerating at a CAGR of 2.6% during the forecast period. The report on the coal mining market provides a holistic analysis, market size and forecast, trends, growth drivers, and challenges, as well as vendor analysis covering around 25 vendors.
The report offers an up-to-date analysis regarding the current market scenario, the latest trends and drivers, and the overall market environment. The market is driven by better electricity generation technology, use of mine planning software in coal sector, and robotics and driverless technology driving growth of mining industry.
| Market Scope | |
|---|---|
| Base Year | 2025 |
| End Year | 2029 |
| Series Year | 2025-2029 |
| Growth Momentum | Accelerate |
| YOY 2025 | 2.5% |
| CAGR | 2.6% |
| Incremental Value | $86.3 bn |
The study was conducted using an objective combination of primary and secondary information including inputs from key participants in the industry. The report contains a comprehensive market size data, segment with regional analysis and vendor landscape in addition to an analysis of the key companies. Reports have historic and forecast data.
Technavio's coal mining market is segmented as below:
By Method
- Underground mining
- Surface mining
By End-user
- Thermal power generation
- Cement manufacturing
- Steel manufacturing
- Others
By Geographical Landscape
- APAC
- South America
- North America
- Middle East and Africa
- Europe
This study identifies the usage of liquid form of coal as fuel and for electricity generation as one of the prime reasons driving the coal mining market growth during the next few years. Also, advantages of using byproducts of coal combustion and using data-driven insights to achieve operational excellence in coal mining will lead to sizable demand in the market.
The report on the coal mining market covers the following areas:
- Coal Mining Market sizing
- Coal Mining Market forecast
- Coal Mining Market industry analysis
The robust vendor analysis is designed to help clients improve their market position, and in line with this, this report provides a detailed analysis of several leading coal mining market vendors that include Adani Group, Alpha Metallurgical Resources Inc., Anglo American PLC, Arch Resources Inc., BHP Group Ltd., CEF Group, CEZ a. s, China Shenhua Energy Co. Ltd., Coal India Ltd., Coronado Global Resources Inc., Glencore PLC, Joint Stock Co. Siberian Coal Energy Co., NACCO Industries Inc., NTPC Ltd., Peabody Energy Corp., PT Adaro Energy Tbk, Sasol Ltd., Shaanxi Coal and Chemical Industry Group Co. Ltd., and Teck Resources Ltd.. Also, the coal mining market analysis report includes information on upcoming trends and challenges that will influence market growth. This is to help companies strategize and leverage all forthcoming growth opportunities.
The publisher presents a detailed picture of the market by the way of study, synthesis, and summation of data from multiple sources by an analysis of key parameters such as profit, pricing, competition, and promotions. It presents various market facets by identifying the key industry influencers. The data presented is comprehensive, reliable, and a result of extensive primary and secondary research. The market research reports provide a complete competitive landscape and an in-depth vendor selection methodology and analysis using qualitative and quantitative research to forecast accurate market growth.
Table of Contents
1 Executive Summary
- 1.1 Market overview
- Executive Summary - Chart on Market Overview
- Executive Summary - Data Table on Market Overview
- Executive Summary - Chart on Global Market Characteristics
- Executive Summary - Chart on Market By Geographical Landscape
- Executive Summary - Chart on Market Segmentation by Method
- Executive Summary - Chart on Market Segmentation by End-user
- Executive Summary - Chart on Incremental Growth
- Executive Summary - Data Table on Incremental Growth
- Executive Summary - Chart on Company Market Positioning
2 Technavio Analysis
- 2.1 Analysis of price sensitivity, lifecycle, customer purchase basket, adoption rates, and purchase criteria
- Analysis of price sensitivity, lifecycle, customer purchase basket, adoption rates, and purchase criteria
- 2.2 Criticality of inputs and Factors of differentiation
- Overview on criticality of inputs and factors of differentiation
- 2.3 Factors of disruption
- Overview on factors of disruption
- 2.4 Impact of drivers and challenges
- Impact of drivers and challenges in 2024 and 2029
3 Market Landscape
- 3.1 Market ecosystem
- Parent Market
- Data Table on - Parent Market
- 3.2 Market characteristics
- Market characteristics analysis
- 3.3 Value chain analysis
- Value chain analysis
4 Market Sizing
- 4.1 Market definition
- Offerings of companies included in the market definition
- 4.2 Market segment analysis
- Market segments
- 4.3 Market size 2024
- 4.4 Market outlook: Forecast for 2024-2029
- Chart on Global - Market size and forecast 2024-2029 ($ billion)
- Data Table on Global - Market size and forecast 2024-2029 ($ billion)
- Chart on Global Market: Year-over-year growth 2024-2029 (%)
- Data Table on Global Market: Year-over-year growth 2024-2029 (%)
5 Historic Market Size
- 5.1 Global Coal Mining Market 2019 - 2023
- Historic Market Size - Data Table on Global Coal Mining Market 2019 - 2023 ($ billion)
- 5.2 Method segment analysis 2019 - 2023
- Historic Market Size - Method Segment 2019 - 2023 ($ billion)
- 5.3 End-user segment analysis 2019 - 2023
- Historic Market Size - End-user Segment 2019 - 2023 ($ billion)
- 5.4 Geography segment analysis 2019 - 2023
- Historic Market Size - Geography Segment 2019 - 2023 ($ billion)
- 5.5 Country segment analysis 2019 - 2023
- Historic Market Size - Country Segment 2019 - 2023 ($ billion)
6 Qualitative Analysis
- 6.1 Impact of AI in global coal mining market
7 Five Forces Analysis
- 7.1 Five forces summary
- Five forces analysis - Comparison between 2024 and 2029
- 7.2 Bargaining power of buyers
- Bargaining power of buyers - Impact of key factors 2024 and 2029
- 7.3 Bargaining power of suppliers
- Bargaining power of suppliers - Impact of key factors in 2024 and 2029
- 7.4 Threat of new entrants
- Threat of new entrants - Impact of key factors in 2024 and 2029
- 7.5 Threat of substitutes
- Threat of substitutes - Impact of key factors in 2024 and 2029
- 7.6 Threat of rivalry
- Threat of rivalry - Impact of key factors in 2024 and 2029
- 7.7 Market condition
- Chart on Market condition - Five forces 2024 and 2029
8 Market Segmentation by Method
- 8.1 Market segments
- Chart on Method - Market share 2024-2029 (%)
- Data Table on Method - Market share 2024-2029 (%)
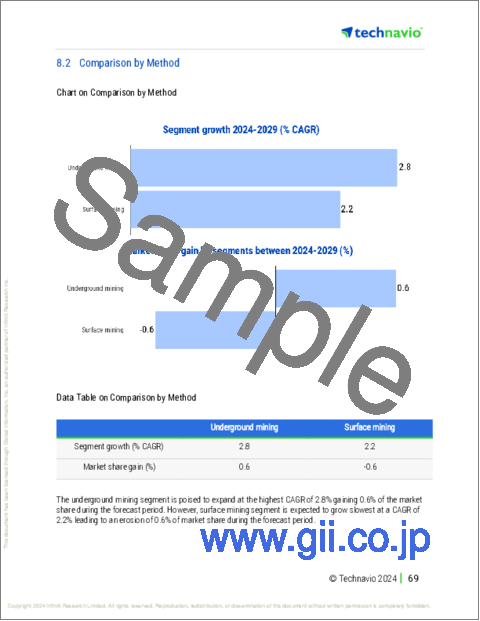
- 8.2 Comparison by Method
- Chart on Comparison by Method
- Data Table on Comparison by Method
- 8.3 Underground mining - Market size and forecast 2024-2029
- Chart on Underground mining - Market size and forecast 2024-2029 ($ billion)
- Data Table on Underground mining - Market size and forecast 2024-2029 ($ billion)
- Chart on Underground mining - Year-over-year growth 2024-2029 (%)
- Data Table on Underground mining - Year-over-year growth 2024-2029 (%)
- 8.4 Surface mining - Market size and forecast 2024-2029
- Chart on Surface mining - Market size and forecast 2024-2029 ($ billion)
- Data Table on Surface mining - Market size and forecast 2024-2029 ($ billion)
- Chart on Surface mining - Year-over-year growth 2024-2029 (%)
- Data Table on Surface mining - Year-over-year growth 2024-2029 (%)
- 8.5 Market opportunity by Method
- Market opportunity by Method ($ billion)
- Data Table on Market opportunity by Method ($ billion)
9 Market Segmentation by End-user
- 9.1 Market segments
- Chart on End-user - Market share 2024-2029 (%)
- Data Table on End-user - Market share 2024-2029 (%)
- 9.2 Comparison by End-user
- Chart on Comparison by End-user
- Data Table on Comparison by End-user
- 9.3 Thermal power generation - Market size and forecast 2024-2029
- Chart on Thermal power generation - Market size and forecast 2024-2029 ($ billion)
- Data Table on Thermal power generation - Market size and forecast 2024-2029 ($ billion)
- Chart on Thermal power generation - Year-over-year growth 2024-2029 (%)
- Data Table on Thermal power generation - Year-over-year growth 2024-2029 (%)
- 9.4 Cement manufacturing - Market size and forecast 2024-2029
- Chart on Cement manufacturing - Market size and forecast 2024-2029 ($ billion)
- Data Table on Cement manufacturing - Market size and forecast 2024-2029 ($ billion)
- Chart on Cement manufacturing - Year-over-year growth 2024-2029 (%)
- Data Table on Cement manufacturing - Year-over-year growth 2024-2029 (%)
- 9.5 Steel manufacturing - Market size and forecast 2024-2029
- Chart on Steel manufacturing - Market size and forecast 2024-2029 ($ billion)
- Data Table on Steel manufacturing - Market size and forecast 2024-2029 ($ billion)
- Chart on Steel manufacturing - Year-over-year growth 2024-2029 (%)
- Data Table on Steel manufacturing - Year-over-year growth 2024-2029 (%)
- 9.6 Others - Market size and forecast 2024-2029
- Chart on Others - Market size and forecast 2024-2029 ($ billion)
- Data Table on Others - Market size and forecast 2024-2029 ($ billion)
- Chart on Others - Year-over-year growth 2024-2029 (%)
- Data Table on Others - Year-over-year growth 2024-2029 (%)
- 9.7 Market opportunity by End-user
- Market opportunity by End-user ($ billion)
- Data Table on Market opportunity by End-user ($ billion)
10 Customer Landscape
- 10.1 Customer landscape overview
- Analysis of price sensitivity, lifecycle, customer purchase basket, adoption rates, and purchase criteria
11 Geographic Landscape
- 11.1 Geographic segmentation
- Chart on Market share By Geographical Landscape 2024-2029 (%)
- Data Table on Market share By Geographical Landscape 2024-2029 (%)
- 11.2 Geographic comparison
- Chart on Geographic comparison
- Data Table on Geographic comparison
- 11.3 APAC - Market size and forecast 2024-2029
- Chart on APAC - Market size and forecast 2024-2029 ($ billion)
- Data Table on APAC - Market size and forecast 2024-2029 ($ billion)
- Chart on APAC - Year-over-year growth 2024-2029 (%)
- Data Table on APAC - Year-over-year growth 2024-2029 (%)
- 11.4 South America - Market size and forecast 2024-2029
- Chart on South America - Market size and forecast 2024-2029 ($ billion)
- Data Table on South America - Market size and forecast 2024-2029 ($ billion)
- Chart on South America - Year-over-year growth 2024-2029 (%)
- Data Table on South America - Year-over-year growth 2024-2029 (%)
- 11.5 North America - Market size and forecast 2024-2029
- Chart on North America - Market size and forecast 2024-2029 ($ billion)
- Data Table on North America - Market size and forecast 2024-2029 ($ billion)
- Chart on North America - Year-over-year growth 2024-2029 (%)
- Data Table on North America - Year-over-year growth 2024-2029 (%)
- 11.6 Middle East and Africa - Market size and forecast 2024-2029
- Chart on Middle East and Africa - Market size and forecast 2024-2029 ($ billion)
- Data Table on Middle East and Africa - Market size and forecast 2024-2029 ($ billion)
- Chart on Middle East and Africa - Year-over-year growth 2024-2029 (%)
- Data Table on Middle East and Africa - Year-over-year growth 2024-2029 (%)
- 11.7 Europe - Market size and forecast 2024-2029
- Chart on Europe - Market size and forecast 2024-2029 ($ billion)
- Data Table on Europe - Market size and forecast 2024-2029 ($ billion)
- Chart on Europe - Year-over-year growth 2024-2029 (%)
- Data Table on Europe - Year-over-year growth 2024-2029 (%)
- 11.8 China - Market size and forecast 2024-2029
- Chart on China - Market size and forecast 2024-2029 ($ billion)
- Data Table on China - Market size and forecast 2024-2029 ($ billion)
- Chart on China - Year-over-year growth 2024-2029 (%)
- Data Table on China - Year-over-year growth 2024-2029 (%)
- 11.9 India - Market size and forecast 2024-2029
- Chart on India - Market size and forecast 2024-2029 ($ billion)
- Data Table on India - Market size and forecast 2024-2029 ($ billion)
- Chart on India - Year-over-year growth 2024-2029 (%)
- Data Table on India - Year-over-year growth 2024-2029 (%)
- 11.10 Indonesia - Market size and forecast 2024-2029
- Chart on Indonesia - Market size and forecast 2024-2029 ($ billion)
- Data Table on Indonesia - Market size and forecast 2024-2029 ($ billion)
- Chart on Indonesia - Year-over-year growth 2024-2029 (%)
- Data Table on Indonesia - Year-over-year growth 2024-2029 (%)
- 11.11 US - Market size and forecast 2024-2029
- Chart on US - Market size and forecast 2024-2029 ($ billion)
- Data Table on US - Market size and forecast 2024-2029 ($ billion)
- Chart on US - Year-over-year growth 2024-2029 (%)
- Data Table on US - Year-over-year growth 2024-2029 (%)
- 11.12 Australia - Market size and forecast 2024-2029
- Chart on Australia - Market size and forecast 2024-2029 ($ billion)
- Data Table on Australia - Market size and forecast 2024-2029 ($ billion)
- Chart on Australia - Year-over-year growth 2024-2029 (%)
- Data Table on Australia - Year-over-year growth 2024-2029 (%)
- 11.13 Brazil - Market size and forecast 2024-2029
- Chart on Brazil - Market size and forecast 2024-2029 ($ billion)
- Data Table on Brazil - Market size and forecast 2024-2029 ($ billion)
- Chart on Brazil - Year-over-year growth 2024-2029 (%)
- Data Table on Brazil - Year-over-year growth 2024-2029 (%)
- 11.14 Colombia - Market size and forecast 2024-2029
- Chart on Colombia - Market size and forecast 2024-2029 ($ billion)
- Data Table on Colombia - Market size and forecast 2024-2029 ($ billion)
- Chart on Colombia - Year-over-year growth 2024-2029 (%)
- Data Table on Colombia - Year-over-year growth 2024-2029 (%)
- 11.15 Canada - Market size and forecast 2024-2029
- Chart on Canada - Market size and forecast 2024-2029 ($ billion)
- Data Table on Canada - Market size and forecast 2024-2029 ($ billion)
- Chart on Canada - Year-over-year growth 2024-2029 (%)
- Data Table on Canada - Year-over-year growth 2024-2029 (%)
- 11.16 Argentina - Market size and forecast 2024-2029
- Chart on Argentina - Market size and forecast 2024-2029 ($ billion)
- Data Table on Argentina - Market size and forecast 2024-2029 ($ billion)
- Chart on Argentina - Year-over-year growth 2024-2029 (%)
- Data Table on Argentina - Year-over-year growth 2024-2029 (%)
- 11.17 Chile - Market size and forecast 2024-2029
- Chart on Chile - Market size and forecast 2024-2029 ($ billion)
- Data Table on Chile - Market size and forecast 2024-2029 ($ billion)
- Chart on Chile - Year-over-year growth 2024-2029 (%)
- Data Table on Chile - Year-over-year growth 2024-2029 (%)
- 11.18 Market opportunity By Geographical Landscape
- Market opportunity By Geographical Landscape ($ billion)
- Data Tables on Market opportunity By Geographical Landscape ($ billion)
12 Drivers, Challenges, and Opportunity/Restraints
- 12.1 Market drivers
- 12.2 Market challenges
- 12.3 Impact of drivers and challenges
- Impact of drivers and challenges in 2024 and 2029
- 12.4 Market opportunities/restraints
13 Competitive Landscape
- 13.1 Overview
- 13.2 Competitive Landscape
- Overview on criticality of inputs and factors of differentiation
- 13.3 Landscape disruption
- Overview on factors of disruption
- 13.4 Industry risks
- Impact of key risks on business
14 Competitive Analysis
- 14.1 Companies profiled
- Companies covered
- 14.2 Company ranking index
- Company ranking index
- 14.3 Market positioning of companies
- Matrix on companies position and classification
- 14.4 Alpha Metallurgical Resources Inc.
- Alpha Metallurgical Resources Inc. - Overview
- Alpha Metallurgical Resources Inc. - Product / Service
- Alpha Metallurgical Resources Inc. - Key offerings
- SWOT
- 14.5 Anglo American plc
- Anglo American plc - Overview
- Anglo American plc - Business segments
- Anglo American plc - Key news
- Anglo American plc - Key offerings
- Anglo American plc - Segment focus
- SWOT
- 14.6 Arch Resources Inc.
- Arch Resources Inc. - Overview
- Arch Resources Inc. - Product / Service
- Arch Resources Inc. - Key offerings
- SWOT
- 14.7 BHP Group Ltd.
- BHP Group Ltd. - Overview
- BHP Group Ltd. - Business segments
- BHP Group Ltd. - Key offerings
- BHP Group Ltd. - Segment focus
- SWOT
- 14.8 China Shenhua Energy Co. Ltd.
- China Shenhua Energy Co. Ltd. - Overview
- China Shenhua Energy Co. Ltd. - Business segments
- China Shenhua Energy Co. Ltd. - Key offerings
- China Shenhua Energy Co. Ltd. - Segment focus
- SWOT
- 14.9 Coal India Ltd.
- Coal India Ltd. - Overview
- Coal India Ltd. - Product / Service
- Coal India Ltd. - Key offerings
- SWOT
- 14.10 Coronado Global Resources Inc.
- Coronado Global Resources Inc. - Overview
- Coronado Global Resources Inc. - Business segments
- Coronado Global Resources Inc. - Key offerings
- Coronado Global Resources Inc. - Segment focus
- SWOT
- 14.11 Glencore Plc
- Glencore Plc - Overview
- Glencore Plc - Business segments
- Glencore Plc - Key news
- Glencore Plc - Key offerings
- Glencore Plc - Segment focus
- SWOT
- 14.12 Joint Stock Co. Siberian Coal Energy Co.
- Joint Stock Co. Siberian Coal Energy Co. - Overview
- Joint Stock Co. Siberian Coal Energy Co. - Product / Service
- Joint Stock Co. Siberian Coal Energy Co. - Key offerings
- SWOT
- 14.13 NACCO Industries Inc.
- NACCO Industries Inc. - Overview
- NACCO Industries Inc. - Business segments
- NACCO Industries Inc. - Key offerings
- NACCO Industries Inc. - Segment focus
- SWOT
- 14.14 NTPC Ltd.
- NTPC Ltd. - Overview
- NTPC Ltd. - Product / Service
- NTPC Ltd. - Key offerings
- SWOT
- 14.15 Peabody Energy Corp.
- Peabody Energy Corp. - Overview
- Peabody Energy Corp. - Product / Service
- Peabody Energy Corp. - Key offerings
- SWOT
- 14.16 Sasol Ltd.
- Sasol Ltd. - Overview
- Sasol Ltd. - Business segments
- Sasol Ltd. - Key news
- Sasol Ltd. - Key offerings
- Sasol Ltd. - Segment focus
- SWOT
- 14.17 Shaanxi Coal and Chemical Industry Group Co. Ltd.
- Shaanxi Coal and Chemical Industry Group Co. Ltd. - Overview
- Shaanxi Coal and Chemical Industry Group Co. Ltd. - Product / Service
- Shaanxi Coal and Chemical Industry Group Co. Ltd. - Key offerings
- SWOT
- 14.18 Teck Resources Ltd.
- Teck Resources Ltd. - Overview
- Teck Resources Ltd. - Business segments
- Teck Resources Ltd. - Key offerings
- Teck Resources Ltd. - Segment focus
- SWOT
15 Appendix
- 15.1 Scope of the report
- 15.2 Inclusions and exclusions checklist
- Inclusions checklist
- Exclusions checklist
- 15.3 Currency conversion rates for US$
- Currency conversion rates for US$
- 15.4 Research methodology
- Research methodology
- 15.5 Data procurement
- Information sources
- 15.6 Data validation
- Data validation
- 15.7 Validation techniques employed for market sizing
- Validation techniques employed for market sizing
- 15.8 Data synthesis
- Data synthesis
- 15.9 360 degree market analysis
- 360 degree market analysis
- 15.10 List of abbreviations
- List of abbreviations

