|
|
市場調査レポート
商品コード
1459473
自動車用タイミングベルトの世界市場 2024-2028Global Automotive Timing Belt Market 2024-2028 |
||||||

|
|||||||
カスタマイズ可能
|
|||||||

| 自動車用タイミングベルトの世界市場 2024-2028 |
|
出版日: 2024年03月26日
発行: TechNavio
ページ情報: 英文 174 Pages
納期: 即納可能
|

全表示
- 概要
- 図表
- 目次
自動車用タイミングベルト市場は2023-2028年に36億6,000万米ドル、予測期間中のCAGRは6.55%で成長すると予測されます。
当レポートでは、自動車用タイミングベルト市場の全体的な分析、市場規模・予測、動向、成長促進要因、課題、約25のベンダーを網羅したベンダー分析などを掲載しています。
現在の市場シナリオ、最新動向と促進要因、市場環境全体に関する最新分析を提供しています。市場は、高性能車への需要の増加、アフターマーケット分野の改善、古くなったり損傷したりしたタイミングベルトの交換ニーズによって牽引されています。
| 市場範囲 | |
|---|---|
| 基準年 | 2024 |
| 終了年 | 2028 |
| 予測期間 | 2024-2028 |
| 成長モメンタム | 加速 |
| 前年比2024年 | 5.69% |
| CAGR | 6.55% |
| 増分額 | 36億6,000万米ドル |
本調査では、今後数年間の自動車用タイミングベルト市場の成長を促進する主な要因の1つとして、タイミングベルト部品へのスマート技術の統合を挙げています。また、寿命を延ばすために自動車用タイミングベルトに繊維強化材料を使用することや、低摩擦タイミングチェーンの登場は、市場の大きな需要につながります。
目次
第1章 エグゼクティブサマリー
- 市場概要
第2章 市場情勢
- 市場エコシステム
第3章 市場規模の評価
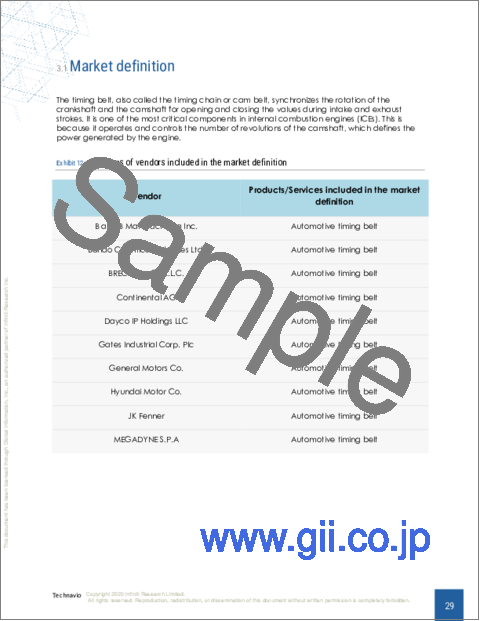
- 市場の定義
- 市場セグメント分析
- 市場規模 2023
- 市場の見通し 2023-2028
第4章 市場規模実績
- 自動車用タイミングベルトの世界市場 2018-2022
- 車両タイプセグメント分析 2018-2022
- エンドユーザーセグメント分析 2018-2022
- 地域別セグメント分析 2018-2022
- 国別セグメント分析 2018-2022
第5章 ファイブフォース分析
- ファイブフォースの要約
- 買い手の交渉力
- 供給企業の交渉力
- 新規参入業者の脅威
- 代替品の脅威
- 競争の脅威
- 市況
第6章 市場セグメンテーション:車両タイプ別
- 市場セグメント
- 比較:車両タイプ別
- 乗用車:市場規模と予測 2023-2028
- 商用車:市場規模と予測 2023-2028
- 市場機会:車両タイプ別
第7章 市場セグメンテーション:エンドユーザー別
- 市場セグメント
- 比較:エンドユーザー別
- OEM:市場規模と予測 2023-2028
- アフターマーケット:市場規模と予測 2023-2028
- 市場機会:エンドユーザー別
第8章 顧客情勢
- 顧客情勢の概要
第9章 地域別情勢
- 地域別セグメンテーション
- 地域別比較
- アジア太平洋:市場規模と予測 2023-2028
- 欧州:市場規模と予測 2023-2028
- 北米:市場規模と予測 2023-2028
- 南米:市場規模と予測 2023-2028
- 中東・アフリカ:市場規模と予測 2023-2028
- 中国:市場規模と予測 2023-2028
- 米国:市場規模と予測 2023-2028
- 日本:市場規模と予測 2023-2028
- ドイツ:市場規模と予測 2023-2028
- 英国:市場規模と予測 2023-2028
- 市場機会:地域情勢別
第10章 促進要因、課題、および動向
- 市場促進要因
- 市場の課題
- 促進要因と課題の影響
- 市場動向
第11章 ベンダー情勢
- 概要
- ベンダー情勢
- 混乱の状況
- 業界のリスク
第12章 ベンダー分析
- 対象ベンダー
- ベンダーの市場ポジショニング
- B and B Manufacturing Inc.
- Bando Chemical Industries Ltd.
- BRECOflex Co L.L.C.
- Continental AG
- Dayco IP Holdings LLC
- Gates Industrial Corp. Plc
- General Motors Co.
- Hyundai Motor Co.
- JK Fenner
- MEGADYNE S.P.A
- Robert Bosch GmbH
- Schaeffler AG
- SKF
- The Goodyear Tire and Rubber Co.
- Tsubakimoto Chain Co.
第13章 付録
Exhibits:
- Exhibits1: Executive Summary - Chart on Market Overview
- Exhibits2: Executive Summary - Data Table on Market Overview
- Exhibits3: Executive Summary - Chart on Global Market Characteristics
- Exhibits4: Executive Summary - Chart on Market By Geographical Landscape
- Exhibits5: Executive Summary - Chart on Market Segmentation by Vehicle Type
- Exhibits6: Executive Summary - Chart on Market Segmentation by End-user
- Exhibits7: Executive Summary - Chart on Incremental Growth
- Exhibits8: Executive Summary - Data Table on Incremental Growth
- Exhibits9: Executive Summary - Chart on Vendor Market Positioning
- Exhibits10: Parent market
- Exhibits11: Market Characteristics
- Exhibits12: Offerings of vendors included in the market definition
- Exhibits13: Market segments
- Exhibits14: Chart on Global - Market size and forecast 2023-2028 ($ billion)
- Exhibits15: Data Table on Global - Market size and forecast 2023-2028 ($ billion)
- Exhibits16: Chart on Global Market: Year-over-year growth 2023-2028 (%)
- Exhibits17: Data Table on Global Market: Year-over-year growth 2023-2028 (%)
- Exhibits18: Historic Market Size - Data Table on global automotive timing belt market 2018 - 2022 ($ billion)
- Exhibits19: Historic Market Size - Vehicle Type Segment 2018 - 2022 ($ billion)
- Exhibits20: Historic Market Size - End-User Segment 2018 - 2022 ($ billion)
- Exhibits21: Historic Market Size - Geography Segment 2018 - 2022 ($ billion)
- Exhibits22: Historic Market Size - Country Segment 2018 - 2022 ($ billion)
- Exhibits23: Five forces analysis - Comparison between 2023 and 2028
- Exhibits24: Chart on Bargaining power of buyers - Impact of key factors 2023 and 2028
- Exhibits25: Bargaining power of suppliers - Impact of key factors in 2023 and 2028
- Exhibits26: Threat of new entrants - Impact of key factors in 2023 and 2028
- Exhibits27: Threat of substitutes - Impact of key factors in 2023 and 2028
- Exhibits28: Threat of rivalry - Impact of key factors in 2023 and 2028
- Exhibits29: Chart on Market condition - Five forces 2023 and 2028
- Exhibits30: Chart on Vehicle Type - Market share 2023-2028 (%)
- Exhibits31: Data Table on Vehicle Type - Market share 2023-2028 (%)
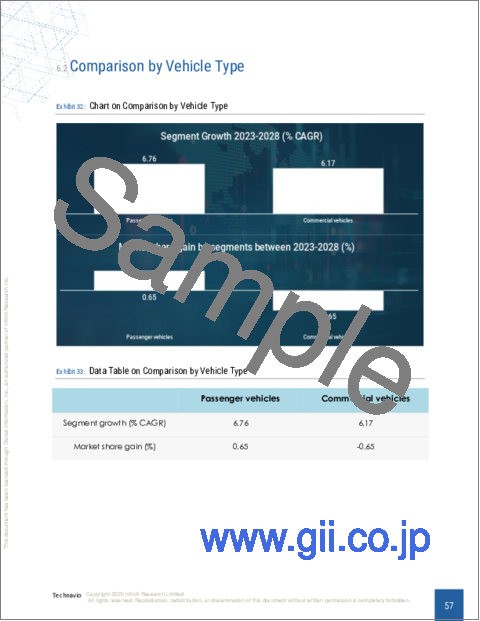
- Exhibits32: Chart on Comparison by Vehicle Type
- Exhibits33: Data Table on Comparison by Vehicle Type
- Exhibits34: Chart on Passenger vehicles - Market size and forecast 2023-2028 ($ billion)
- Exhibits35: Data Table on Passenger vehicles - Market size and forecast 2023-2028 ($ billion)
- Exhibits36: Chart on Passenger vehicles - Year-over-year growth 2023-2028 (%)
- Exhibits37: Data Table on Passenger vehicles - Year-over-year growth 2023-2028 (%)
- Exhibits38: Chart on Commercial vehicles - Market size and forecast 2023-2028 ($ billion)
- Exhibits39: Data Table on Commercial vehicles - Market size and forecast 2023-2028 ($ billion)
- Exhibits40: Chart on Commercial vehicles - Year-over-year growth 2023-2028 (%)
- Exhibits41: Data Table on Commercial vehicles - Year-over-year growth 2023-2028 (%)
- Exhibits42: Market opportunity by Vehicle Type ($ billion)
- Exhibits43: Data Table on Market opportunity by Vehicle Type ($ billion)
- Exhibits44: Chart on End-user - Market share 2023-2028 (%)
- Exhibits45: Data Table on End-user - Market share 2023-2028 (%)
- Exhibits46: Chart on Comparison by End-user
- Exhibits47: Data Table on Comparison by End-user
- Exhibits48: Chart on OEMs - Market size and forecast 2023-2028 ($ billion)
- Exhibits49: Data Table on OEMs - Market size and forecast 2023-2028 ($ billion)
- Exhibits50: Chart on OEMs - Year-over-year growth 2023-2028 (%)
- Exhibits51: Data Table on OEMs - Year-over-year growth 2023-2028 (%)
- Exhibits52: Chart on Aftermarket - Market size and forecast 2023-2028 ($ billion)
- Exhibits53: Data Table on Aftermarket - Market size and forecast 2023-2028 ($ billion)
- Exhibits54: Chart on Aftermarket - Year-over-year growth 2023-2028 (%)
- Exhibits55: Data Table on Aftermarket - Year-over-year growth 2023-2028 (%)
- Exhibits56: Market opportunity by End-user ($ billion)
- Exhibits57: Data Table on Market opportunity by End-user ($ billion)
- Exhibits58: Analysis of price sensitivity, lifecycle, customer purchase basket, adoption rates, and purchase criteria
- Exhibits59: Chart on Market share By Geographical Landscape 2023-2028 (%)
- Exhibits60: Data Table on Market share By Geographical Landscape 2023-2028 (%)
- Exhibits61: Chart on Geographic comparison
- Exhibits62: Data Table on Geographic comparison
- Exhibits63: Chart on APAC - Market size and forecast 2023-2028 ($ billion)
- Exhibits64: Data Table on APAC - Market size and forecast 2023-2028 ($ billion)
- Exhibits65: Chart on APAC - Year-over-year growth 2023-2028 (%)
- Exhibits66: Data Table on APAC - Year-over-year growth 2023-2028 (%)
- Exhibits67: Chart on Europe - Market size and forecast 2023-2028 ($ billion)
- Exhibits68: Data Table on Europe - Market size and forecast 2023-2028 ($ billion)
- Exhibits69: Chart on Europe - Year-over-year growth 2023-2028 (%)
- Exhibits70: Data Table on Europe - Year-over-year growth 2023-2028 (%)
- Exhibits71: Chart on North America - Market size and forecast 2023-2028 ($ billion)
- Exhibits72: Data Table on North America - Market size and forecast 2023-2028 ($ billion)
- Exhibits73: Chart on North America - Year-over-year growth 2023-2028 (%)
- Exhibits74: Data Table on North America - Year-over-year growth 2023-2028 (%)
- Exhibits75: Chart on South America - Market size and forecast 2023-2028 ($ billion)
- Exhibits76: Data Table on South America - Market size and forecast 2023-2028 ($ billion)
- Exhibits77: Chart on South America - Year-over-year growth 2023-2028 (%)
- Exhibits78: Data Table on South America - Year-over-year growth 2023-2028 (%)
- Exhibits79: Chart on Middle East and Africa - Market size and forecast 2023-2028 ($ billion)
- Exhibits80: Data Table on Middle East and Africa - Market size and forecast 2023-2028 ($ billion)
- Exhibits81: Chart on Middle East and Africa - Year-over-year growth 2023-2028 (%)
- Exhibits82: Data Table on Middle East and Africa - Year-over-year growth 2023-2028 (%)
- Exhibits83: Chart on China - Market size and forecast 2023-2028 ($ billion)
- Exhibits84: Data Table on China - Market size and forecast 2023-2028 ($ billion)
- Exhibits85: Chart on China - Year-over-year growth 2023-2028 (%)
- Exhibits86: Data Table on China - Year-over-year growth 2023-2028 (%)
- Exhibits87: Chart on US - Market size and forecast 2023-2028 ($ billion)
- Exhibits88: Data Table on US - Market size and forecast 2023-2028 ($ billion)
- Exhibits89: Chart on US - Year-over-year growth 2023-2028 (%)
- Exhibits90: Data Table on US - Year-over-year growth 2023-2028 (%)
- Exhibits91: Chart on Japan - Market size and forecast 2023-2028 ($ billion)
- Exhibits92: Data Table on Japan - Market size and forecast 2023-2028 ($ billion)
- Exhibits93: Chart on Japan - Year-over-year growth 2023-2028 (%)
- Exhibits94: Data Table on Japan - Year-over-year growth 2023-2028 (%)
- Exhibits95: Chart on Germany - Market size and forecast 2023-2028 ($ billion)
- Exhibits96: Data Table on Germany - Market size and forecast 2023-2028 ($ billion)
- Exhibits97: Chart on Germany - Year-over-year growth 2023-2028 (%)
- Exhibits98: Data Table on Germany - Year-over-year growth 2023-2028 (%)
- Exhibits99: Chart on UK - Market size and forecast 2023-2028 ($ billion)
- Exhibits100: Data Table on UK - Market size and forecast 2023-2028 ($ billion)
- Exhibits101: Chart on UK - Year-over-year growth 2023-2028 (%)
- Exhibits102: Data Table on UK - Year-over-year growth 2023-2028 (%)
- Exhibits103: Market opportunity By Geographical Landscape ($ billion)
- Exhibits104: Data Tables on Market opportunity By Geographical Landscape ($ billion)
- Exhibits105: Impact of drivers and challenges in 2023 and 2028
- Exhibits106: Overview on Criticality of inputs and Factors of differentiation
- Exhibits107: Overview on factors of disruption
- Exhibits108: Impact of key risks on business
- Exhibits109: Vendors covered
- Exhibits110: Matrix on vendor position and classification
- Exhibits111: B and B Manufacturing Inc. - Overview
- Exhibits112: B and B Manufacturing Inc. - Product / Service
- Exhibits113: B and B Manufacturing Inc. - Key offerings
- Exhibits114: Bando Chemical Industries Ltd. - Overview
- Exhibits115: Bando Chemical Industries Ltd. - Business segments
- Exhibits116: Bando Chemical Industries Ltd. - Key offerings
- Exhibits117: Bando Chemical Industries Ltd. - Segment focus
- Exhibits118: BRECOflex Co L.L.C. - Overview
- Exhibits119: BRECOflex Co L.L.C. - Product / Service
- Exhibits120: BRECOflex Co L.L.C. - Key offerings
- Exhibits121: Continental AG - Overview
- Exhibits122: Continental AG - Business segments
- Exhibits123: Continental AG - Key news
- Exhibits124: Continental AG - Key offerings
- Exhibits125: Continental AG - Segment focus
- Exhibits126: Dayco IP Holdings LLC - Overview
- Exhibits127: Dayco IP Holdings LLC - Product / Service
- Exhibits128: Dayco IP Holdings LLC - Key offerings
- Exhibits129: Gates Industrial Corp. Plc - Overview
- Exhibits130: Gates Industrial Corp. Plc - Business segments
- Exhibits131: Gates Industrial Corp. Plc - Key offerings
- Exhibits132: Gates Industrial Corp. Plc - Segment focus
- Exhibits133: General Motors Co. - Overview
- Exhibits134: General Motors Co. - Business segments
- Exhibits135: General Motors Co. - Key news
- Exhibits136: General Motors Co. - Key offerings
- Exhibits137: General Motors Co. - Segment focus
- Exhibits138: Hyundai Motor Co. - Overview
- Exhibits139: Hyundai Motor Co. - Business segments
- Exhibits140: Hyundai Motor Co. - Key news
- Exhibits141: Hyundai Motor Co. - Key offerings
- Exhibits142: Hyundai Motor Co. - Segment focus
- Exhibits143: JK Fenner - Overview
- Exhibits144: JK Fenner - Key offerings
- Exhibits145: MEGADYNE S.P.A - Overview
- Exhibits146: MEGADYNE S.P.A - Product / Service
- Exhibits147: MEGADYNE S.P.A - Key offerings
- Exhibits148: Robert Bosch GmbH - Overview
- Exhibits149: Robert Bosch GmbH - Business segments
- Exhibits150: Robert Bosch GmbH - Key news
- Exhibits151: Robert Bosch GmbH - Key offerings
- Exhibits152: Robert Bosch GmbH - Segment focus
- Exhibits153: Schaeffler AG - Overview
- Exhibits154: Schaeffler AG - Business segments
- Exhibits155: Schaeffler AG - Key offerings
- Exhibits156: Schaeffler AG - Segment focus
- Exhibits157: SKF - Overview
- Exhibits158: SKF - Business segments
- Exhibits159: SKF - Key news
- Exhibits160: SKF - Key offerings
- Exhibits161: SKF - Segment focus
- Exhibits162: The Goodyear Tire and Rubber Co. - Overview
- Exhibits163: The Goodyear Tire and Rubber Co. - Business segments
- Exhibits164: The Goodyear Tire and Rubber Co. - Key news
- Exhibits165: The Goodyear Tire and Rubber Co. - Key offerings
- Exhibits166: The Goodyear Tire and Rubber Co. - Segment focus
- Exhibits167: Tsubakimoto Chain Co. - Overview
- Exhibits168: Tsubakimoto Chain Co. - Business segments
- Exhibits169: Tsubakimoto Chain Co. - Key offerings
- Exhibits170: Tsubakimoto Chain Co. - Segment focus
- Exhibits171: Inclusions checklist
- Exhibits172: Exclusions checklist
- Exhibits173: Currency conversion rates for US$
- Exhibits174: Research methodology
- Exhibits175: Validation techniques employed for market sizing
- Exhibits176: Information sources
- Exhibits177: List of abbreviations
The automotive timing belt market is forecasted to grow by USD 3.66 bn during 2023-2028, accelerating at a CAGR of 6.55% during the forecast period. The report on the automotive timing belt market provides a holistic analysis, market size and forecast, trends, growth drivers, and challenges, as well as vendor analysis covering around 25 vendors.
The report offers an up-to-date analysis regarding the current market scenario, the latest trends and drivers, and the overall market environment. The market is driven by increasing demand for high-performance vehicles, improvement in aftermarket sector, and need for replacement of old and damaged timing belts.
Technavio's automotive timing belt market is segmented as below:
| Market Scope | |
|---|---|
| Base Year | 2024 |
| End Year | 2028 |
| Series Year | 2024-2028 |
| Growth Momentum | Accelerate |
| YOY 2024 | 5.69% |
| CAGR | 6.55% |
| Incremental Value | $3.66bn |
By Vehicle Type
- Passenger vehicles
- Commercial vehicles
By End-user
- OEMs
- Aftermarket
By Geographical Landscape
- APAC
- Europe
- North America
- South America
- Middle East and Africa
This study identifies the integration of smart technologies into timing belt components as one of the prime reasons driving the automotive timing belt market growth during the next few years. Also, use of fiber-reinforced materials in automotive timing belts to increase lifespan and advent of low-friction timing chains will lead to sizable demand in the market.
The report on the automotive timing belt market covers the following areas:
- Automotive timing belt market sizing
- Automotive timing belt market forecast
- Automotive timing belt market industry analysis
The robust vendor analysis is designed to help clients improve their market position, and in line with this, this report provides a detailed analysis of several leading automotive timing belt market vendors that include AISIN CORP., B and B Manufacturing Inc., Bando Chemical Industries Ltd., BorgWarner Inc., BRECOflex Co L.L.C., Continental AG, Dayco IP Holdings LLC, DuraBelt Inc., Gates Industrial Corp. Plc, General Motors Co., MAHLE GmbH, MEGADYNE S.P.A, Mitsuboshi Belting Ltd., Ningbo Fulong Synchronous Belt Co., Ltd, Optibelt GmbH, Robert Bosch GmbH, Schaeffler AG, SKF, The Goodyear Tire and Rubber Co., Tsubakimoto Chain Co., Hyundai Motor Co., and JK Fenner. Also, the automotive timing belt market analysis report includes information on upcoming trends and challenges that will influence market growth. This is to help companies strategize and leverage all forthcoming growth opportunities.
The study was conducted using an objective combination of primary and secondary information including inputs from key participants in the industry. The report contains a comprehensive market and vendor landscape in addition to an analysis of the key vendors.
The publisher presents a detailed picture of the market by the way of study, synthesis, and summation of data from multiple sources by an analysis of key parameters such as profit, pricing, competition, and promotions. It presents various market facets by identifying the key industry influencers. The data presented is comprehensive, reliable, and a result of extensive research - both primary and secondary. The market research reports provide a complete competitive landscape and an in-depth vendor selection methodology and analysis using qualitative and quantitative research to forecast the accurate market growth.
Table of Contents
1 Executive Summary
- 1.1 Market overview
2 Market Landscape
- 2.1 Market ecosystem
3 Market Sizing
- 3.1 Market definition
- 3.2 Market segment analysis
- 3.3 Market size 2023
- 3.4 Market outlook: Forecast for 2023-2028
4 Historic Market Size
- 4.1 Global automotive timing belt market 2018 - 2022
- 4.2 Vehicle Type Segment Analysis 2018 - 2022
- 4.3 End-User Segment Analysis 2018 - 2022
- 4.4 Geography Segment Analysis 2018 - 2022
- 4.5 Country Segment Analysis 2018 - 2022
5 Five Forces Analysis
- 5.1 Five forces summary
- 5.2 Bargaining power of buyers
- 5.3 Bargaining power of suppliers
- 5.4 Threat of new entrants
- 5.5 Threat of substitutes
- 5.6 Threat of rivalry
- 5.7 Market condition
6 Market Segmentation by Vehicle Type
- 6.1 Market segments
- 6.2 Comparison by Vehicle Type
- 6.3 Passenger vehicles - Market size and forecast 2023-2028
- 6.4 Commercial vehicles - Market size and forecast 2023-2028
- 6.5 Market opportunity by Vehicle Type
7 Market Segmentation by End-user
- 7.1 Market segments
- 7.2 Comparison by End-user
- 7.3 OEMs - Market size and forecast 2023-2028
- 7.4 Aftermarket - Market size and forecast 2023-2028
- 7.5 Market opportunity by End-user
8 Customer Landscape
- 8.1 Customer landscape overview
9 Geographic Landscape
- 9.1 Geographic segmentation
- 9.2 Geographic comparison
- 9.3 APAC - Market size and forecast 2023-2028
- 9.4 Europe - Market size and forecast 2023-2028
- 9.5 North America - Market size and forecast 2023-2028
- 9.6 South America - Market size and forecast 2023-2028
- 9.7 Middle East and Africa - Market size and forecast 2023-2028
- 9.8 China - Market size and forecast 2023-2028
- 9.9 US - Market size and forecast 2023-2028
- 9.10 Japan - Market size and forecast 2023-2028
- 9.11 Germany - Market size and forecast 2023-2028
- 9.12 UK - Market size and forecast 2023-2028
- 9.13 Market opportunity By Geographical Landscape
10 Drivers, Challenges, and Trends
- 10.1 Market drivers
- 10.2 Market challenges
- 10.3 Impact of drivers and challenges
- 10.4 Market trends
11 Vendor Landscape
- 11.1 Overview
- 11.2 Vendor landscape
- 11.3 Landscape disruption
- 11.4 Industry risks
12 Vendor Analysis
- 12.1 Vendors covered
- 12.2 Market positioning of vendors
- 12.3 B and B Manufacturing Inc.
- 12.4 Bando Chemical Industries Ltd.
- 12.5 BRECOflex Co L.L.C.
- 12.6 Continental AG
- 12.7 Dayco IP Holdings LLC
- 12.8 Gates Industrial Corp. Plc
- 12.9 General Motors Co.
- 12.10 Hyundai Motor Co.
- 12.11 JK Fenner
- 12.12 MEGADYNE S.P.A
- 12.13 Robert Bosch GmbH
- 12.14 Schaeffler AG
- 12.15 SKF
- 12.16 The Goodyear Tire and Rubber Co.
- 12.17 Tsubakimoto Chain Co.
13 Appendix
- 13.1 Scope of the report
- 13.2 Inclusions and exclusions checklist
- 13.3 Currency conversion rates for US$
- 13.4 Research methodology
- 13.5 List of abbreviations

