|
|
市場調査レポート
商品コード
1684908
ベアリングの世界市場、2025-2029年Global Bearings Market 2025-2029 |
||||||

|
|||||||
カスタマイズ可能
|
|||||||

| ベアリングの世界市場、2025-2029年 |
|
出版日: 2025年03月07日
発行: TechNavio
ページ情報: 英文 262 Pages
納期: 即納可能
|

全表示
- 概要
- 図表
- 目次
ベアリング市場は2024-2029年に172億8,650万米ドル、予測期間中のCAGRは3.3%で成長すると予測されます。
当レポートでは、ベアリング市場の全体的な分析、市場規模・予測、動向、成長促進要因、課題、約25のベンダーを網羅したベンダー分析などを掲載しています。
現在の市場シナリオ、最新動向と促進要因、市場環境全体に関する最新分析を提供しています。市場は、高品質のベアリングに対する強い需要、製造プロセスにおける自動化の採用の拡大、およびAPACが市場の促進役として機能していることが原動力となっています。
| 市場範囲 | |
|---|---|
| 基準年 | 2025 |
| 終了年 | 2029 |
| 予測期間 | 2025-2029 |
| 成長モメンタム | 加速 |
| 前年比2025年 | 3.2% |
| CAGR | 3.3% |
| 増分額 | 172億8,650万米ドル |
本調査は、業界の主要参加者からのインプットを含め、一次情報と二次情報を客観的に組み合わせて実施しました。レポートには、主要企業の分析に加え、包括的な市場規模データ、地域分析によるセグメント、ベンダー情勢が含まれています。レポートには過去データと予測データがあります。
本調査では、今後数年間におけるベアリング市場の成長を促進する主な理由の一つとして、電気自動車の採用が増加していることを挙げています。また、より高い性能レベルを達成するために生産活動を強化する新興OEMや、高品質のベアリングに対する強い需要が、市場の大きな需要につながるでしょう。
目次
第1章 エグゼクティブサマリー
- 市場概要
第2章 Technavio分析
- 価格・ライフサイクル・顧客購入バスケット・採用率・購入基準の分析
- インプットの重要性と差別化の要因
- 混乱の要因
- 促進要因と課題の影響
第3章 市場情勢
- 市場エコシステム
- 市場の特徴
- バリューチェーン分析
第4章 市場規模
- 市場の定義
- 市場セグメント分析
- 市場規模 2024
- 市場の見通し 2024-2029
第5章 市場規模実績
- ベアリングの世界市場 2019-2023
- 製品セグメント分析 2019-2023
- エンドユーザーセグメント分析 2019-2023
- タイプセグメント分析 2019-2023
- 流通チャネルセグメント分析 2019-2023
- 測定セグメント分析 2019-2023
- 地域別セグメント分析 2019-2023
- 国別セグメント分析 2019-2023
第6章 定性分析
- AIの影響:ベアリングの世界市場
第7章 ファイブフォース分析
- ファイブフォースの要約
- 買い手の交渉力
- 供給企業の交渉力
- 新規参入業者の脅威
- 代替品の脅威
- 競争の脅威
- 市況
第8章 市場セグメンテーション:製品別
- 市場セグメント
- 比較:製品別
- アンチフリクションベアリング:市場規模と予測 2024-2029
- マグネティックベアリング:市場規模と予測 2024-2029
- その他:市場規模と予測 2024-2029
- 市場機会:製品別
第9章 市場セグメンテーション:エンドユーザー別
- 市場セグメント
- 比較:エンドユーザー別
- 自動車産業:市場規模と予測 2024-2029
- 重工業:市場規模と予測 2024-2029
- ARS業界:市場規模と予測 2024-2029
- その他:市場規模と予測 2024-2029
- 市場機会:エンドユーザー別
第10章 市場セグメンテーション:タイプ別
- 市場セグメント
- 比較:タイプ別
- マウントベアリング:市場規模と予測 2024-2029
- 非マウントベアリング:市場規模と予測 2024-2029
- 市場機会:タイプ別
第11章 市場セグメンテーション:流通チャネル別
- 市場セグメント
- 比較:流通チャネル別
- OEM:市場規模と予測 2024-2029
- アフターマーケット:市場規模と予測 2024-2029
- 市場機会:流通チャネル別
第12章 市場セグメンテーション:測定別
- 市場セグメント
- 比較:測定別
- 市場機会:測定別
第13章 顧客情勢
- 顧客情勢の概要
第14章 地域別情勢
- 地域別セグメンテーション
- 地域別比較
- アジア太平洋:市場規模と予測 2024-2029
- 欧州:市場規模と予測 2024-2029
- 北米:市場規模と予測 2024-2029
- 南米:市場規模と予測 2024-2029
- 中東・アフリカ:市場規模と予測 2024-2029
- 米国:市場規模と予測 2024-2029
- 中国:市場規模と予測 2024-2029
- ドイツ:市場規模と予測 2024-2029
- 日本:市場規模と予測 2024-2029
- インド:市場規模と予測 2024-2029
- 英国:市場規模と予測 2024-2029
- 韓国:市場規模と予測 2024-2029
- カナダ:市場規模と予測 2024-2029
- フランス:市場規模と予測 2024-2029
- イタリア:市場規模と予測 2024-2029
- 市場機会:地域情勢別
第15章 促進要因・課題・機会・抑制要因
- 市場促進要因
- 市場の課題
- 促進要因と課題の影響
- 市場の機会・抑制要因
第16章 競合情勢
- 概要
- 競合情勢
- 混乱の状況
- 業界のリスク
第17章 競合分析
- 企業プロファイル
- 企業ランキング指数
- 企業の市場ポジショニング
- AB SKF
- ASAHI SEIKO Co. Ltd.
- C and U Group
- Grupo NBI
- HKT BEARINGS Ltd.
- JTEKT Corp.
- Luoyang JCB Bearing Technology Co. Ltd.
- LYC Bearing Corp.
- MinebeaMitsumi Inc.
- NACHI FUJIKOSHI Corp.
- NSK Ltd.
- NTN Corp.
- RBC Bearings Inc.
- Regal Rexnord Corp.
- Schaeffler AG
第18章 付録
Exhibits:
- Exhibits1: Executive Summary - Chart on Market Overview
- Exhibits2: Executive Summary - Data Table on Market Overview
- Exhibits3: Executive Summary - Chart on Global Market Characteristics
- Exhibits4: Executive Summary - Chart on Market By Geographical Landscape
- Exhibits5: Executive Summary - Chart on Market Segmentation by Product
- Exhibits6: Executive Summary - Chart on Market Segmentation by End-user
- Exhibits7: Executive Summary - Chart on Market Segmentation by Type
- Exhibits8: Executive Summary - Chart on Market Segmentation by Distribution Channel
- Exhibits9: Executive Summary - Chart on Market Segmentation by Measurement
- Exhibits10: Executive Summary - Chart on Incremental Growth
- Exhibits11: Executive Summary - Data Table on Incremental Growth
- Exhibits12: Executive Summary - Chart on Company Market Positioning
- Exhibits13: Analysis of price sensitivity, lifecycle, customer purchase basket, adoption rates, and purchase criteria
- Exhibits14: Overview on criticality of inputs and factors of differentiation
- Exhibits15: Overview on factors of disruption
- Exhibits16: Impact of drivers and challenges in 2024 and 2029
- Exhibits17: Parent Market
- Exhibits18: Data Table on - Parent Market
- Exhibits19: Market characteristics analysis
- Exhibits20: Value chain analysis
- Exhibits21: Offerings of companies included in the market definition
- Exhibits22: Market segments
- Exhibits23: Chart on Global - Market size and forecast 2024-2029 ($ million)
- Exhibits24: Data Table on Global - Market size and forecast 2024-2029 ($ million)
- Exhibits25: Chart on Global Market: Year-over-year growth 2024-2029 (%)
- Exhibits26: Data Table on Global Market: Year-over-year growth 2024-2029 (%)
- Exhibits27: Historic Market Size - Data Table on Global Bearings Market 2019 - 2023 ($ million)
- Exhibits28: Historic Market Size - Product Segment 2019 - 2023 ($ million)
- Exhibits29: Historic Market Size - End-user Segment 2019 - 2023 ($ million)
- Exhibits30: Historic Market Size - Type Segment 2019 - 2023 ($ million)
- Exhibits31: Historic Market Size - Distribution Channel Segment 2019 - 2023 ($ million)
- Exhibits32: Historic Market Size - Measurement Segment 2019 - 2023 ($ million)
- Exhibits33: Historic Market Size - Geography Segment 2019 - 2023 ($ million)
- Exhibits34: Historic Market Size - Country Segment 2019 - 2023 ($ million)
- Exhibits35: Five forces analysis - Comparison between 2024 and 2029
- Exhibits36: Bargaining power of buyers - Impact of key factors 2024 and 2029
- Exhibits37: Bargaining power of suppliers - Impact of key factors in 2024 and 2029
- Exhibits38: Threat of new entrants - Impact of key factors in 2024 and 2029
- Exhibits39: Threat of substitutes - Impact of key factors in 2024 and 2029
- Exhibits40: Threat of rivalry - Impact of key factors in 2024 and 2029
- Exhibits41: Chart on Market condition - Five forces 2024 and 2029
- Exhibits42: Chart on Product - Market share 2024-2029 (%)
- Exhibits43: Data Table on Product - Market share 2024-2029 (%)
- Exhibits44: Chart on Comparison by Product
- Exhibits45: Data Table on Comparison by Product
- Exhibits46: Chart on Anti-friction bearings - Market size and forecast 2024-2029 ($ million)
- Exhibits47: Data Table on Anti-friction bearings - Market size and forecast 2024-2029 ($ million)
- Exhibits48: Chart on Anti-friction bearings - Year-over-year growth 2024-2029 (%)
- Exhibits49: Data Table on Anti-friction bearings - Year-over-year growth 2024-2029 (%)
- Exhibits50: Chart on Magnetic bearings - Market size and forecast 2024-2029 ($ million)
- Exhibits51: Data Table on Magnetic bearings - Market size and forecast 2024-2029 ($ million)
- Exhibits52: Chart on Magnetic bearings - Year-over-year growth 2024-2029 (%)
- Exhibits53: Data Table on Magnetic bearings - Year-over-year growth 2024-2029 (%)
- Exhibits54: Chart on Others - Market size and forecast 2024-2029 ($ million)
- Exhibits55: Data Table on Others - Market size and forecast 2024-2029 ($ million)
- Exhibits56: Chart on Others - Year-over-year growth 2024-2029 (%)
- Exhibits57: Data Table on Others - Year-over-year growth 2024-2029 (%)
- Exhibits58: Market opportunity by Product ($ million)
- Exhibits59: Data Table on Market opportunity by Product ($ million)
- Exhibits60: Chart on End-user - Market share 2024-2029 (%)
- Exhibits61: Data Table on End-user - Market share 2024-2029 (%)
- Exhibits62: Chart on Comparison by End-user
- Exhibits63: Data Table on Comparison by End-user
- Exhibits64: Chart on Automotive industry - Market size and forecast 2024-2029 ($ million)
- Exhibits65: Data Table on Automotive industry - Market size and forecast 2024-2029 ($ million)
- Exhibits66: Chart on Automotive industry - Year-over-year growth 2024-2029 (%)
- Exhibits67: Data Table on Automotive industry - Year-over-year growth 2024-2029 (%)
- Exhibits68: Chart on Heavy industry - Market size and forecast 2024-2029 ($ million)
- Exhibits69: Data Table on Heavy industry - Market size and forecast 2024-2029 ($ million)
- Exhibits70: Chart on Heavy industry - Year-over-year growth 2024-2029 (%)
- Exhibits71: Data Table on Heavy industry - Year-over-year growth 2024-2029 (%)
- Exhibits72: Chart on ARS industry - Market size and forecast 2024-2029 ($ million)
- Exhibits73: Data Table on ARS industry - Market size and forecast 2024-2029 ($ million)
- Exhibits74: Chart on ARS industry - Year-over-year growth 2024-2029 (%)
- Exhibits75: Data Table on ARS industry - Year-over-year growth 2024-2029 (%)
- Exhibits76: Chart on Others - Market size and forecast 2024-2029 ($ million)
- Exhibits77: Data Table on Others - Market size and forecast 2024-2029 ($ million)
- Exhibits78: Chart on Others - Year-over-year growth 2024-2029 (%)
- Exhibits79: Data Table on Others - Year-over-year growth 2024-2029 (%)
- Exhibits80: Market opportunity by End-user ($ million)
- Exhibits81: Data Table on Market opportunity by End-user ($ million)
- Exhibits82: Chart on Type - Market share 2024-2029 (%)
- Exhibits83: Data Table on Type - Market share 2024-2029 (%)
- Exhibits84: Chart on Comparison by Type
- Exhibits85: Data Table on Comparison by Type
- Exhibits86: Chart on Mounted bearing - Market size and forecast 2024-2029 ($ million)
- Exhibits87: Data Table on Mounted bearing - Market size and forecast 2024-2029 ($ million)
- Exhibits88: Chart on Mounted bearing - Year-over-year growth 2024-2029 (%)
- Exhibits89: Data Table on Mounted bearing - Year-over-year growth 2024-2029 (%)
- Exhibits90: Chart on Unmounted bearing - Market size and forecast 2024-2029 ($ million)
- Exhibits91: Data Table on Unmounted bearing - Market size and forecast 2024-2029 ($ million)
- Exhibits92: Chart on Unmounted bearing - Year-over-year growth 2024-2029 (%)
- Exhibits93: Data Table on Unmounted bearing - Year-over-year growth 2024-2029 (%)
- Exhibits94: Market opportunity by Type ($ million)
- Exhibits95: Data Table on Market opportunity by Type ($ million)
- Exhibits96: Chart on Distribution Channel - Market share 2024-2029 (%)
- Exhibits97: Data Table on Distribution Channel - Market share 2024-2029 (%)
- Exhibits98: Chart on Comparison by Distribution Channel
- Exhibits99: Data Table on Comparison by Distribution Channel
- Exhibits100: Chart on OEM - Market size and forecast 2024-2029 ($ million)
- Exhibits101: Data Table on OEM - Market size and forecast 2024-2029 ($ million)
- Exhibits102: Chart on OEM - Year-over-year growth 2024-2029 (%)
- Exhibits103: Data Table on OEM - Year-over-year growth 2024-2029 (%)
- Exhibits104: Chart on Aftermarket - Market size and forecast 2024-2029 ($ million)
- Exhibits105: Data Table on Aftermarket - Market size and forecast 2024-2029 ($ million)
- Exhibits106: Chart on Aftermarket - Year-over-year growth 2024-2029 (%)
- Exhibits107: Data Table on Aftermarket - Year-over-year growth 2024-2029 (%)
- Exhibits108: Market opportunity by Distribution Channel ($ million)
- Exhibits109: Data Table on Market opportunity by Distribution Channel ($ million)
- Exhibits110: Chart on Measurement - Market share 2024-2029 (%)
- Exhibits111: Data Table on Measurement - Market share 2024-2029 (%)
- Exhibits112: Chart on Comparison by Measurement
- Exhibits113: Data Table on Comparison by Measurement
- Exhibits114: Chart on 30 to 40 - Market size and forecast 2024-2029 ($ million)
- Exhibits115: Data Table on 30 to 40 - Market size and forecast 2024-2029 ($ million)
- Exhibits116: Chart on 30 to 40 - Year-over-year growth 2024-2029 (%)
- Exhibits117: Data Table on 30 to 40 - Year-over-year growth 2024-2029 (%)
- Exhibits118: Chart on 41 to 50 - Market size and forecast 2024-2029 ($ million)
- Exhibits119: Data Table on 41 to 50 - Market size and forecast 2024-2029 ($ million)
- Exhibits120: Chart on 41 to 50 - Year-over-year growth 2024-2029 (%)
- Exhibits121: Data Table on 41 to 50 - Year-over-year growth 2024-2029 (%)
- Exhibits122: Chart on 51 to 60 - Market size and forecast 2024-2029 ($ million)
- Exhibits123: Data Table on 51 to 60 - Market size and forecast 2024-2029 ($ million)
- Exhibits124: Chart on 51 to 60 - Year-over-year growth 2024-2029 (%)
- Exhibits125: Data Table on 51 to 60 - Year-over-year growth 2024-2029 (%)
- Exhibits126: Chart on 61 to 70 - Market size and forecast 2024-2029 ($ million)
- Exhibits127: Data Table on 61 to 70 - Market size and forecast 2024-2029 ($ million)
- Exhibits128: Chart on 61 to 70 - Year-over-year growth 2024-2029 (%)
- Exhibits129: Data Table on 61 to 70 - Year-over-year growth 2024-2029 (%)
- Exhibits130: Chart on 70 and above - Market size and forecast 2024-2029 ($ million)
- Exhibits131: Data Table on 70 and above - Market size and forecast 2024-2029 ($ million)
- Exhibits132: Chart on 70 and above - Year-over-year growth 2024-2029 (%)
- Exhibits133: Data Table on 70 and above - Year-over-year growth 2024-2029 (%)
- Exhibits134: Market opportunity by Measurement ($ million)
- Exhibits135: Data Table on Market opportunity by Measurement ($ million)
- Exhibits136: Analysis of price sensitivity, lifecycle, customer purchase basket, adoption rates, and purchase criteria
- Exhibits137: Chart on Market share By Geographical Landscape 2024-2029 (%)
- Exhibits138: Data Table on Market share By Geographical Landscape 2024-2029 (%)
- Exhibits139: Chart on Geographic comparison
- Exhibits140: Data Table on Geographic comparison
- Exhibits141: Chart on APAC - Market size and forecast 2024-2029 ($ million)
- Exhibits142: Data Table on APAC - Market size and forecast 2024-2029 ($ million)
- Exhibits143: Chart on APAC - Year-over-year growth 2024-2029 (%)
- Exhibits144: Data Table on APAC - Year-over-year growth 2024-2029 (%)
- Exhibits145: Chart on Europe - Market size and forecast 2024-2029 ($ million)
- Exhibits146: Data Table on Europe - Market size and forecast 2024-2029 ($ million)
- Exhibits147: Chart on Europe - Year-over-year growth 2024-2029 (%)
- Exhibits148: Data Table on Europe - Year-over-year growth 2024-2029 (%)
- Exhibits149: Chart on North America - Market size and forecast 2024-2029 ($ million)
- Exhibits150: Data Table on North America - Market size and forecast 2024-2029 ($ million)
- Exhibits151: Chart on North America - Year-over-year growth 2024-2029 (%)
- Exhibits152: Data Table on North America - Year-over-year growth 2024-2029 (%)
- Exhibits153: Chart on South America - Market size and forecast 2024-2029 ($ million)
- Exhibits154: Data Table on South America - Market size and forecast 2024-2029 ($ million)
- Exhibits155: Chart on South America - Year-over-year growth 2024-2029 (%)
- Exhibits156: Data Table on South America - Year-over-year growth 2024-2029 (%)
- Exhibits157: Chart on Middle East and Africa - Market size and forecast 2024-2029 ($ million)
- Exhibits158: Data Table on Middle East and Africa - Market size and forecast 2024-2029 ($ million)
- Exhibits159: Chart on Middle East and Africa - Year-over-year growth 2024-2029 (%)
- Exhibits160: Data Table on Middle East and Africa - Year-over-year growth 2024-2029 (%)
- Exhibits161: Chart on US - Market size and forecast 2024-2029 ($ million)
- Exhibits162: Data Table on US - Market size and forecast 2024-2029 ($ million)
- Exhibits163: Chart on US - Year-over-year growth 2024-2029 (%)
- Exhibits164: Data Table on US - Year-over-year growth 2024-2029 (%)
- Exhibits165: Chart on China - Market size and forecast 2024-2029 ($ million)
- Exhibits166: Data Table on China - Market size and forecast 2024-2029 ($ million)
- Exhibits167: Chart on China - Year-over-year growth 2024-2029 (%)
- Exhibits168: Data Table on China - Year-over-year growth 2024-2029 (%)
- Exhibits169: Chart on Germany - Market size and forecast 2024-2029 ($ million)
- Exhibits170: Data Table on Germany - Market size and forecast 2024-2029 ($ million)
- Exhibits171: Chart on Germany - Year-over-year growth 2024-2029 (%)
- Exhibits172: Data Table on Germany - Year-over-year growth 2024-2029 (%)
- Exhibits173: Chart on Japan - Market size and forecast 2024-2029 ($ million)
- Exhibits174: Data Table on Japan - Market size and forecast 2024-2029 ($ million)
- Exhibits175: Chart on Japan - Year-over-year growth 2024-2029 (%)
- Exhibits176: Data Table on Japan - Year-over-year growth 2024-2029 (%)
- Exhibits177: Chart on India - Market size and forecast 2024-2029 ($ million)
- Exhibits178: Data Table on India - Market size and forecast 2024-2029 ($ million)
- Exhibits179: Chart on India - Year-over-year growth 2024-2029 (%)
- Exhibits180: Data Table on India - Year-over-year growth 2024-2029 (%)
- Exhibits181: Chart on UK - Market size and forecast 2024-2029 ($ million)
- Exhibits182: Data Table on UK - Market size and forecast 2024-2029 ($ million)
- Exhibits183: Chart on UK - Year-over-year growth 2024-2029 (%)
- Exhibits184: Data Table on UK - Year-over-year growth 2024-2029 (%)
- Exhibits185: Chart on South Korea - Market size and forecast 2024-2029 ($ million)
- Exhibits186: Data Table on South Korea - Market size and forecast 2024-2029 ($ million)
- Exhibits187: Chart on South Korea - Year-over-year growth 2024-2029 (%)
- Exhibits188: Data Table on South Korea - Year-over-year growth 2024-2029 (%)
- Exhibits189: Chart on Canada - Market size and forecast 2024-2029 ($ million)
- Exhibits190: Data Table on Canada - Market size and forecast 2024-2029 ($ million)
- Exhibits191: Chart on Canada - Year-over-year growth 2024-2029 (%)
- Exhibits192: Data Table on Canada - Year-over-year growth 2024-2029 (%)
- Exhibits193: Chart on France - Market size and forecast 2024-2029 ($ million)
- Exhibits194: Data Table on France - Market size and forecast 2024-2029 ($ million)
- Exhibits195: Chart on France - Year-over-year growth 2024-2029 (%)
- Exhibits196: Data Table on France - Year-over-year growth 2024-2029 (%)
- Exhibits197: Chart on Italy - Market size and forecast 2024-2029 ($ million)
- Exhibits198: Data Table on Italy - Market size and forecast 2024-2029 ($ million)
- Exhibits199: Chart on Italy - Year-over-year growth 2024-2029 (%)
- Exhibits200: Data Table on Italy - Year-over-year growth 2024-2029 (%)
- Exhibits201: Market opportunity By Geographical Landscape ($ million)
- Exhibits202: Data Tables on Market opportunity By Geographical Landscape ($ million)
- Exhibits203: Impact of drivers and challenges in 2024 and 2029
- Exhibits204: Overview on criticality of inputs and factors of differentiation
- Exhibits205: Overview on factors of disruption
- Exhibits206: Impact of key risks on business
- Exhibits207: Companies covered
- Exhibits208: Company ranking index
- Exhibits209: Matrix on companies position and classification
- Exhibits210: AB SKF - Overview
- Exhibits211: AB SKF - Business segments
- Exhibits212: AB SKF - Key news
- Exhibits213: AB SKF - Key offerings
- Exhibits214: AB SKF - Segment focus
- Exhibits215: SWOT
- Exhibits216: ASAHI SEIKO Co. Ltd. - Overview
- Exhibits217: ASAHI SEIKO Co. Ltd. - Product / Service
- Exhibits218: ASAHI SEIKO Co. Ltd. - Key offerings
- Exhibits219: SWOT
- Exhibits220: C and U Group - Overview
- Exhibits221: C and U Group - Product / Service
- Exhibits222: C and U Group - Key offerings
- Exhibits223: SWOT
- Exhibits224: Grupo NBI - Overview
- Exhibits225: Grupo NBI - Product / Service
- Exhibits226: Grupo NBI - Key offerings
- Exhibits227: SWOT
- Exhibits228: HKT BEARINGS Ltd. - Overview
- Exhibits229: HKT BEARINGS Ltd. - Product / Service
- Exhibits230: HKT BEARINGS Ltd. - Key offerings
- Exhibits231: SWOT
- Exhibits232: JTEKT Corp. - Overview
- Exhibits233: JTEKT Corp. - Business segments
- Exhibits234: JTEKT Corp. - Key news
- Exhibits235: JTEKT Corp. - Key offerings
- Exhibits236: JTEKT Corp. - Segment focus
- Exhibits237: SWOT
- Exhibits238: Luoyang JCB Bearing Technology Co. Ltd. - Overview
- Exhibits239: Luoyang JCB Bearing Technology Co. Ltd. - Product / Service
- Exhibits240: Luoyang JCB Bearing Technology Co. Ltd. - Key offerings
- Exhibits241: SWOT
- Exhibits242: LYC Bearing Corp. - Overview
- Exhibits243: LYC Bearing Corp. - Product / Service
- Exhibits244: LYC Bearing Corp. - Key offerings
- Exhibits245: SWOT
- Exhibits246: MinebeaMitsumi Inc. - Overview
- Exhibits247: MinebeaMitsumi Inc. - Business segments
- Exhibits248: MinebeaMitsumi Inc. - Key offerings
- Exhibits249: MinebeaMitsumi Inc. - Segment focus
- Exhibits250: SWOT
- Exhibits251: NACHI FUJIKOSHI Corp. - Overview
- Exhibits252: NACHI FUJIKOSHI Corp. - Business segments
- Exhibits253: NACHI FUJIKOSHI Corp. - Key news
- Exhibits254: NACHI FUJIKOSHI Corp. - Key offerings
- Exhibits255: NACHI FUJIKOSHI Corp. - Segment focus
- Exhibits256: SWOT
- Exhibits257: NSK Ltd. - Overview
- Exhibits258: NSK Ltd. - Product / Service
- Exhibits259: NSK Ltd. - Key news
- Exhibits260: NSK Ltd. - Key offerings
- Exhibits261: SWOT
- Exhibits262: NTN Corp. - Overview
- Exhibits263: NTN Corp. - Business segments
- Exhibits264: NTN Corp. - Key offerings
- Exhibits265: NTN Corp. - Segment focus
- Exhibits266: SWOT
- Exhibits267: RBC Bearings Inc. - Overview
- Exhibits268: RBC Bearings Inc. - Business segments
- Exhibits269: RBC Bearings Inc. - Key offerings
- Exhibits270: RBC Bearings Inc. - Segment focus
- Exhibits271: SWOT
- Exhibits272: Regal Rexnord Corp. - Overview
- Exhibits273: Regal Rexnord Corp. - Business segments
- Exhibits274: Regal Rexnord Corp. - Key news
- Exhibits275: Regal Rexnord Corp. - Key offerings
- Exhibits276: Regal Rexnord Corp. - Segment focus
- Exhibits277: SWOT
- Exhibits278: Schaeffler AG - Overview
- Exhibits279: Schaeffler AG - Business segments
- Exhibits280: Schaeffler AG - Key news
- Exhibits281: Schaeffler AG - Key offerings
- Exhibits282: Schaeffler AG - Segment focus
- Exhibits283: SWOT
- Exhibits284: Inclusions checklist
- Exhibits285: Exclusions checklist
- Exhibits286: Currency conversion rates for US$
- Exhibits287: Research methodology
- Exhibits288: Information sources
- Exhibits289: Data validation
- Exhibits290: Validation techniques employed for market sizing
- Exhibits291: Data synthesis
- Exhibits292: 360 degree market analysis
- Exhibits293: List of abbreviations
The bearings market is forecasted to grow by USD 17286.5 million during 2024-2029, accelerating at a CAGR of 3.3% during the forecast period. The report on the bearings market provides a holistic analysis, market size and forecast, trends, growth drivers, and challenges, as well as vendor analysis covering around 25 vendors.
The report offers an up-to-date analysis regarding the current market scenario, the latest trends and drivers, and the overall market environment. The market is driven by strong demand for high-quality bearings, growing adoption of automation in manufacturing process, and APAC acting as market enabler.
| Market Scope | |
|---|---|
| Base Year | 2025 |
| End Year | 2029 |
| Series Year | 2025-2029 |
| Growth Momentum | Accelerate |
| YOY 2025 | 3.2% |
| CAGR | 3.3% |
| Incremental Value | $17286.5 mn |
The study was conducted using an objective combination of primary and secondary information including inputs from key participants in the industry. The report contains a comprehensive market size data, segment with regional analysis and vendor landscape in addition to an analysis of the key companies. Reports have historic and forecast data.
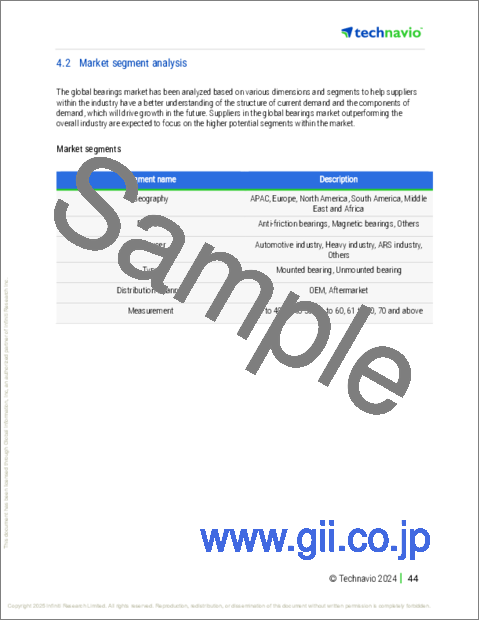
Technavio's bearings market is segmented as below:
By Product
- Anti-friction bearings
- Magnetic bearings
- Others
By End-user
- Automotive industry
- Heavy industry
- ARS industry
- Others
By Type
- Mounted bearing
- Unmounted bearing
By Distribution Channel
- OEM
- Aftermarket
By Measurement
- 30 to 40
- 41 to 50
- 51 to 60
- 61 to 70
- 70 and above
By Geographical Landscape
- APAC
- Europe
- North America
- South America
- Middle East and Africa
This study identifies the increasing adoption of electric vehicles as one of the prime reasons driving the bearings market growth during the next few years. Also, emergence oems enhancing production activities to achieve higher performance levels and strong demand for high-quality bearings will lead to sizable demand in the market.
The report on the bearings market covers the following areas:
- Bearings Market sizing
- Bearings Market forecast
- Bearings Market industry analysis
The robust vendor analysis is designed to help clients improve their market position, and in line with this, this report provides a detailed analysis of several leading bearings market vendors that include AB SKF, ASAHI SEIKO Co. Ltd., C and U Group, Calnetix Technologies LLC, Grupo NBI, HKT BEARINGS Ltd., ISB Industries, JTEKT Corp., Luoyang JCB Bearing Technology Co. Ltd., LYC Bearing Corp., MinebeaMitsumi Inc., NACHI FUJIKOSHI Corp., NSK Ltd., NTN Corp., RBC Bearings Inc., Regal Rexnord Corp., Schaeffler AG, SRIJI GOPALJI INDUSTRIES PVT LTD., THB Bearings Co. Ltd., The Timken Co., and Wafangdian Guangyang Bearing Group Co. Ltd.. Also, the bearings market analysis report includes information on upcoming trends and challenges that will influence market growth. This is to help companies strategize and leverage all forthcoming growth opportunities.
The publisher presents a detailed picture of the market by the way of study, synthesis, and summation of data from multiple sources by an analysis of key parameters such as profit, pricing, competition, and promotions. It presents various market facets by identifying the key industry influencers. The data presented is comprehensive, reliable, and a result of extensive primary and secondary research. The market research reports provide a complete competitive landscape and an in-depth vendor selection methodology and analysis using qualitative and quantitative research to forecast accurate market growth.
Table of Contents
1 Executive Summary
- 1.1 Market overview
- Executive Summary - Chart on Market Overview
- Executive Summary - Data Table on Market Overview
- Executive Summary - Chart on Global Market Characteristics
- Executive Summary - Chart on Market By Geographical Landscape
- Executive Summary - Chart on Market Segmentation by Product
- Executive Summary - Chart on Market Segmentation by End-user
- Executive Summary - Chart on Market Segmentation by Type
- Executive Summary - Chart on Market Segmentation by Distribution Channel
- Executive Summary - Chart on Market Segmentation by Measurement
- Executive Summary - Chart on Incremental Growth
- Executive Summary - Data Table on Incremental Growth
- Executive Summary - Chart on Company Market Positioning
2 Technavio Analysis
- 2.1 Analysis of price sensitivity, lifecycle, customer purchase basket, adoption rates, and purchase criteria
- Analysis of price sensitivity, lifecycle, customer purchase basket, adoption rates, and purchase criteria
- 2.2 Criticality of inputs and Factors of differentiation
- Overview on criticality of inputs and factors of differentiation
- 2.3 Factors of disruption
- Overview on factors of disruption
- 2.4 Impact of drivers and challenges
- Impact of drivers and challenges in 2024 and 2029
3 Market Landscape
- 3.1 Market ecosystem
- Parent Market
- Data Table on - Parent Market
- 3.2 Market characteristics
- Market characteristics analysis
- 3.3 Value chain analysis
- Value chain analysis
4 Market Sizing
- 4.1 Market definition
- Offerings of companies included in the market definition
- 4.2 Market segment analysis
- Market segments
- 4.3 Market size 2024
- 4.4 Market outlook: Forecast for 2024-2029
- Chart on Global - Market size and forecast 2024-2029 ($ million)
- Data Table on Global - Market size and forecast 2024-2029 ($ million)
- Chart on Global Market: Year-over-year growth 2024-2029 (%)
- Data Table on Global Market: Year-over-year growth 2024-2029 (%)
5 Historic Market Size
- 5.1 Global Bearings Market 2019 - 2023
- Historic Market Size - Data Table on Global Bearings Market 2019 - 2023 ($ million)
- 5.2 Product segment analysis 2019 - 2023
- Historic Market Size - Product Segment 2019 - 2023 ($ million)
- 5.3 End-user segment analysis 2019 - 2023
- Historic Market Size - End-user Segment 2019 - 2023 ($ million)
- 5.4 Type segment analysis 2019 - 2023
- Historic Market Size - Type Segment 2019 - 2023 ($ million)
- 5.5 Distribution Channel segment analysis 2019 - 2023
- Historic Market Size - Distribution Channel Segment 2019 - 2023 ($ million)
- 5.6 Measurement segment analysis 2019 - 2023
- Historic Market Size - Measurement Segment 2019 - 2023 ($ million)
- 5.7 Geography segment analysis 2019 - 2023
- Historic Market Size - Geography Segment 2019 - 2023 ($ million)
- 5.8 Country segment analysis 2019 - 2023
- Historic Market Size - Country Segment 2019 - 2023 ($ million)
6 Qualitative Analysis
- 6.1 Impact of AI in global bearings market
7 Five Forces Analysis
- 7.1 Five forces summary
- Five forces analysis - Comparison between 2024 and 2029
- 7.2 Bargaining power of buyers
- Bargaining power of buyers - Impact of key factors 2024 and 2029
- 7.3 Bargaining power of suppliers
- Bargaining power of suppliers - Impact of key factors in 2024 and 2029
- 7.4 Threat of new entrants
- Threat of new entrants - Impact of key factors in 2024 and 2029
- 7.5 Threat of substitutes
- Threat of substitutes - Impact of key factors in 2024 and 2029
- 7.6 Threat of rivalry
- Threat of rivalry - Impact of key factors in 2024 and 2029
- 7.7 Market condition
- Chart on Market condition - Five forces 2024 and 2029
8 Market Segmentation by Product
- 8.1 Market segments
- Chart on Product - Market share 2024-2029 (%)
- Data Table on Product - Market share 2024-2029 (%)
- 8.2 Comparison by Product
- Chart on Comparison by Product
- Data Table on Comparison by Product
- 8.3 Anti-friction bearings - Market size and forecast 2024-2029
- Chart on Anti-friction bearings - Market size and forecast 2024-2029 ($ million)
- Data Table on Anti-friction bearings - Market size and forecast 2024-2029 ($ million)
- Chart on Anti-friction bearings - Year-over-year growth 2024-2029 (%)
- Data Table on Anti-friction bearings - Year-over-year growth 2024-2029 (%)
- 8.4 Magnetic bearings - Market size and forecast 2024-2029
- Chart on Magnetic bearings - Market size and forecast 2024-2029 ($ million)
- Data Table on Magnetic bearings - Market size and forecast 2024-2029 ($ million)
- Chart on Magnetic bearings - Year-over-year growth 2024-2029 (%)
- Data Table on Magnetic bearings - Year-over-year growth 2024-2029 (%)
- 8.5 Others - Market size and forecast 2024-2029
- Chart on Others - Market size and forecast 2024-2029 ($ million)
- Data Table on Others - Market size and forecast 2024-2029 ($ million)
- Chart on Others - Year-over-year growth 2024-2029 (%)
- Data Table on Others - Year-over-year growth 2024-2029 (%)
- 8.6 Market opportunity by Product
- Market opportunity by Product ($ million)
- Data Table on Market opportunity by Product ($ million)
9 Market Segmentation by End-user
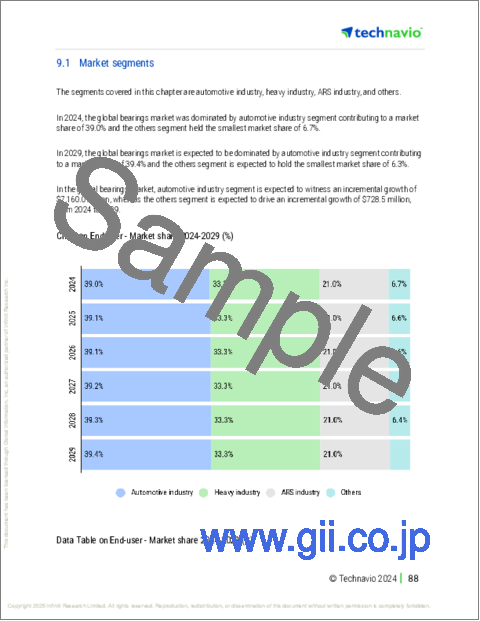
- 9.1 Market segments
- Chart on End-user - Market share 2024-2029 (%)
- Data Table on End-user - Market share 2024-2029 (%)
- 9.2 Comparison by End-user
- Chart on Comparison by End-user
- Data Table on Comparison by End-user
- 9.3 Automotive industry - Market size and forecast 2024-2029
- Chart on Automotive industry - Market size and forecast 2024-2029 ($ million)
- Data Table on Automotive industry - Market size and forecast 2024-2029 ($ million)
- Chart on Automotive industry - Year-over-year growth 2024-2029 (%)
- Data Table on Automotive industry - Year-over-year growth 2024-2029 (%)
- 9.4 Heavy industry - Market size and forecast 2024-2029
- Chart on Heavy industry - Market size and forecast 2024-2029 ($ million)
- Data Table on Heavy industry - Market size and forecast 2024-2029 ($ million)
- Chart on Heavy industry - Year-over-year growth 2024-2029 (%)
- Data Table on Heavy industry - Year-over-year growth 2024-2029 (%)
- 9.5 ARS industry - Market size and forecast 2024-2029
- Chart on ARS industry - Market size and forecast 2024-2029 ($ million)
- Data Table on ARS industry - Market size and forecast 2024-2029 ($ million)
- Chart on ARS industry - Year-over-year growth 2024-2029 (%)
- Data Table on ARS industry - Year-over-year growth 2024-2029 (%)
- 9.6 Others - Market size and forecast 2024-2029
- Chart on Others - Market size and forecast 2024-2029 ($ million)
- Data Table on Others - Market size and forecast 2024-2029 ($ million)
- Chart on Others - Year-over-year growth 2024-2029 (%)
- Data Table on Others - Year-over-year growth 2024-2029 (%)
- 9.7 Market opportunity by End-user
- Market opportunity by End-user ($ million)
- Data Table on Market opportunity by End-user ($ million)
10 Market Segmentation by Type
- 10.1 Market segments
- Chart on Type - Market share 2024-2029 (%)
- Data Table on Type - Market share 2024-2029 (%)
- 10.2 Comparison by Type
- Chart on Comparison by Type
- Data Table on Comparison by Type
- 10.3 Mounted bearing - Market size and forecast 2024-2029
- Chart on Mounted bearing - Market size and forecast 2024-2029 ($ million)
- Data Table on Mounted bearing - Market size and forecast 2024-2029 ($ million)
- Chart on Mounted bearing - Year-over-year growth 2024-2029 (%)
- Data Table on Mounted bearing - Year-over-year growth 2024-2029 (%)
- 10.4 Unmounted bearing - Market size and forecast 2024-2029
- Chart on Unmounted bearing - Market size and forecast 2024-2029 ($ million)
- Data Table on Unmounted bearing - Market size and forecast 2024-2029 ($ million)
- Chart on Unmounted bearing - Year-over-year growth 2024-2029 (%)
- Data Table on Unmounted bearing - Year-over-year growth 2024-2029 (%)
- 10.5 Market opportunity by Type
- Market opportunity by Type ($ million)
- Data Table on Market opportunity by Type ($ million)
11 Market Segmentation by Distribution Channel
- 11.1 Market segments
- Chart on Distribution Channel - Market share 2024-2029 (%)
- Data Table on Distribution Channel - Market share 2024-2029 (%)
- 11.2 Comparison by Distribution Channel
- Chart on Comparison by Distribution Channel
- Data Table on Comparison by Distribution Channel
- 11.3 OEM - Market size and forecast 2024-2029
- Chart on OEM - Market size and forecast 2024-2029 ($ million)
- Data Table on OEM - Market size and forecast 2024-2029 ($ million)
- Chart on OEM - Year-over-year growth 2024-2029 (%)
- Data Table on OEM - Year-over-year growth 2024-2029 (%)
- 11.4 Aftermarket - Market size and forecast 2024-2029
- Chart on Aftermarket - Market size and forecast 2024-2029 ($ million)
- Data Table on Aftermarket - Market size and forecast 2024-2029 ($ million)
- Chart on Aftermarket - Year-over-year growth 2024-2029 (%)
- Data Table on Aftermarket - Year-over-year growth 2024-2029 (%)
- 11.5 Market opportunity by Distribution Channel
- Market opportunity by Distribution Channel ($ million)
- Data Table on Market opportunity by Distribution Channel ($ million)
12 Market Segmentation by Measurement
- 12.1 Market segments
- Chart on Measurement - Market share 2024-2029 (%)
- Data Table on Measurement - Market share 2024-2029 (%)
- 12.2 Comparison by Measurement
- Chart on Comparison by Measurement
- Data Table on Comparison by Measurement
- 30 to 40 - Market size and forecast 2024-2029
- Chart on 30 to 40 - Market size and forecast 2024-2029 ($ million)
- Data Table on 30 to 40 - Market size and forecast 2024-2029 ($ million)
- Chart on 30 to 40 - Year-over-year growth 2024-2029 (%)
- Data Table on 30 to 40 - Year-over-year growth 2024-2029 (%)
- 41 to 50 - Market size and forecast 2024-2029
- Chart on 41 to 50 - Market size and forecast 2024-2029 ($ million)
- Data Table on 41 to 50 - Market size and forecast 2024-2029 ($ million)
- Chart on 41 to 50 - Year-over-year growth 2024-2029 (%)
- Data Table on 41 to 50 - Year-over-year growth 2024-2029 (%)
- 51 to 60 - Market size and forecast 2024-2029
- Chart on 51 to 60 - Market size and forecast 2024-2029 ($ million)
- Data Table on 51 to 60 - Market size and forecast 2024-2029 ($ million)
- Chart on 51 to 60 - Year-over-year growth 2024-2029 (%)
- Data Table on 51 to 60 - Year-over-year growth 2024-2029 (%)
- 61 to 70 - Market size and forecast 2024-2029
- Chart on 61 to 70 - Market size and forecast 2024-2029 ($ million)
- Data Table on 61 to 70 - Market size and forecast 2024-2029 ($ million)
- Chart on 61 to 70 - Year-over-year growth 2024-2029 (%)
- Data Table on 61 to 70 - Year-over-year growth 2024-2029 (%)
- 70 and above - Market size and forecast 2024-2029
- Chart on 70 and above - Market size and forecast 2024-2029 ($ million)
- Data Table on 70 and above - Market size and forecast 2024-2029 ($ million)
- Chart on 70 and above - Year-over-year growth 2024-2029 (%)
- Data Table on 70 and above - Year-over-year growth 2024-2029 (%)
- 12.8 Market opportunity by Measurement
- Market opportunity by Measurement ($ million)
- Data Table on Market opportunity by Measurement ($ million)
13 Customer Landscape
- 13.1 Customer landscape overview
- Analysis of price sensitivity, lifecycle, customer purchase basket, adoption rates, and purchase criteria
14 Geographic Landscape
- 14.1 Geographic segmentation
- Chart on Market share By Geographical Landscape 2024-2029 (%)
- Data Table on Market share By Geographical Landscape 2024-2029 (%)
- 14.2 Geographic comparison
- Chart on Geographic comparison
- Data Table on Geographic comparison
- 14.3 APAC - Market size and forecast 2024-2029
- Chart on APAC - Market size and forecast 2024-2029 ($ million)
- Data Table on APAC - Market size and forecast 2024-2029 ($ million)
- Chart on APAC - Year-over-year growth 2024-2029 (%)
- Data Table on APAC - Year-over-year growth 2024-2029 (%)
- 14.4 Europe - Market size and forecast 2024-2029
- Chart on Europe - Market size and forecast 2024-2029 ($ million)
- Data Table on Europe - Market size and forecast 2024-2029 ($ million)
- Chart on Europe - Year-over-year growth 2024-2029 (%)
- Data Table on Europe - Year-over-year growth 2024-2029 (%)
- 14.5 North America - Market size and forecast 2024-2029
- Chart on North America - Market size and forecast 2024-2029 ($ million)
- Data Table on North America - Market size and forecast 2024-2029 ($ million)
- Chart on North America - Year-over-year growth 2024-2029 (%)
- Data Table on North America - Year-over-year growth 2024-2029 (%)
- 14.6 South America - Market size and forecast 2024-2029
- Chart on South America - Market size and forecast 2024-2029 ($ million)
- Data Table on South America - Market size and forecast 2024-2029 ($ million)
- Chart on South America - Year-over-year growth 2024-2029 (%)
- Data Table on South America - Year-over-year growth 2024-2029 (%)
- 14.7 Middle East and Africa - Market size and forecast 2024-2029
- Chart on Middle East and Africa - Market size and forecast 2024-2029 ($ million)
- Data Table on Middle East and Africa - Market size and forecast 2024-2029 ($ million)
- Chart on Middle East and Africa - Year-over-year growth 2024-2029 (%)
- Data Table on Middle East and Africa - Year-over-year growth 2024-2029 (%)
- 14.8 US - Market size and forecast 2024-2029
- Chart on US - Market size and forecast 2024-2029 ($ million)
- Data Table on US - Market size and forecast 2024-2029 ($ million)
- Chart on US - Year-over-year growth 2024-2029 (%)
- Data Table on US - Year-over-year growth 2024-2029 (%)
- 14.9 China - Market size and forecast 2024-2029
- Chart on China - Market size and forecast 2024-2029 ($ million)
- Data Table on China - Market size and forecast 2024-2029 ($ million)
- Chart on China - Year-over-year growth 2024-2029 (%)
- Data Table on China - Year-over-year growth 2024-2029 (%)
- 14.10 Germany - Market size and forecast 2024-2029
- Chart on Germany - Market size and forecast 2024-2029 ($ million)
- Data Table on Germany - Market size and forecast 2024-2029 ($ million)
- Chart on Germany - Year-over-year growth 2024-2029 (%)
- Data Table on Germany - Year-over-year growth 2024-2029 (%)
- 14.11 Japan - Market size and forecast 2024-2029
- Chart on Japan - Market size and forecast 2024-2029 ($ million)
- Data Table on Japan - Market size and forecast 2024-2029 ($ million)
- Chart on Japan - Year-over-year growth 2024-2029 (%)
- Data Table on Japan - Year-over-year growth 2024-2029 (%)
- 14.12 India - Market size and forecast 2024-2029
- Chart on India - Market size and forecast 2024-2029 ($ million)
- Data Table on India - Market size and forecast 2024-2029 ($ million)
- Chart on India - Year-over-year growth 2024-2029 (%)
- Data Table on India - Year-over-year growth 2024-2029 (%)
- 14.13 UK - Market size and forecast 2024-2029
- Chart on UK - Market size and forecast 2024-2029 ($ million)
- Data Table on UK - Market size and forecast 2024-2029 ($ million)
- Chart on UK - Year-over-year growth 2024-2029 (%)
- Data Table on UK - Year-over-year growth 2024-2029 (%)
- 14.14 South Korea - Market size and forecast 2024-2029
- Chart on South Korea - Market size and forecast 2024-2029 ($ million)
- Data Table on South Korea - Market size and forecast 2024-2029 ($ million)
- Chart on South Korea - Year-over-year growth 2024-2029 (%)
- Data Table on South Korea - Year-over-year growth 2024-2029 (%)
- 14.15 Canada - Market size and forecast 2024-2029
- Chart on Canada - Market size and forecast 2024-2029 ($ million)
- Data Table on Canada - Market size and forecast 2024-2029 ($ million)
- Chart on Canada - Year-over-year growth 2024-2029 (%)
- Data Table on Canada - Year-over-year growth 2024-2029 (%)
- 14.16 France - Market size and forecast 2024-2029
- Chart on France - Market size and forecast 2024-2029 ($ million)
- Data Table on France - Market size and forecast 2024-2029 ($ million)
- Chart on France - Year-over-year growth 2024-2029 (%)
- Data Table on France - Year-over-year growth 2024-2029 (%)
- 14.17 Italy - Market size and forecast 2024-2029
- Chart on Italy - Market size and forecast 2024-2029 ($ million)
- Data Table on Italy - Market size and forecast 2024-2029 ($ million)
- Chart on Italy - Year-over-year growth 2024-2029 (%)
- Data Table on Italy - Year-over-year growth 2024-2029 (%)
- 14.18 Market opportunity By Geographical Landscape
- Market opportunity By Geographical Landscape ($ million)
- Data Tables on Market opportunity By Geographical Landscape ($ million)
15 Drivers, Challenges, and Opportunity/Restraints
- 15.1 Market drivers
- 15.2 Market challenges
- 15.3 Impact of drivers and challenges
- Impact of drivers and challenges in 2024 and 2029
- 15.4 Market opportunities/restraints
16 Competitive Landscape
- 16.1 Overview
- 16.2 Competitive Landscape
- Overview on criticality of inputs and factors of differentiation
- 16.3 Landscape disruption
- Overview on factors of disruption
- 16.4 Industry risks
- Impact of key risks on business
17 Competitive Analysis
- 17.1 Companies profiled
- Companies covered
- 17.2 Company ranking index
- Company ranking index
- 17.3 Market positioning of companies
- Matrix on companies position and classification
- 17.4 AB SKF
- AB SKF - Overview
- AB SKF - Business segments
- AB SKF - Key news
- AB SKF - Key offerings
- AB SKF - Segment focus
- SWOT
- 17.5 ASAHI SEIKO Co. Ltd.
- ASAHI SEIKO Co. Ltd. - Overview
- ASAHI SEIKO Co. Ltd. - Product / Service
- ASAHI SEIKO Co. Ltd. - Key offerings
- SWOT
- 17.6 C and U Group
- C and U Group - Overview
- C and U Group - Product / Service
- C and U Group - Key offerings
- SWOT
- 17.7 Grupo NBI
- Grupo NBI - Overview
- Grupo NBI - Product / Service
- Grupo NBI - Key offerings
- SWOT
- 17.8 HKT BEARINGS Ltd.
- HKT BEARINGS Ltd. - Overview
- HKT BEARINGS Ltd. - Product / Service
- HKT BEARINGS Ltd. - Key offerings
- SWOT
- 17.9 JTEKT Corp.
- JTEKT Corp. - Overview
- JTEKT Corp. - Business segments
- JTEKT Corp. - Key news
- JTEKT Corp. - Key offerings
- JTEKT Corp. - Segment focus
- SWOT
- 17.10 Luoyang JCB Bearing Technology Co. Ltd.
- Luoyang JCB Bearing Technology Co. Ltd. - Overview
- Luoyang JCB Bearing Technology Co. Ltd. - Product / Service
- Luoyang JCB Bearing Technology Co. Ltd. - Key offerings
- SWOT
- 17.11 LYC Bearing Corp.
- LYC Bearing Corp. - Overview
- LYC Bearing Corp. - Product / Service
- LYC Bearing Corp. - Key offerings
- SWOT
- 17.12 MinebeaMitsumi Inc.
- MinebeaMitsumi Inc. - Overview
- MinebeaMitsumi Inc. - Business segments
- MinebeaMitsumi Inc. - Key offerings
- MinebeaMitsumi Inc. - Segment focus
- SWOT
- 17.13 NACHI FUJIKOSHI Corp.
- NACHI FUJIKOSHI Corp. - Overview
- NACHI FUJIKOSHI Corp. - Business segments
- NACHI FUJIKOSHI Corp. - Key news
- NACHI FUJIKOSHI Corp. - Key offerings
- NACHI FUJIKOSHI Corp. - Segment focus
- SWOT
- 17.14 NSK Ltd.
- NSK Ltd. - Overview
- NSK Ltd. - Product / Service
- NSK Ltd. - Key news
- NSK Ltd. - Key offerings
- SWOT
- 17.15 NTN Corp.
- NTN Corp. - Overview
- NTN Corp. - Business segments
- NTN Corp. - Key offerings
- NTN Corp. - Segment focus
- SWOT
- 17.16 RBC Bearings Inc.
- RBC Bearings Inc. - Overview
- RBC Bearings Inc. - Business segments
- RBC Bearings Inc. - Key offerings
- RBC Bearings Inc. - Segment focus
- SWOT
- 17.17 Regal Rexnord Corp.
- Regal Rexnord Corp. - Overview
- Regal Rexnord Corp. - Business segments
- Regal Rexnord Corp. - Key news
- Regal Rexnord Corp. - Key offerings
- Regal Rexnord Corp. - Segment focus
- SWOT
- 17.18 Schaeffler AG
- Schaeffler AG - Overview
- Schaeffler AG - Business segments
- Schaeffler AG - Key news
- Schaeffler AG - Key offerings
- Schaeffler AG - Segment focus
- SWOT
18 Appendix
- 18.1 Scope of the report
- 18.2 Inclusions and exclusions checklist
- Inclusions checklist
- Exclusions checklist
- 18.3 Currency conversion rates for US$
- Currency conversion rates for US$
- 18.4 Research methodology
- Research methodology
- 18.5 Data procurement
- Information sources
- 18.6 Data validation
- Data validation
- 18.7 Validation techniques employed for market sizing
- Validation techniques employed for market sizing
- 18.8 Data synthesis
- Data synthesis
- 18.9 360 degree market analysis
- 360 degree market analysis
- 18.10 List of abbreviations
- List of abbreviations

