|
|
市場調査レポート
商品コード
1453833
デンプンの世界市場 2024-2028Global Starch Market 2024-2028 |
||||||
|
|||||||
カスタマイズ可能
|
|||||||

| デンプンの世界市場 2024-2028 |
|
出版日: 2024年03月07日
発行: TechNavio
ページ情報: 英文 178 Pages
納期: 即納可能
|

全表示
- 概要
- 図表
- 目次
デンプン市場は2023-2028年に184億1,000万米ドル、予測期間中のCAGRは4.49%で成長すると予測されます。
当レポートでは、デンプン市場の全体的な分析、市場規模・予測、動向、成長促進要因、課題、約25のベンダーを網羅したベンダー分析などを掲載しています。
現在の市場シナリオ、最新動向と促進要因、市場環境全体に関する最新分析を提供しています。トウモロコシデンプンの費用対効果による高い需要、注目市場のベンダーによる新製品の発売、ベーカリーや甘い食品の生産におけるデンプンの需要増加などが市場を牽引しています。
| 市場範囲 | |
|---|---|
| 基準年 | 2024 |
| 終了年 | 2028 |
| 予測期間 | 2024-2028 |
| 成長モメンタム | 加速 |
| 前年比2024年 | 4.31% |
| CAGR | 4.49% |
| 増分額 | 184億1,000万米ドル |
本調査では、今後数年間におけるデンプン市場の成長を促進する主な要因の一つとして、市場のベンダーとバイヤー間の強力な流通網を挙げています。また、デンプンの生産工場の拡大や、eコマースプラットフォームにおけるデンプン製品の利用可能性の増加が、市場の大きな需要につながると思われます。
目次
第1章 エグゼクティブサマリー
- 市場概要
第2章 市場情勢
- 市場エコシステム
第3章 市場規模
- 市場の定義
- 市場セグメント分析
- 市場規模 2023
- 市場の見通し 2023-2028
第4章 市場規模実績
- デンプンの世界市場 2018-2022
- タイプセグメント分析 2018-2022
- エンドユーザーセグメント分析 2018-2022
- 地域別セグメント分析 2018-2022
- 国別セグメント分析 2018-2022
- デンプンの世界市場:国別2023-2028
第5章 ファイブフォース分析
- ファイブフォースの要約
- 買い手の交渉力
- 供給企業の交渉力
- 新規参入業者の脅威
- 代替品の脅威
- 競争の脅威
- 市況
第6章 市場セグメンテーション:タイプ別
- 市場セグメント
- 比較:タイプ別
- トウモロコシ:市場規模と予測 2023-2028
- じゃがいも:市場規模と予測 2023-2028
- タピオカ:市場規模と予測 2023-2028
- 小麦:市場規模と予測 2023-2028
- その他:市場規模と予測 2023-2028
- 市場機会:タイプ別
第7章 市場セグメンテーション:エンドユーザー別
- 市場セグメント
- 比較:エンドユーザー別
- 小売り:市場規模と予測 2023-2028
- 業界(B2B):市場規模と予測 2023-2028
- 動物の飼料:市場規模と予測 2023-2028
- 市場機会:エンドユーザー別
第8章 顧客情勢
- 顧客情勢の概要
第9章 地域別情勢
- 地域別セグメンテーション
- 地域別比較
- アジア太平洋:市場規模と予測 2023-2028
- 北米:市場規模と予測 2023-2028
- 欧州:市場規模と予測 2023-2028
- 南米:市場規模と予測 2023-2028
- 中東・アフリカ:市場規模と予測 2023-2028
- 中国:市場規模と予測 2023-2028
- 米国:市場規模と予測 2023-2028
- フランス:市場規模と予測 2023-2028
- ドイツ:市場規模と予測 2023-2028
- インド:市場規模と予測 2023-2028
- 市場機会:地域情勢別
第10章 促進要因、課題、および動向
- 市場促進要因
- 市場の課題
- 促進要因と課題の影響
- 市場動向
第11章 ベンダー情勢
- 概要
- ベンダー情勢
- 混乱の状況
- 業界のリスク
第12章 ベンダー分析
- 対象ベンダー
- ベンダーの市場ポジショニング
- AGRANA Beteiligungs AG
- Archer Daniels Midland Co.
- Beneo GmbH
- Cargill Inc.
- Emsland Starke GmbH
- Ingredion Inc.
- Kent Corp.
- Manildra Flour Mills Pty. Ltd.
- MGP Ingredients Inc.
- Roquette Freres SA
- Royal Avebe
- SMScor
- Tate and Lyle PLC
- Thai Flour Industry Co. Ltd.
- VIMAL PPCE
第13章 付録
Exhibits:
- Exhibits1: Executive Summary - Chart on Market Overview
- Exhibits2: Executive Summary - Data Table on Market Overview
- Exhibits3: Executive Summary - Chart on Global Market Characteristics
- Exhibits4: Executive Summary - Chart on Market By Geographical Landscape
- Exhibits5: Executive Summary - Chart on Market Segmentation by Type
- Exhibits6: Executive Summary - Chart on Market Segmentation by End-user
- Exhibits7: Executive Summary - Chart on Incremental Growth
- Exhibits8: Executive Summary - Data Table on Incremental Growth
- Exhibits9: Executive Summary - Chart on Vendor Market Positioning
- Exhibits10: Parent market
- Exhibits11: Market Characteristics
- Exhibits12: Offerings of vendors included in the market definition
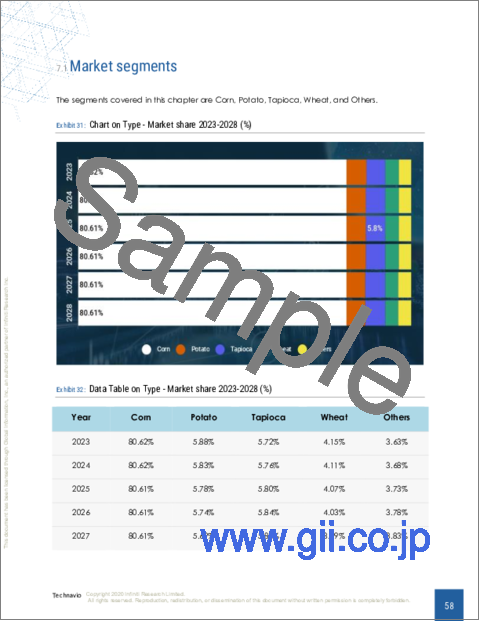
- Exhibits13: Market segments
- Exhibits14: Chart on Global - Market size and forecast 2023-2028 ($ billion)
- Exhibits15: Data Table on Global - Market size and forecast 2023-2028 ($ billion)
- Exhibits16: Chart on Global Market: Year-over-year growth 2023-2028 (%)
- Exhibits17: Data Table on Global Market: Year-over-year growth 2023-2028 (%)
- Exhibits18: Historic Market Size - Data Table on global starch market 2018 - 2022 ($ billion)
- Exhibits19: Historic Market Size - Type Segment 2018 - 2022 ($ billion)
- Exhibits20: Historic Market Size - End-user Segment 2018 - 2022 ($ billion)
- Exhibits21: Historic Market Size - Geography Segment 2018 - 2022 ($ billion)
- Exhibits22: Historic Market Size - Country Segment 2018 - 2022 ($ billion)
- Exhibits23: Market Size (value) - Data Table on Global starch market by Country 2023 - 2028 ($ billion)
- Exhibits24: Five forces analysis - Comparison between 2023 and 2028
- Exhibits25: Chart on Bargaining power of buyers - Impact of key factors 2023 and 2028
- Exhibits26: Bargaining power of suppliers - Impact of key factors in 2023 and 2028
- Exhibits27: Threat of new entrants - Impact of key factors in 2023 and 2028
- Exhibits28: Threat of substitutes - Impact of key factors in 2023 and 2028
- Exhibits29: Threat of rivalry - Impact of key factors in 2023 and 2028
- Exhibits30: Chart on Market condition - Five forces 2023 and 2028
- Exhibits31: Chart on Type - Market share 2023-2028 (%)
- Exhibits32: Data Table on Type - Market share 2023-2028 (%)
- Exhibits33: Chart on Comparison by Type
- Exhibits34: Data Table on Comparison by Type
- Exhibits35: Chart on Corn - Market size and forecast 2023-2028 ($ billion)
- Exhibits36: Data Table on Corn - Market size and forecast 2023-2028 ($ billion)
- Exhibits37: Chart on Corn - Year-over-year growth 2023-2028 (%)
- Exhibits38: Data Table on Corn - Year-over-year growth 2023-2028 (%)
- Exhibits39: Chart on Potato - Market size and forecast 2023-2028 ($ billion)
- Exhibits40: Data Table on Potato - Market size and forecast 2023-2028 ($ billion)
- Exhibits41: Chart on Potato - Year-over-year growth 2023-2028 (%)
- Exhibits42: Data Table on Potato - Year-over-year growth 2023-2028 (%)
- Exhibits43: Chart on Tapioca - Market size and forecast 2023-2028 ($ billion)
- Exhibits44: Data Table on Tapioca - Market size and forecast 2023-2028 ($ billion)
- Exhibits45: Chart on Tapioca - Year-over-year growth 2023-2028 (%)
- Exhibits46: Data Table on Tapioca - Year-over-year growth 2023-2028 (%)
- Exhibits47: Chart on Wheat - Market size and forecast 2023-2028 ($ billion)
- Exhibits48: Data Table on Wheat - Market size and forecast 2023-2028 ($ billion)
- Exhibits49: Chart on Wheat - Year-over-year growth 2023-2028 (%)
- Exhibits50: Data Table on Wheat - Year-over-year growth 2023-2028 (%)
- Exhibits51: Chart on Others - Market size and forecast 2023-2028 ($ billion)
- Exhibits52: Data Table on Others - Market size and forecast 2023-2028 ($ billion)
- Exhibits53: Chart on Others - Year-over-year growth 2023-2028 (%)
- Exhibits54: Data Table on Others - Year-over-year growth 2023-2028 (%)
- Exhibits55: Market opportunity by Type ($ billion)
- Exhibits56: Data Table on Market opportunity by Type ($ billion)
- Exhibits57: Chart on End-user - Market share 2023-2028 (%)
- Exhibits58: Data Table on End-user - Market share 2023-2028 (%)
- Exhibits59: Chart on Comparison by End-user
- Exhibits60: Data Table on Comparison by End-user
- Exhibits61: Chart on Retail - Market size and forecast 2023-2028 ($ billion)
- Exhibits62: Data Table on Retail - Market size and forecast 2023-2028 ($ billion)
- Exhibits63: Chart on Retail - Year-over-year growth 2023-2028 (%)
- Exhibits64: Data Table on Retail - Year-over-year growth 2023-2028 (%)
- Exhibits65: Chart on Industry (B2B) - Market size and forecast 2023-2028 ($ billion)
- Exhibits66: Data Table on Industry (B2B) - Market size and forecast 2023-2028 ($ billion)
- Exhibits67: Chart on Industry (B2B) - Year-over-year growth 2023-2028 (%)
- Exhibits68: Data Table on Industry (B2B) - Year-over-year growth 2023-2028 (%)
- Exhibits69: Chart on Animal feed - Market size and forecast 2023-2028 ($ billion)
- Exhibits70: Data Table on Animal feed - Market size and forecast 2023-2028 ($ billion)
- Exhibits71: Chart on Animal feed - Year-over-year growth 2023-2028 (%)
- Exhibits72: Data Table on Animal feed - Year-over-year growth 2023-2028 (%)
- Exhibits73: Market opportunity by End-user ($ billion)
- Exhibits74: Data Table on Market opportunity by End-user ($ billion)
- Exhibits75: Analysis of price sensitivity, lifecycle, customer purchase basket, adoption rates, and purchase criteria
- Exhibits76: Chart on Market share By Geographical Landscape 2023-2028 (%)
- Exhibits77: Data Table on Market share By Geographical Landscape 2023-2028 (%)
- Exhibits78: Chart on Geographic comparison
- Exhibits79: Data Table on Geographic comparison
- Exhibits80: Chart on APAC - Market size and forecast 2023-2028 ($ billion)
- Exhibits81: Data Table on APAC - Market size and forecast 2023-2028 ($ billion)
- Exhibits82: Chart on APAC - Year-over-year growth 2023-2028 (%)
- Exhibits83: Data Table on APAC - Year-over-year growth 2023-2028 (%)
- Exhibits84: Chart on North America - Market size and forecast 2023-2028 ($ billion)
- Exhibits85: Data Table on North America - Market size and forecast 2023-2028 ($ billion)
- Exhibits86: Chart on North America - Year-over-year growth 2023-2028 (%)
- Exhibits87: Data Table on North America - Year-over-year growth 2023-2028 (%)
- Exhibits88: Chart on Europe - Market size and forecast 2023-2028 ($ billion)
- Exhibits89: Data Table on Europe - Market size and forecast 2023-2028 ($ billion)
- Exhibits90: Chart on Europe - Year-over-year growth 2023-2028 (%)
- Exhibits91: Data Table on Europe - Year-over-year growth 2023-2028 (%)
- Exhibits92: Chart on South America - Market size and forecast 2023-2028 ($ billion)
- Exhibits93: Data Table on South America - Market size and forecast 2023-2028 ($ billion)
- Exhibits94: Chart on South America - Year-over-year growth 2023-2028 (%)
- Exhibits95: Data Table on South America - Year-over-year growth 2023-2028 (%)
- Exhibits96: Chart on Middle East and Africa - Market size and forecast 2023-2028 ($ billion)
- Exhibits97: Data Table on Middle East and Africa - Market size and forecast 2023-2028 ($ billion)
- Exhibits98: Chart on Middle East and Africa - Year-over-year growth 2023-2028 (%)
- Exhibits99: Data Table on Middle East and Africa - Year-over-year growth 2023-2028 (%)
- Exhibits100: Chart on China - Market size and forecast 2023-2028 ($ billion)
- Exhibits101: Data Table on China - Market size and forecast 2023-2028 ($ billion)
- Exhibits102: Chart on China - Year-over-year growth 2023-2028 (%)
- Exhibits103: Data Table on China - Year-over-year growth 2023-2028 (%)
- Exhibits104: Chart on US - Market size and forecast 2023-2028 ($ billion)
- Exhibits105: Data Table on US - Market size and forecast 2023-2028 ($ billion)
- Exhibits106: Chart on US - Year-over-year growth 2023-2028 (%)
- Exhibits107: Data Table on US - Year-over-year growth 2023-2028 (%)
- Exhibits108: Chart on France - Market size and forecast 2023-2028 ($ billion)
- Exhibits109: Data Table on France - Market size and forecast 2023-2028 ($ billion)
- Exhibits110: Chart on France - Year-over-year growth 2023-2028 (%)
- Exhibits111: Data Table on France - Year-over-year growth 2023-2028 (%)
- Exhibits112: Chart on Germany - Market size and forecast 2023-2028 ($ billion)
- Exhibits113: Data Table on Germany - Market size and forecast 2023-2028 ($ billion)
- Exhibits114: Chart on Germany - Year-over-year growth 2023-2028 (%)
- Exhibits115: Data Table on Germany - Year-over-year growth 2023-2028 (%)
- Exhibits116: Chart on India - Market size and forecast 2023-2028 ($ billion)
- Exhibits117: Data Table on India - Market size and forecast 2023-2028 ($ billion)
- Exhibits118: Chart on India - Year-over-year growth 2023-2028 (%)
- Exhibits119: Data Table on India - Year-over-year growth 2023-2028 (%)
- Exhibits120: Market opportunity By Geographical Landscape ($ billion)
- Exhibits121: Data Tables on Market opportunity By Geographical Landscape ($ billion)
- Exhibits122: Impact of drivers and challenges in 2023 and 2028
- Exhibits123: Overview on Criticality of inputs and Factors of differentiation
- Exhibits124: Overview on factors of disruption
- Exhibits125: Impact of key risks on business
- Exhibits126: Vendors covered
- Exhibits127: Matrix on vendor position and classification
- Exhibits128: AGRANA Beteiligungs AG - Overview
- Exhibits129: AGRANA Beteiligungs AG - Business segments
- Exhibits130: AGRANA Beteiligungs AG - Key offerings
- Exhibits131: AGRANA Beteiligungs AG - Segment focus
- Exhibits132: Archer Daniels Midland Co. - Overview
- Exhibits133: Archer Daniels Midland Co. - Business segments
- Exhibits134: Archer Daniels Midland Co. - Key news
- Exhibits135: Archer Daniels Midland Co. - Key offerings
- Exhibits136: Archer Daniels Midland Co. - Segment focus
- Exhibits137: Beneo GmbH - Overview
- Exhibits138: Beneo GmbH - Product / Service
- Exhibits139: Beneo GmbH - Key offerings
- Exhibits140: Cargill Inc. - Overview
- Exhibits141: Cargill Inc. - Product / Service
- Exhibits142: Cargill Inc. - Key news
- Exhibits143: Cargill Inc. - Key offerings
- Exhibits144: Emsland Starke GmbH - Overview
- Exhibits145: Emsland Starke GmbH - Product / Service
- Exhibits146: Emsland Starke GmbH - Key offerings
- Exhibits147: Ingredion Inc. - Overview
- Exhibits148: Ingredion Inc. - Business segments
- Exhibits149: Ingredion Inc. - Key offerings
- Exhibits150: Ingredion Inc. - Segment focus
- Exhibits151: Kent Corp. - Overview
- Exhibits152: Kent Corp. - Product / Service
- Exhibits153: Kent Corp. - Key offerings
- Exhibits154: Manildra Flour Mills Pty. Ltd. - Overview
- Exhibits155: Manildra Flour Mills Pty. Ltd. - Product / Service
- Exhibits156: Manildra Flour Mills Pty. Ltd. - Key offerings
- Exhibits157: MGP Ingredients Inc. - Overview
- Exhibits158: MGP Ingredients Inc. - Product / Service
- Exhibits159: MGP Ingredients Inc. - Key offerings
- Exhibits160: Roquette Freres SA - Overview
- Exhibits161: Roquette Freres SA - Product / Service
- Exhibits162: Roquette Freres SA - Key offerings
- Exhibits163: Royal Avebe - Overview
- Exhibits164: Royal Avebe - Product / Service
- Exhibits165: Royal Avebe - Key offerings
- Exhibits166: SMScor - Overview
- Exhibits167: SMScor - Product / Service
- Exhibits168: SMScor - Key offerings
- Exhibits169: Tate and Lyle PLC - Overview
- Exhibits170: Tate and Lyle PLC - Business segments
- Exhibits171: Tate and Lyle PLC - Key offerings
- Exhibits172: Tate and Lyle PLC - Segment focus
- Exhibits173: Thai Flour Industry Co. Ltd. - Overview
- Exhibits174: Thai Flour Industry Co. Ltd. - Product / Service
- Exhibits175: Thai Flour Industry Co. Ltd. - Key offerings
- Exhibits176: VIMAL PPCE - Overview
- Exhibits177: VIMAL PPCE - Product / Service
- Exhibits178: VIMAL PPCE - Key offerings
- Exhibits179: Inclusions checklist
- Exhibits180: Exclusions checklist
- Exhibits181: Currency conversion rates for US$
- Exhibits182: Research methodology
- Exhibits183: Validation techniques employed for market sizing
- Exhibits184: Information sources
- Exhibits185: List of abbreviations
The starch market is forecasted to grow by USD 18.41 bn during 2023-2028, accelerating at a CAGR of 4.49% during the forecast period. The report on the starch market provides a holistic analysis, market size and forecast, trends, growth drivers, and challenges, as well as vendor analysis covering around 25 vendors.
The report offers an up-to-date analysis regarding the current market scenario, the latest trends and drivers, and the overall market environment. The market is driven by high demand for corn starch due to its cost-efficiency, new product launches by vendors of market in focus, and increasing demand for starch in production of bakery and sweet food items.
Technavio's starch market is segmented as below:
| Market Scope | |
|---|---|
| Base Year | 2024 |
| End Year | 2028 |
| Series Year | 2024-2028 |
| Growth Momentum | Accelerate |
| YOY 2024 | 4.31% |
| CAGR | 4.49% |
| Incremental Value | $18.41bn |
By Type
- Corn
- Potato
- Tapioca
- Wheat
- Others
By End-user
- Retail
- Industry (B2B)
- Animal feed
By Geographical Landscape
- APAC
- North America
- Europe
- South America
- Middle East and Africa
This study identifies the strong distribution network between market vendors and buyers as one of the prime reasons driving the starch market growth during the next few years. Also, expansion of starch production plants and increased availability of starch products in e-commerce platforms will lead to sizable demand in the market.
The report on the starch market covers the following areas:
- Starch market sizing
- Starch market forecast
- Starch market industry analysis
The robust vendor analysis is designed to help clients improve their market position, and in line with this, this report provides a detailed analysis of several leading starch market vendors that include AGRANA Beteiligungs AG, Angel Starch and Food Pvt. Ltd., Archer Daniels Midland Co., Beneo GmbH, Cargill Inc., Emsland Starke GmbH, Everest Starch India Pvt. Ltd., Ingredion Inc., Kent Corp., Manildra Flour Mills Pty. Ltd., MGP Ingredients Inc., Roquette Freres SA, Royal Avebe, SPAC Starch Products India Pvt. Ltd., SSPL, Tate and Lyle PLC, Thai Flour Industry Co. Ltd., Varalakshmi Starch Industries P Ltd., VIMAL PPCE, and SMScor. Also, the starch market analysis report includes information on upcoming trends and challenges that will influence market growth. This is to help companies strategize and leverage all forthcoming growth opportunities.
The study was conducted using an objective combination of primary and secondary information including inputs from key participants in the industry. The report contains a comprehensive market and vendor landscape in addition to an analysis of the key vendors.
The publisher presents a detailed picture of the market by the way of study, synthesis, and summation of data from multiple sources by an analysis of key parameters such as profit, pricing, competition, and promotions. It presents various market facets by identifying the key industry influencers. The data presented is comprehensive, reliable, and a result of extensive research - both primary and secondary. The market research reports provide a complete competitive landscape and an in-depth vendor selection methodology and analysis using qualitative and quantitative research to forecast the accurate market growth.
Table of Contents
1 Executive Summary
- 1.1 Market overview
2 Market Landscape
- 2.1 Market ecosystem
3 Market Sizing
- 3.1 Market definition
- 3.2 Market segment analysis
- 3.3 Market size 2023
- 3.4 Market outlook: Forecast for 2023-2028
4 Historic Market Size
- 4.1 Global starch market 2018 - 2022
- 4.2 Type Segment Analysis 2018 - 2022
- 4.3 End-user Segment Analysis 2018 - 2022
- 4.4 Geography Segment Analysis 2018 - 2022
- 4.5 Country Segment Analysis 2018 - 2022
- 4.6 Global starch market by Country 2023 - 2028
5 Five Forces Analysis
- 5.1 Five forces summary
- 5.2 Bargaining power of buyers
- 5.3 Bargaining power of suppliers
- 5.4 Threat of new entrants
- 5.5 Threat of substitutes
- 5.6 Threat of rivalry
- 5.7 Market condition
6 Market Segmentation by Type
- 6.1 Market segments
- 6.2 Comparison by Type
- 6.3 Corn - Market size and forecast 2023-2028
- 6.4 Potato - Market size and forecast 2023-2028
- 6.5 Tapioca - Market size and forecast 2023-2028
- 6.6 Wheat - Market size and forecast 2023-2028
- 6.7 Others - Market size and forecast 2023-2028
- 6.8 Market opportunity by Type
7 Market Segmentation by End-user
- 7.1 Market segments
- 7.2 Comparison by End-user
- 7.3 Retail - Market size and forecast 2023-2028
- 7.4 Industry (B2B) - Market size and forecast 2023-2028
- 7.5 Animal feed - Market size and forecast 2023-2028
- 7.6 Market opportunity by End-user
8 Customer Landscape
- 8.1 Customer landscape overview
9 Geographic Landscape
- 9.1 Geographic segmentation
- 9.2 Geographic comparison
- 9.3 APAC - Market size and forecast 2023-2028
- 9.4 North America - Market size and forecast 2023-2028
- 9.5 Europe - Market size and forecast 2023-2028
- 9.6 South America - Market size and forecast 2023-2028
- 9.7 Middle East and Africa - Market size and forecast 2023-2028
- 9.8 China - Market size and forecast 2023-2028
- 9.9 US - Market size and forecast 2023-2028
- 9.10 France - Market size and forecast 2023-2028
- 9.11 Germany - Market size and forecast 2023-2028
- 9.12 India - Market size and forecast 2023-2028
- 9.13 Market opportunity By Geographical Landscape
10 Drivers, Challenges, and Trends
- 10.1 Market drivers
- 10.2 Market challenges
- 10.3 Impact of drivers and challenges
- 10.4 Market trends
11 Vendor Landscape
- 11.1 Overview
- 11.2 Vendor landscape
- 11.3 Landscape disruption
- 11.4 Industry risks
12 Vendor Analysis
- 12.1 Vendors covered
- 12.2 Market positioning of vendors
- 12.3 AGRANA Beteiligungs AG
- 12.4 Archer Daniels Midland Co.
- 12.5 Beneo GmbH
- 12.6 Cargill Inc.
- 12.7 Emsland Starke GmbH
- 12.8 Ingredion Inc.
- 12.9 Kent Corp.
- 12.10 Manildra Flour Mills Pty. Ltd.
- 12.11 MGP Ingredients Inc.
- 12.12 Roquette Freres SA
- 12.13 Royal Avebe
- 12.14 SMScor
- 12.15 Tate and Lyle PLC
- 12.16 Thai Flour Industry Co. Ltd.
- 12.17 VIMAL PPCE
13 Appendix
- 13.1 Scope of the report
- 13.2 Inclusions and exclusions checklist
- 13.3 Currency conversion rates for US$
- 13.4 Research methodology
- 13.5 List of abbreviations

