|
|
市場調査レポート
商品コード
1234304
スパークリングジュースの世界市場 2023-2027Global Sparkling Juices Market 2023-2027 |
||||||
|
|
|||||||
|
● お客様のご希望に応じて、既存データの加工や未掲載情報(例:国別セグメント)の追加などの対応が可能です。 詳細はお問い合わせください。 |
|||||||


| スパークリングジュースの世界市場 2023-2027 |
|
出版日: 2023年03月02日
発行: TechNavio
ページ情報: 英文 175 Pages
納期: 即納可能
|
- 全表示
- 概要
- 図表
- 目次
当レポートでは、スパークリングジュース市場をモニターし、2022年から2027年にかけて9億2,029万米ドル増加する見込みで、予測期間中のCAGRは10.43%で成長すると予測しています。
当レポートでは、スパークリングジュース市場について、全体的な分析、市場規模と予測、動向、成長促進要因・課題、約25のベンダーをカバーするベンダー分析などを掲載しています。
現在の市場シナリオ、最新動向と促進要因、市場全体の環境に関する最新の分析を提供しています。市場は、従来のジュースと比較した場合のコールドプレススパークリングジュースの利点、都市化の進展と消費者のライフスタイルの変化、新製品の発売によって牽引されています。
本調査では、今後数年間におけるスパークリングジュース市場の成長を促進する主な理由の一つとして、プライベートブランド商品の台頭があることを挙げています。また、オーガニックスパークリングジュースへの需要の高まりや、機能性スパークリングジュースに関連する健康上の利点は、市場の大きな需要につながると考えられます。
目次
第1章 エグゼクティブサマリー
- 市場概要
第2章 市場情勢
- 市場エコシステム
第3章 市場規模
- 市場の定義
- 市場セグメント分析
- 市場規模 2022
- 市場の見通し:2022-2027年の予測
第4章 市場規模実績
- 世界のスパークリングジュース市場2017~2021年
- タイプセグメント分析2017-2021
- 流通チャネルセグメント分析2017-2021
- 地域セグメント分析2017-2021
- 国セグメント分析2017-2021
第5章 ファイブフォース分析
- ファイブフォースの要約
- 買い手の交渉力
- 供給企業の交渉力
- 新規参入業者の脅威
- 代替品の脅威
- 競争の脅威
- 市況
第6章 タイプ別の市場セグメンテーション
- マーケット・セグメント
- タイプ別比較
- スパークリングジュース飲料 - 市場規模と予測 2022-2027
- スパークリング100%ジュース - 市場規模と予測 2022-2027
- ネクターのスパークリングジュース - 市場規模と予測 2022-2027
- タイプ別の市場機会
第7章 流通チャネル別市場セグメンテーション
- マーケット・セグメント
- 流通チャネル別比較
- スーパーマーケットとハイパーマーケット - 市場規模と予測 2022-2027
- オントレード - 市場規模と予測 2022-2027
- 独立系小売業者 - 市場規模と予測 2022-2027
- コンビニエンスストア - 市場規模と予測 2022-2027
- その他 - 市場規模と予測 2022-2027
- 流通チャネル別の市場機会
第8章 顧客情勢
- 顧客情勢の概要
第9章 地域別情勢
- 地域別セグメンテーション
- 地域別比較
- 欧州 - 市場規模と予測 2022-2027
- 北米 - 市場規模と予測 2022-2027
- APAC - 市場規模と予測 2022-2027
- 南米 - 市場規模と予測 2022-2027
- 中東およびアフリカ - 市場規模と予測 2022-2027
- 米国 - 市場規模と予測 2022-2027
- 中国 - 市場規模と予測 2022-2027
- ドイツ - 市場規模と予測 2022-2027
- インド - 市場規模と予測 2022-2027
- 英国 - 市場規模と予測 2022-2027
- 地域別の市場機会
第10章 促進要因、課題、および動向
- 市場促進要因
- 市場の課題
- 促進要因と課題の影響
- 市場動向
第11章 ベンダー情勢
- 概要
- ベンダー情勢
- 混乱の状況
- 業界のリスク
第12章 ベンダー分析
- 対象ベンダー
- ベンダーの市場ポジショニング
- Apple and Eve LLC
- AriZona Beverages USA LLC
- Campbell Soup Co.
- Cawston Press Ltd.
- ENVASADOS EVA SA
- Juice and World
- Keurig Dr Pepper Inc.
- Kristian Regale Inc.
- Nestle SA
- Ocean Spray Cranberries Inc.
- PepsiCo Inc.
- The Coca Cola Co.
- The JM Smucker Co.
- The S. Martinelli and Company
- Welch Foods Inc.
第13章 付録
Exhibits:
- Exhibits1: Executive Summary - Chart on Market Overview
- Exhibits2: Executive Summary - Data Table on Market Overview
- Exhibits3: Executive Summary - Chart on Global Market Characteristics
- Exhibits4: Executive Summary - Chart on Market by Geography
- Exhibits5: Executive Summary - Chart on Market Segmentation by Type
- Exhibits6: Executive Summary - Chart on Market Segmentation by Distribution Channel
- Exhibits7: Executive Summary - Chart on Incremental Growth
- Exhibits8: Executive Summary - Data Table on Incremental Growth
- Exhibits9: Executive Summary - Chart on Vendor Market Positioning
- Exhibits10: Parent market
- Exhibits11: Market Characteristics
- Exhibits12: Offerings of vendors included in the market definition
- Exhibits13: Market segments
- Exhibits14: Chart on Global - Market size and forecast 2022-2027 ($ million)
- Exhibits15: Data Table on Global - Market size and forecast 2022-2027 ($ million)
- Exhibits16: Chart on Global Market: Year-over-year growth 2022-2027 (%)
- Exhibits17: Data Table on Global Market: Year-over-year growth 2022-2027 (%)
- Exhibits18: Historic Market Size - Data Table on Global sparkling juices market 2017 - 2021 ($ million)
- Exhibits19: Historic Market Size - Type Segment 2017 - 2021 ($ million)
- Exhibits20: Historic Market Size - Distribution Channel Segment 2017 - 2021 ($ million)
- Exhibits21: Historic Market Size - Geography Segment 2017 - 2021 ($ million)
- Exhibits22: Historic Market Size - Country Segment 2017 - 2021 ($ million)
- Exhibits23: Five forces analysis - Comparison between 2022 and 2027
- Exhibits24: Chart on Bargaining power of buyers - Impact of key factors 2022 and 2027
- Exhibits25: Bargaining power of suppliers - Impact of key factors in 2022 and 2027
- Exhibits26: Threat of new entrants - Impact of key factors in 2022 and 2027
- Exhibits27: Threat of substitutes - Impact of key factors in 2022 and 2027
- Exhibits28: Threat of rivalry - Impact of key factors in 2022 and 2027
- Exhibits29: Chart on Market condition - Five forces 2022 and 2027
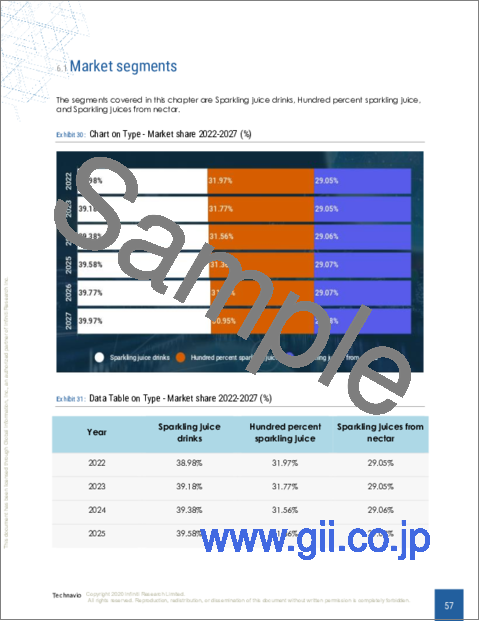
- Exhibits30: Chart on Type - Market share 2022-2027 (%)
- Exhibits31: Data Table on Type - Market share 2022-2027 (%)
- Exhibits32: Chart on Comparison by Type
- Exhibits33: Data Table on Comparison by Type
- Exhibits34: Chart on Sparkling juice drinks - Market size and forecast 2022-2027 ($ million)
- Exhibits35: Data Table on Sparkling juice drinks - Market size and forecast 2022-2027 ($ million)
- Exhibits36: Chart on Sparkling juice drinks - Year-over-year growth 2022-2027 (%)
- Exhibits37: Data Table on Sparkling juice drinks - Year-over-year growth 2022-2027 (%)
- Exhibits38: Chart on Hundred percent sparkling juice - Market size and forecast 2022-2027 ($ million)
- Exhibits39: Data Table on Hundred percent sparkling juice - Market size and forecast 2022-2027 ($ million)
- Exhibits40: Chart on Hundred percent sparkling juice - Year-over-year growth 2022-2027 (%)
- Exhibits41: Data Table on Hundred percent sparkling juice - Year-over-year growth 2022-2027 (%)
- Exhibits42: Chart on Sparkling juices from nectar - Market size and forecast 2022-2027 ($ million)
- Exhibits43: Data Table on Sparkling juices from nectar - Market size and forecast 2022-2027 ($ million)
- Exhibits44: Chart on Sparkling juices from nectar - Year-over-year growth 2022-2027 (%)
- Exhibits45: Data Table on Sparkling juices from nectar - Year-over-year growth 2022-2027 (%)
- Exhibits46: Market opportunity by Type ($ million)
- Exhibits47: Data Table on Market opportunity by Type ($ million)
- Exhibits48: Chart on Distribution Channel - Market share 2022-2027 (%)
- Exhibits49: Data Table on Distribution Channel - Market share 2022-2027 (%)
- Exhibits50: Chart on Comparison by Distribution Channel
- Exhibits51: Data Table on Comparison by Distribution Channel
- Exhibits52: Chart on Supermarkets and hypermarkets - Market size and forecast 2022-2027 ($ million)
- Exhibits53: Data Table on Supermarkets and hypermarkets - Market size and forecast 2022-2027 ($ million)
- Exhibits54: Chart on Supermarkets and hypermarkets - Year-over-year growth 2022-2027 (%)
- Exhibits55: Data Table on Supermarkets and hypermarkets - Year-over-year growth 2022-2027 (%)
- Exhibits56: Chart on On-trade - Market size and forecast 2022-2027 ($ million)
- Exhibits57: Data Table on On-trade - Market size and forecast 2022-2027 ($ million)
- Exhibits58: Chart on On-trade - Year-over-year growth 2022-2027 (%)
- Exhibits59: Data Table on On-trade - Year-over-year growth 2022-2027 (%)
- Exhibits60: Chart on Independent retailers - Market size and forecast 2022-2027 ($ million)
- Exhibits61: Data Table on Independent retailers - Market size and forecast 2022-2027 ($ million)
- Exhibits62: Chart on Independent retailers - Year-over-year growth 2022-2027 (%)
- Exhibits63: Data Table on Independent retailers - Year-over-year growth 2022-2027 (%)
- Exhibits64: Chart on Convenience stores - Market size and forecast 2022-2027 ($ million)
- Exhibits65: Data Table on Convenience stores - Market size and forecast 2022-2027 ($ million)
- Exhibits66: Chart on Convenience stores - Year-over-year growth 2022-2027 (%)
- Exhibits67: Data Table on Convenience stores - Year-over-year growth 2022-2027 (%)
- Exhibits68: Chart on Others - Market size and forecast 2022-2027 ($ million)
- Exhibits69: Data Table on Others - Market size and forecast 2022-2027 ($ million)
- Exhibits70: Chart on Others - Year-over-year growth 2022-2027 (%)
- Exhibits71: Data Table on Others - Year-over-year growth 2022-2027 (%)
- Exhibits72: Market opportunity by Distribution Channel ($ million)
- Exhibits73: Data Table on Market opportunity by Distribution Channel ($ million)
- Exhibits74: Analysis of price sensitivity, lifecycle, customer purchase basket, adoption rates, and purchase criteria
- Exhibits75: Chart on Market share by geography 2022-2027 (%)
- Exhibits76: Data Table on Market share by geography 2022-2027 (%)
- Exhibits77: Chart on Geographic comparison
- Exhibits78: Data Table on Geographic comparison
- Exhibits79: Chart on Europe - Market size and forecast 2022-2027 ($ million)
- Exhibits80: Data Table on Europe - Market size and forecast 2022-2027 ($ million)
- Exhibits81: Chart on Europe - Year-over-year growth 2022-2027 (%)
- Exhibits82: Data Table on Europe - Year-over-year growth 2022-2027 (%)
- Exhibits83: Chart on North America - Market size and forecast 2022-2027 ($ million)
- Exhibits84: Data Table on North America - Market size and forecast 2022-2027 ($ million)
- Exhibits85: Chart on North America - Year-over-year growth 2022-2027 (%)
- Exhibits86: Data Table on North America - Year-over-year growth 2022-2027 (%)
- Exhibits87: Chart on APAC - Market size and forecast 2022-2027 ($ million)
- Exhibits88: Data Table on APAC - Market size and forecast 2022-2027 ($ million)
- Exhibits89: Chart on APAC - Year-over-year growth 2022-2027 (%)
- Exhibits90: Data Table on APAC - Year-over-year growth 2022-2027 (%)
- Exhibits91: Chart on South America - Market size and forecast 2022-2027 ($ million)
- Exhibits92: Data Table on South America - Market size and forecast 2022-2027 ($ million)
- Exhibits93: Chart on South America - Year-over-year growth 2022-2027 (%)
- Exhibits94: Data Table on South America - Year-over-year growth 2022-2027 (%)
- Exhibits95: Chart on Middle East and Africa - Market size and forecast 2022-2027 ($ million)
- Exhibits96: Data Table on Middle East and Africa - Market size and forecast 2022-2027 ($ million)
- Exhibits97: Chart on Middle East and Africa - Year-over-year growth 2022-2027 (%)
- Exhibits98: Data Table on Middle East and Africa - Year-over-year growth 2022-2027 (%)
- Exhibits99: Chart on US - Market size and forecast 2022-2027 ($ million)
- Exhibits100: Data Table on US - Market size and forecast 2022-2027 ($ million)
- Exhibits101: Chart on US - Year-over-year growth 2022-2027 (%)
- Exhibits102: Data Table on US - Year-over-year growth 2022-2027 (%)
- Exhibits103: Chart on China - Market size and forecast 2022-2027 ($ million)
- Exhibits104: Data Table on China - Market size and forecast 2022-2027 ($ million)
- Exhibits105: Chart on China - Year-over-year growth 2022-2027 (%)
- Exhibits106: Data Table on China - Year-over-year growth 2022-2027 (%)
- Exhibits107: Chart on Germany - Market size and forecast 2022-2027 ($ million)
- Exhibits108: Data Table on Germany - Market size and forecast 2022-2027 ($ million)
- Exhibits109: Chart on Germany - Year-over-year growth 2022-2027 (%)
- Exhibits110: Data Table on Germany - Year-over-year growth 2022-2027 (%)
- Exhibits111: Chart on India - Market size and forecast 2022-2027 ($ million)
- Exhibits112: Data Table on India - Market size and forecast 2022-2027 ($ million)
- Exhibits113: Chart on India - Year-over-year growth 2022-2027 (%)
- Exhibits114: Data Table on India - Year-over-year growth 2022-2027 (%)
- Exhibits115: Chart on UK - Market size and forecast 2022-2027 ($ million)
- Exhibits116: Data Table on UK - Market size and forecast 2022-2027 ($ million)
- Exhibits117: Chart on UK - Year-over-year growth 2022-2027 (%)
- Exhibits118: Data Table on UK - Year-over-year growth 2022-2027 (%)
- Exhibits119: Market opportunity by geography ($ million)
- Exhibits120: Data Tables on Market opportunity by geography ($ million)
- Exhibits121: Impact of drivers and challenges in 2022 and 2027
- Exhibits122: Overview on Criticality of inputs and Factors of differentiation
- Exhibits123: Overview on factors of disruption
- Exhibits124: Impact of key risks on business
- Exhibits125: Vendors covered
- Exhibits126: Matrix on vendor position and classification
- Exhibits127: Apple and Eve LLC - Overview
- Exhibits128: Apple and Eve LLC - Product / Service
- Exhibits129: Apple and Eve LLC - Key offerings
- Exhibits130: AriZona Beverages USA LLC - Overview
- Exhibits131: AriZona Beverages USA LLC - Product / Service
- Exhibits132: AriZona Beverages USA LLC - Key news
- Exhibits133: AriZona Beverages USA LLC - Key offerings
- Exhibits134: Campbell Soup Co. - Overview
- Exhibits135: Campbell Soup Co. - Business segments
- Exhibits136: Campbell Soup Co. - Key offerings
- Exhibits137: Campbell Soup Co. - Segment focus
- Exhibits138: Cawston Press Ltd. - Overview
- Exhibits139: Cawston Press Ltd. - Product / Service
- Exhibits140: Cawston Press Ltd. - Key offerings
- Exhibits141: ENVASADOS EVA SA - Overview
- Exhibits142: ENVASADOS EVA SA - Product / Service
- Exhibits143: ENVASADOS EVA SA - Key offerings
- Exhibits144: Juice and World - Overview
- Exhibits145: Juice and World - Product / Service
- Exhibits146: Juice and World - Key offerings
- Exhibits147: Keurig Dr Pepper Inc. - Overview
- Exhibits148: Keurig Dr Pepper Inc. - Business segments
- Exhibits149: Keurig Dr Pepper Inc. - Key news
- Exhibits150: Keurig Dr Pepper Inc. - Key offerings
- Exhibits151: Keurig Dr Pepper Inc. - Segment focus
- Exhibits152: Kristian Regale Inc. - Overview
- Exhibits153: Kristian Regale Inc. - Product / Service
- Exhibits154: Kristian Regale Inc. - Key offerings
- Exhibits155: Nestle SA - Overview
- Exhibits156: Nestle SA - Business segments
- Exhibits157: Nestle SA - Key news
- Exhibits158: Nestle SA - Key offerings
- Exhibits159: Nestle SA - Segment focus
- Exhibits160: Ocean Spray Cranberries Inc. - Overview
- Exhibits161: Ocean Spray Cranberries Inc. - Product / Service
- Exhibits162: Ocean Spray Cranberries Inc. - Key offerings
- Exhibits163: PepsiCo Inc. - Overview
- Exhibits164: PepsiCo Inc. - Business segments
- Exhibits165: PepsiCo Inc. - Key news
- Exhibits166: PepsiCo Inc. - Key offerings
- Exhibits167: PepsiCo Inc. - Segment focus
- Exhibits168: The Coca Cola Co. - Overview
- Exhibits169: The Coca Cola Co. - Business segments
- Exhibits170: The Coca Cola Co. - Key news
- Exhibits171: The Coca Cola Co. - Key offerings
- Exhibits172: The Coca Cola Co. - Segment focus
- Exhibits173: The J.M Smucker Co. - Overview
- Exhibits174: The J.M Smucker Co. - Business segments
- Exhibits175: The J.M Smucker Co. - Key news
- Exhibits176: The J.M Smucker Co. - Key offerings
- Exhibits177: The J.M Smucker Co. - Segment focus
- Exhibits178: The S. Martinelli and Company - Overview
- Exhibits179: The S. Martinelli and Company - Product / Service
- Exhibits180: The S. Martinelli and Company - Key offerings
- Exhibits181: Welch Foods Inc. - Overview
- Exhibits182: Welch Foods Inc. - Product / Service
- Exhibits183: Welch Foods Inc. - Key offerings
- Exhibits184: Inclusions checklist
- Exhibits185: Exclusions checklist
- Exhibits186: Currency conversion rates for US$
- Exhibits187: Research methodology
- Exhibits188: Validation techniques employed for market sizing
- Exhibits189: Information sources
- Exhibits190: List of abbreviations
Technavio has been monitoring the sparkling juices market and is forecast to grow by $920.29 mn during 2022-2027, accelerating at a CAGR of 10.43% during the forecast period. Our report on the sparkling juices market provides a holistic analysis, market size and forecast, trends, growth drivers, and challenges, as well as vendor analysis covering around 25 vendors.
The report offers an up-to-date analysis regarding the current market scenario, the latest trends and drivers, and the overall market environment. The market is driven by benefits of cold-pressed sparkling juice when compared with traditional juice, increasing urbanization and changing consumer lifestyle, and new product launches.
Technavio's sparkling juices market is segmented as below:
By Type
- Sparkling juice drinks
- Hundred percent sparkling juice
- Sparkling juices from nectar
By Distribution Channel
- Supermarkets and hypermarkets
- On-trade
- Independent retailers
- Convenience stores
- Others
By Geography
- Europe
- North America
- APAC
- South America
- Middle East and Africa
This study identifies the increasing prominence of private-label brands as one of the prime reasons driving the sparkling juices market growth during the next few years. Also, the growing demand for organic sparkling juices and the health benefits associated with functional sparkling juices will lead to sizable demand in the market.
Technavio presents a detailed picture of the market by the way of study, synthesis, and summation of data from multiple sources by an analysis of key parameters. Our report on the sparkling juices market covers the following areas:
- Sparkling juices market sizing
- Sparkling juices market forecast
- Sparkling juices market industry analysis
Technavio's robust vendor analysis is designed to help clients improve their market position, and in line with this, this report provides a detailed analysis of several leading sparkling juices market vendors that include Apple and Eve LLC, AriZona Beverages USA LLC, Campbell Soup Co., Cawston Press Ltd., ENVASADOS EVA SA, Good Juicery, Juice and World, Keurig Dr Pepper Inc., Kristian Regale Inc., National Beverage Corp., Nestle SA, Ocean Spray Cranberries Inc., Parle Agro Pvt Ltd., PepsiCo Inc., Shloer, The Coca Cola Co., The J.M Smucker Co., The S. Martinelli and Company, and Welch Foods Inc. Also, the sparkling juices market analysis report includes information on upcoming trends and challenges that will influence market growth. This is to help companies strategize and leverage all forthcoming growth opportunities.
The study was conducted using an objective combination of primary and secondary information including inputs from key participants in the industry. The report contains a comprehensive market and vendor landscape in addition to an analysis of the key vendors.
Technavio presents a detailed picture of the market by the way of study, synthesis, and summation of data from multiple sources by an analysis of key parameters such as profit, pricing, competition, and promotions. It presents various market facets by identifying the key industry influencers. The data presented is comprehensive, reliable, and a result of extensive research - both primary and secondary. Technavio's market research reports provide a complete competitive landscape and an in-depth vendor selection methodology and analysis using qualitative and quantitative research to forecast accurate market growth.
Table of Contents
1 Executive Summary
- 1.1 Market overview
- Exhibit 01: Executive Summary - Chart on Market Overview
- Exhibit 02: Executive Summary - Data Table on Market Overview
- Exhibit 03: Executive Summary - Chart on Global Market Characteristics
- Exhibit 04: Executive Summary - Chart on Market by Geography
- Exhibit 05: Executive Summary - Chart on Market Segmentation by Type
- Exhibit 06: Executive Summary - Chart on Market Segmentation by Distribution Channel
- Exhibit 07: Executive Summary - Chart on Incremental Growth
- Exhibit 08: Executive Summary - Data Table on Incremental Growth
- Exhibit 09: Executive Summary - Chart on Vendor Market Positioning
2 Market Landscape
- 2.1 Market ecosystem
- Exhibit 10: Parent market
- Exhibit 11: Market Characteristics
3 Market Sizing
- 3.1 Market definition
- Exhibit 12: Offerings of vendors included in the market definition
- 3.2 Market segment analysis
- Exhibit 13: Market segments
- 3.3 Market size 2022
- 3.4 Market outlook: Forecast for 2022-2027
- Exhibit 14: Chart on Global - Market size and forecast 2022-2027 ($ million)
- Exhibit 15: Data Table on Global - Market size and forecast 2022-2027 ($ million)
- Exhibit 16: Chart on Global Market: Year-over-year growth 2022-2027 (%)
- Exhibit 17: Data Table on Global Market: Year-over-year growth 2022-2027 (%)
4 Historic Market Size
- 4.1 Global sparkling juices market 2017 - 2021
- Exhibit 18: Historic Market Size - Data Table on Global sparkling juices market 2017 - 2021 ($ million)
- 4.2 Type Segment Analysis 2017 - 2021
- Exhibit 19: Historic Market Size - Type Segment 2017 - 2021 ($ million)
- 4.3 Distribution Channel Segment Analysis 2017 - 2021
- Exhibit 20: Historic Market Size - Distribution Channel Segment 2017 - 2021 ($ million)
- 4.4 Geography Segment Analysis 2017 - 2021
- Exhibit 21: Historic Market Size - Geography Segment 2017 - 2021 ($ million)
- 4.5 Country Segment Analysis 2017 - 2021
- Exhibit 22: Historic Market Size - Country Segment 2017 - 2021 ($ million)
5 Five Forces Analysis
- 5.1 Five forces summary
- Exhibit 23: Five forces analysis - Comparison between 2022 and 2027
- 5.2 Bargaining power of buyers
- Exhibit 24: Chart on Bargaining power of buyers - Impact of key factors 2022 and 2027
- 5.3 Bargaining power of suppliers
- Exhibit 25: Bargaining power of suppliers - Impact of key factors in 2022 and 2027
- 5.4 Threat of new entrants
- Exhibit 26: Threat of new entrants - Impact of key factors in 2022 and 2027
- 5.5 Threat of substitutes
- Exhibit 27: Threat of substitutes - Impact of key factors in 2022 and 2027
- 5.6 Threat of rivalry
- Exhibit 28: Threat of rivalry - Impact of key factors in 2022 and 2027
- 5.7 Market condition
- Exhibit 29: Chart on Market condition - Five forces 2022 and 2027
6 Market Segmentation by Type
- 6.1 Market segments
- Exhibit 30: Chart on Type - Market share 2022-2027 (%)
- Exhibit 31: Data Table on Type - Market share 2022-2027 (%)
- 6.2 Comparison by Type
- Exhibit 32: Chart on Comparison by Type
- Exhibit 33: Data Table on Comparison by Type
- 6.3 Sparkling juice drinks - Market size and forecast 2022-2027
- Exhibit 34: Chart on Sparkling juice drinks - Market size and forecast 2022-2027 ($ million)
- Exhibit 35: Data Table on Sparkling juice drinks - Market size and forecast 2022-2027 ($ million)
- Exhibit 36: Chart on Sparkling juice drinks - Year-over-year growth 2022-2027 (%)
- Exhibit 37: Data Table on Sparkling juice drinks - Year-over-year growth 2022-2027 (%)
- 6.4 Hundred percent sparkling juice - Market size and forecast 2022-2027
- Exhibit 38: Chart on Hundred percent sparkling juice - Market size and forecast 2022-2027 ($ million)
- Exhibit 39: Data Table on Hundred percent sparkling juice - Market size and forecast 2022-2027 ($ million)
- Exhibit 40: Chart on Hundred percent sparkling juice - Year-over-year growth 2022-2027 (%)
- Exhibit 41: Data Table on Hundred percent sparkling juice - Year-over-year growth 2022-2027 (%)
- 6.5 Sparkling juices from nectar - Market size and forecast 2022-2027
- Exhibit 42: Chart on Sparkling juices from nectar - Market size and forecast 2022-2027 ($ million)
- Exhibit 43: Data Table on Sparkling juices from nectar - Market size and forecast 2022-2027 ($ million)
- Exhibit 44: Chart on Sparkling juices from nectar - Year-over-year growth 2022-2027 (%)
- Exhibit 45: Data Table on Sparkling juices from nectar - Year-over-year growth 2022-2027 (%)
- 6.6 Market opportunity by Type
- Exhibit 46: Market opportunity by Type ($ million)
- Exhibit 47: Data Table on Market opportunity by Type ($ million)
7 Market Segmentation by Distribution Channel
- 7.1 Market segments
- Exhibit 48: Chart on Distribution Channel - Market share 2022-2027 (%)
- Exhibit 49: Data Table on Distribution Channel - Market share 2022-2027 (%)
- 7.2 Comparison by Distribution Channel
- Exhibit 50: Chart on Comparison by Distribution Channel
- Exhibit 51: Data Table on Comparison by Distribution Channel
- 7.3 Supermarkets and hypermarkets - Market size and forecast 2022-2027
- Exhibit 52: Chart on Supermarkets and hypermarkets - Market size and forecast 2022-2027 ($ million)
- Exhibit 53: Data Table on Supermarkets and hypermarkets - Market size and forecast 2022-2027 ($ million)
- Exhibit 54: Chart on Supermarkets and hypermarkets - Year-over-year growth 2022-2027 (%)
- Exhibit 55: Data Table on Supermarkets and hypermarkets - Year-over-year growth 2022-2027 (%)
- 7.4 On-trade - Market size and forecast 2022-2027
- Exhibit 56: Chart on On-trade - Market size and forecast 2022-2027 ($ million)
- Exhibit 57: Data Table on On-trade - Market size and forecast 2022-2027 ($ million)
- Exhibit 58: Chart on On-trade - Year-over-year growth 2022-2027 (%)
- Exhibit 59: Data Table on On-trade - Year-over-year growth 2022-2027 (%)
- 7.5 Independent retailers - Market size and forecast 2022-2027
- Exhibit 60: Chart on Independent retailers - Market size and forecast 2022-2027 ($ million)
- Exhibit 61: Data Table on Independent retailers - Market size and forecast 2022-2027 ($ million)
- Exhibit 62: Chart on Independent retailers - Year-over-year growth 2022-2027 (%)
- Exhibit 63: Data Table on Independent retailers - Year-over-year growth 2022-2027 (%)
- 7.6 Convenience stores - Market size and forecast 2022-2027
- Exhibit 64: Chart on Convenience stores - Market size and forecast 2022-2027 ($ million)
- Exhibit 65: Data Table on Convenience stores - Market size and forecast 2022-2027 ($ million)
- Exhibit 66: Chart on Convenience stores - Year-over-year growth 2022-2027 (%)
- Exhibit 67: Data Table on Convenience stores - Year-over-year growth 2022-2027 (%)
- 7.7 Others - Market size and forecast 2022-2027
- Exhibit 68: Chart on Others - Market size and forecast 2022-2027 ($ million)
- Exhibit 69: Data Table on Others - Market size and forecast 2022-2027 ($ million)
- Exhibit 70: Chart on Others - Year-over-year growth 2022-2027 (%)
- Exhibit 71: Data Table on Others - Year-over-year growth 2022-2027 (%)
- 7.8 Market opportunity by Distribution Channel
- Exhibit 72: Market opportunity by Distribution Channel ($ million)
- Exhibit 73: Data Table on Market opportunity by Distribution Channel ($ million)
8 Customer Landscape
- 8.1 Customer landscape overview
- Exhibit 74: Analysis of price sensitivity, lifecycle, customer purchase basket, adoption rates, and purchase criteria
9 Geographic Landscape
- 9.1 Geographic segmentation
- Exhibit 75: Chart on Market share by geography 2022-2027 (%)
- Exhibit 76: Data Table on Market share by geography 2022-2027 (%)
- 9.2 Geographic comparison
- Exhibit 77: Chart on Geographic comparison
- Exhibit 78: Data Table on Geographic comparison
- 9.3 Europe - Market size and forecast 2022-2027
- Exhibit 79: Chart on Europe - Market size and forecast 2022-2027 ($ million)
- Exhibit 80: Data Table on Europe - Market size and forecast 2022-2027 ($ million)
- Exhibit 81: Chart on Europe - Year-over-year growth 2022-2027 (%)
- Exhibit 82: Data Table on Europe - Year-over-year growth 2022-2027 (%)
- 9.4 North America - Market size and forecast 2022-2027
- Exhibit 83: Chart on North America - Market size and forecast 2022-2027 ($ million)
- Exhibit 84: Data Table on North America - Market size and forecast 2022-2027 ($ million)
- Exhibit 85: Chart on North America - Year-over-year growth 2022-2027 (%)
- Exhibit 86: Data Table on North America - Year-over-year growth 2022-2027 (%)
- 9.5 APAC - Market size and forecast 2022-2027
- Exhibit 87: Chart on APAC - Market size and forecast 2022-2027 ($ million)
- Exhibit 88: Data Table on APAC - Market size and forecast 2022-2027 ($ million)
- Exhibit 89: Chart on APAC - Year-over-year growth 2022-2027 (%)
- Exhibit 90: Data Table on APAC - Year-over-year growth 2022-2027 (%)
- 9.6 South America - Market size and forecast 2022-2027
- Exhibit 91: Chart on South America - Market size and forecast 2022-2027 ($ million)
- Exhibit 92: Data Table on South America - Market size and forecast 2022-2027 ($ million)
- Exhibit 93: Chart on South America - Year-over-year growth 2022-2027 (%)
- Exhibit 94: Data Table on South America - Year-over-year growth 2022-2027 (%)
- 9.7 Middle East and Africa - Market size and forecast 2022-2027
- Exhibit 95: Chart on Middle East and Africa - Market size and forecast 2022-2027 ($ million)
- Exhibit 96: Data Table on Middle East and Africa - Market size and forecast 2022-2027 ($ million)
- Exhibit 97: Chart on Middle East and Africa - Year-over-year growth 2022-2027 (%)
- Exhibit 98: Data Table on Middle East and Africa - Year-over-year growth 2022-2027 (%)
- 9.8 US - Market size and forecast 2022-2027
- Exhibit 99: Chart on US - Market size and forecast 2022-2027 ($ million)
- Exhibit 100: Data Table on US - Market size and forecast 2022-2027 ($ million)
- Exhibit 101: Chart on US - Year-over-year growth 2022-2027 (%)
- Exhibit 102: Data Table on US - Year-over-year growth 2022-2027 (%)
- 9.9 China - Market size and forecast 2022-2027
- Exhibit 103: Chart on China - Market size and forecast 2022-2027 ($ million)
- Exhibit 104: Data Table on China - Market size and forecast 2022-2027 ($ million)
- Exhibit 105: Chart on China - Year-over-year growth 2022-2027 (%)
- Exhibit 106: Data Table on China - Year-over-year growth 2022-2027 (%)
- 9.10 Germany - Market size and forecast 2022-2027
- Exhibit 107: Chart on Germany - Market size and forecast 2022-2027 ($ million)
- Exhibit 108: Data Table on Germany - Market size and forecast 2022-2027 ($ million)
- Exhibit 109: Chart on Germany - Year-over-year growth 2022-2027 (%)
- Exhibit 110: Data Table on Germany - Year-over-year growth 2022-2027 (%)
- 9.11 India - Market size and forecast 2022-2027
- Exhibit 111: Chart on India - Market size and forecast 2022-2027 ($ million)
- Exhibit 112: Data Table on India - Market size and forecast 2022-2027 ($ million)
- Exhibit 113: Chart on India - Year-over-year growth 2022-2027 (%)
- Exhibit 114: Data Table on India - Year-over-year growth 2022-2027 (%)
- 9.12 UK - Market size and forecast 2022-2027
- Exhibit 115: Chart on UK - Market size and forecast 2022-2027 ($ million)
- Exhibit 116: Data Table on UK - Market size and forecast 2022-2027 ($ million)
- Exhibit 117: Chart on UK - Year-over-year growth 2022-2027 (%)
- Exhibit 118: Data Table on UK - Year-over-year growth 2022-2027 (%)
- 9.13 Market opportunity by geography
- Exhibit 119: Market opportunity by geography ($ million)
- Exhibit 120: Data Tables on Market opportunity by geography ($ million)
10 Drivers, Challenges, and Trends
- 10.1 Market drivers
- 10.2 Market challenges
- 10.3 Impact of drivers and challenges
- Exhibit 121: Impact of drivers and challenges in 2022 and 2027
- 10.4 Market trends
11 Vendor Landscape
- 11.1 Overview
- 11.2 Vendor landscape
- Exhibit 122: Overview on Criticality of inputs and Factors of differentiation
- 11.3 Landscape disruption
- Exhibit 123: Overview on factors of disruption
- 11.4 Industry risks
- Exhibit 124: Impact of key risks on business
12 Vendor Analysis
- 12.1 Vendors covered
- Exhibit 125: Vendors covered
- 12.2 Market positioning of vendors
- Exhibit 126: Matrix on vendor position and classification
- 12.3 Apple and Eve LLC
- Exhibit 127: Apple and Eve LLC - Overview
- Exhibit 128: Apple and Eve LLC - Product / Service
- Exhibit 129: Apple and Eve LLC - Key offerings
- 12.4 AriZona Beverages USA LLC
- Exhibit 130: AriZona Beverages USA LLC - Overview
- Exhibit 131: AriZona Beverages USA LLC - Product / Service
- Exhibit 132: AriZona Beverages USA LLC - Key news
- Exhibit 133: AriZona Beverages USA LLC - Key offerings
- 12.5 Campbell Soup Co.
- Exhibit 134: Campbell Soup Co. - Overview
- Exhibit 135: Campbell Soup Co. - Business segments
- Exhibit 136: Campbell Soup Co. - Key offerings
- Exhibit 137: Campbell Soup Co. - Segment focus
- 12.6 Cawston Press Ltd.
- Exhibit 138: Cawston Press Ltd. - Overview
- Exhibit 139: Cawston Press Ltd. - Product / Service
- Exhibit 140: Cawston Press Ltd. - Key offerings
- 12.7 ENVASADOS EVA SA
- Exhibit 141: ENVASADOS EVA SA - Overview
- Exhibit 142: ENVASADOS EVA SA - Product / Service
- Exhibit 143: ENVASADOS EVA SA - Key offerings
- 12.8 Juice and World
- Exhibit 144: Juice and World - Overview
- Exhibit 145: Juice and World - Product / Service
- Exhibit 146: Juice and World - Key offerings
- 12.9 Keurig Dr Pepper Inc.
- Exhibit 147: Keurig Dr Pepper Inc. - Overview
- Exhibit 148: Keurig Dr Pepper Inc. - Business segments
- Exhibit 149: Keurig Dr Pepper Inc. - Key news
- Exhibit 150: Keurig Dr Pepper Inc. - Key offerings
- Exhibit 151: Keurig Dr Pepper Inc. - Segment focus
- 12.10 Kristian Regale Inc.
- Exhibit 152: Kristian Regale Inc. - Overview
- Exhibit 153: Kristian Regale Inc. - Product / Service
- Exhibit 154: Kristian Regale Inc. - Key offerings
- 12.11 Nestle SA
- Exhibit 155: Nestle SA - Overview
- Exhibit 156: Nestle SA - Business segments
- Exhibit 157: Nestle SA - Key news
- Exhibit 158: Nestle SA - Key offerings
- Exhibit 159: Nestle SA - Segment focus
- 12.12 Ocean Spray Cranberries Inc.
- Exhibit 160: Ocean Spray Cranberries Inc. - Overview
- Exhibit 161: Ocean Spray Cranberries Inc. - Product / Service
- Exhibit 162: Ocean Spray Cranberries Inc. - Key offerings
- 12.13 PepsiCo Inc.
- Exhibit 163: PepsiCo Inc. - Overview
- Exhibit 164: PepsiCo Inc. - Business segments
- Exhibit 165: PepsiCo Inc. - Key news
- Exhibit 166: PepsiCo Inc. - Key offerings
- Exhibit 167: PepsiCo Inc. - Segment focus
- 12.14 The Coca Cola Co.
- Exhibit 168: The Coca Cola Co. - Overview
- Exhibit 169: The Coca Cola Co. - Business segments
- Exhibit 170: The Coca Cola Co. - Key news
- Exhibit 171: The Coca Cola Co. - Key offerings
- Exhibit 172: The Coca Cola Co. - Segment focus
- 12.15 The J.M Smucker Co.
- Exhibit 173: The J.M Smucker Co. - Overview
- Exhibit 174: The J.M Smucker Co. - Business segments
- Exhibit 175: The J.M Smucker Co. - Key news
- Exhibit 176: The J.M Smucker Co. - Key offerings
- Exhibit 177: The J.M Smucker Co. - Segment focus
- 12.16 The S. Martinelli and Company
- Exhibit 178: The S. Martinelli and Company - Overview
- Exhibit 179: The S. Martinelli and Company - Product / Service
- Exhibit 180: The S. Martinelli and Company - Key offerings
- 12.17 Welch Foods Inc.
- Exhibit 181: Welch Foods Inc. - Overview
- Exhibit 182: Welch Foods Inc. - Product / Service
- Exhibit 183: Welch Foods Inc. - Key offerings
13 Appendix
- 13.1 Scope of the report
- 13.2 Inclusions and exclusions checklist
- Exhibit 184: Inclusions checklist
- Exhibit 185: Exclusions checklist
- 13.3 Currency conversion rates for US$
- Exhibit 186: Currency conversion rates for US$
- 13.4 Research methodology
- Exhibit 187: Research methodology
- Exhibit 188: Validation techniques employed for market sizing
- Exhibit 189: Information sources
- 13.5 List of abbreviations
- Exhibit 190: List of abbreviations