|
|
市場調査レポート
商品コード
1783867
コールタールピッチの世界市場、2025年~2029年Global Coal Tar Pitch Market 2025-2029 |
||||||

|
|||||||
カスタマイズ可能
|
|||||||

| コールタールピッチの世界市場、2025年~2029年 |
|
出版日: 2025年07月29日
発行: TechNavio
ページ情報: 英文 225 Pages
納期: 即納可能
|

全表示
- 概要
- 図表
- 目次
コールタールピッチ市場は2024-2029年に6億4,180万米ドル、予測期間中のCAGRで2.2%の成長が予測されています。
当レポートでは、コールタールピッチ市場の全体的な分析、市場規模・予測、動向、成長促進要因、課題、約25のベンダーを網羅したベンダー分析などを掲載しています。
現在の市場シナリオ、最新動向と促進要因、市場環境全体に関する最新分析を提供しています。市場は、様々な産業におけるアルミニウム使用の増加、活性炭の多様な使用、都市化の進展によって牽引されています。
| 市場範囲 | |
|---|---|
| 基準年 | 2025 |
| 終了年 | 2029 |
| 予測期間 | 2025-2029 |
| 成長モメンタム | 加速 |
| 前年比 | 2.2% |
| CAGR | 2.2% |
| 増分額 | 6億4,180万米ドル |
本調査は、業界の主要参加者からのインプットを含め、一次情報と二次情報を客観的に組み合わせて実施しました。レポートには、主要企業の分析に加え、包括的な市場規模データ、地域別分析によるセグメント、ベンダー情勢が含まれています。レポートには過去データと予測データがあります。
本調査では、今後数年間のコールタールピッチ市場の成長を促進する主な要因の1つとして、高度なタイプのコールタールピッチの使用が増加していることを挙げています。また、コールタールピッチベースのニードルコークスがリチウムイオン電池に使用され、コールタールピッチが屋根材に使用されることで、市場の大きな需要が見込まれます。
目次
第1章 エグゼクティブサマリー
- 市場概要
第2章 Technavio分析
- 価格・ライフサイクル・顧客購入バスケット・採用率・購入基準の分析
- インプットの重要性と差別化の要因
- 混乱の要因
- 促進要因と課題の影響
第3章 市場情勢
- 市場エコシステム
- 市場の特徴
- バリューチェーン分析
第4章 市場規模
- 市場の定義
- 市場セグメント分析
- 市場規模 2024
- 市場の見通し 2024-2029
第5章 市場規模実績
- コールタールピッチの世界市場 2019-2023
- 用途別セグメント分析 2019-2023
- タイプ別セグメント分析 2019-2023
- 製品タイプ別セグメント分析 2019-2023
- 地域別セグメント分析 2019-2023
- 国別セグメント分析 2019-2023
第6章 定性分析
- AIの影響:コールタールピッチの世界市場
第7章 ファイブフォース分析
- ファイブフォースの要約
- 買い手の交渉力
- 供給企業の交渉力
- 新規参入業者の脅威
- 代替品の脅威
- 競争の脅威
- 市況
第8章 市場セグメンテーション:用途別
- 市場セグメント
- 比較:用途別
- アルミニウム生産:市場規模と予測 2024-2029
- グラファイト電極・特殊グラファイト製品:市場規模と予測 2024-2029
- 炭素処理産業:市場規模と予測 2024-2029
- その他:市場規模と予測 2024-2029
- 市場機会:用途別
第9章 市場セグメンテーション:タイプ別
- 市場セグメント
- 比較:タイプ別
- ソリッド:市場規模と予測 2024-2029
- リキッド:市場規模と予測 2024-2029
- 市場機会:タイプ別
第10章 市場セグメンテーション:製品タイプ別
- 市場セグメント
- 比較:製品タイプ別
- 中温:市場規模と予測 2024-2029
- 高温:市場規模と予測 2024-2029
- 低温:市場規模と予測 2024-2029
- 市場機会:製品タイプ別
第11章 顧客情勢
- 顧客情勢の概要
第12章 地域別情勢
- 地域別セグメンテーション
- 地域別比較
- アジア太平洋:市場規模と予測 2024-2029
- 欧州:市場規模と予測 2024-2029
- 北米:市場規模と予測 2024-2029
- 中東・アフリカ:市場規模と予測 2024-2029
- 南米:市場規模と予測 2024-2029
- 中国:市場規模と予測 2024-2029
- インド:市場規模と予測 2024-2029
- 日本:市場規模と予測 2024-2029
- 米国:市場規模と予測 2024-2029
- ロシア:市場規模と予測 2024-2029
- 韓国:市場規模と予測 2024-2029
- ドイツ:市場規模と予測 2024-2029
- アラブ首長国連邦:市場規模と予測 2024-2029
- 英国:市場規模と予測 2024-2029
- ブラジル:市場規模と予測 2024-2029
- 市場機会:地域情勢別
第13章 促進要因・課題・機会・抑制要因
- 市場促進要因
- 市場の課題
- 促進要因と課題の影響
- 市場の機会・抑制要因
第14章 競合情勢
- 概要
- 競合情勢
- 混乱の状況
- 業界のリスク
第15章 競合分析
- 企業プロファイル
- 企業ランキング指数
- 企業の市場ポジショニング
- Aparna Carbons Pvt. Ltd.
- China Risun Group Ltd.
- China Steel Chemical Corp.
- Coopers Creek Chemical Corp.
- DEZA AS
- Himadri Speciality Chemical Ltd.
- JFE Holdings Inc.
- Jining Carbon Group Co. Ltd.
- Koppers Holdings Inc.
- Mitsubishi Chemical Corp.
- Nippon Steel Corp.
- NLMK Group
- Quimica del Nalon SA
- Rain Carbon Inc.
- Sumitomo Chemical Co. Ltd.
第16章 付録
Exhibits:
- Exhibits1: Executive Summary - Chart on Market Overview
- Exhibits2: Executive Summary - Data Table on Market Overview
- Exhibits3: Executive Summary - Chart on Global Market Characteristics
- Exhibits4: Executive Summary - Chart on Market By Geographical Landscape
- Exhibits5: Executive Summary - Chart on Market Segmentation by Application
- Exhibits6: Executive Summary - Chart on Market Segmentation by Type
- Exhibits7: Executive Summary - Chart on Market Segmentation by Product Type
- Exhibits8: Executive Summary - Chart on Incremental Growth
- Exhibits9: Executive Summary - Data Table on Incremental Growth
- Exhibits10: Executive Summary - Chart on Company Market Positioning
- Exhibits11: Analysis of price sensitivity, lifecycle, customer purchase basket, adoption rates, and purchase criteria
- Exhibits12: Overview on criticality of inputs and factors of differentiation
- Exhibits13: Overview on factors of disruption
- Exhibits14: Impact of drivers and challenges in 2024 and 2029
- Exhibits15: Parent Market
- Exhibits16: Data Table on - Parent Market
- Exhibits17: Market characteristics analysis
- Exhibits18: Value chain analysis
- Exhibits19: Offerings of companies included in the market definition
- Exhibits20: Market segments
- Exhibits21: Chart on Global - Market size and forecast 2024-2029 ($ million)
- Exhibits22: Data Table on Global - Market size and forecast 2024-2029 ($ million)
- Exhibits23: Chart on Global Market: Year-over-year growth 2024-2029 (%)
- Exhibits24: Data Table on Global Market: Year-over-year growth 2024-2029 (%)
- Exhibits25: Historic Market Size - Data Table on Global Coal Tar Pitch Market 2019 - 2023 ($ million)
- Exhibits26: Historic Market Size - Application Segment 2019 - 2023 ($ million)
- Exhibits27: Historic Market Size - Type Segment 2019 - 2023 ($ million)
- Exhibits28: Historic Market Size - Product Type Segment 2019 - 2023 ($ million)
- Exhibits29: Historic Market Size - Geography Segment 2019 - 2023 ($ million)
- Exhibits30: Historic Market Size - Country Segment 2019 - 2023 ($ million)
- Exhibits31: Five forces analysis - Comparison between 2024 and 2029
- Exhibits32: Bargaining power of buyers - Impact of key factors 2024 and 2029
- Exhibits33: Bargaining power of suppliers - Impact of key factors in 2024 and 2029
- Exhibits34: Threat of new entrants - Impact of key factors in 2024 and 2029
- Exhibits35: Threat of substitutes - Impact of key factors in 2024 and 2029
- Exhibits36: Threat of rivalry - Impact of key factors in 2024 and 2029
- Exhibits37: Chart on Market condition - Five forces 2024 and 2029
- Exhibits38: Chart on Application - Market share 2024-2029 (%)
- Exhibits39: Data Table on Application - Market share 2024-2029 (%)
- Exhibits40: Chart on Comparison by Application
- Exhibits41: Data Table on Comparison by Application
- Exhibits42: Chart on Aluminum production - Market size and forecast 2024-2029 ($ million)
- Exhibits43: Data Table on Aluminum production - Market size and forecast 2024-2029 ($ million)
- Exhibits44: Chart on Aluminum production - Year-over-year growth 2024-2029 (%)
- Exhibits45: Data Table on Aluminum production - Year-over-year growth 2024-2029 (%)
- Exhibits46: Chart on Graphite electrodes and specialty graphite products - Market size and forecast 2024-2029 ($ million)
- Exhibits47: Data Table on Graphite electrodes and specialty graphite products - Market size and forecast 2024-2029 ($ million)
- Exhibits48: Chart on Graphite electrodes and specialty graphite products - Year-over-year growth 2024-2029 (%)
- Exhibits49: Data Table on Graphite electrodes and specialty graphite products - Year-over-year growth 2024-2029 (%)
- Exhibits50: Chart on Carbon processing industry - Market size and forecast 2024-2029 ($ million)
- Exhibits51: Data Table on Carbon processing industry - Market size and forecast 2024-2029 ($ million)
- Exhibits52: Chart on Carbon processing industry - Year-over-year growth 2024-2029 (%)
- Exhibits53: Data Table on Carbon processing industry - Year-over-year growth 2024-2029 (%)
- Exhibits54: Chart on Others - Market size and forecast 2024-2029 ($ million)
- Exhibits55: Data Table on Others - Market size and forecast 2024-2029 ($ million)
- Exhibits56: Chart on Others - Year-over-year growth 2024-2029 (%)
- Exhibits57: Data Table on Others - Year-over-year growth 2024-2029 (%)
- Exhibits58: Market opportunity by Application ($ million)
- Exhibits59: Data Table on Market opportunity by Application ($ million)
- Exhibits60: Chart on Type - Market share 2024-2029 (%)
- Exhibits61: Data Table on Type - Market share 2024-2029 (%)
- Exhibits62: Chart on Comparison by Type
- Exhibits63: Data Table on Comparison by Type
- Exhibits64: Chart on Solid coal tar pitch - Market size and forecast 2024-2029 ($ million)
- Exhibits65: Data Table on Solid coal tar pitch - Market size and forecast 2024-2029 ($ million)
- Exhibits66: Chart on Solid coal tar pitch - Year-over-year growth 2024-2029 (%)
- Exhibits67: Data Table on Solid coal tar pitch - Year-over-year growth 2024-2029 (%)
- Exhibits68: Chart on Liquid coal tar pitch - Market size and forecast 2024-2029 ($ million)
- Exhibits69: Data Table on Liquid coal tar pitch - Market size and forecast 2024-2029 ($ million)
- Exhibits70: Chart on Liquid coal tar pitch - Year-over-year growth 2024-2029 (%)
- Exhibits71: Data Table on Liquid coal tar pitch - Year-over-year growth 2024-2029 (%)
- Exhibits72: Market opportunity by Type ($ million)
- Exhibits73: Data Table on Market opportunity by Type ($ million)
- Exhibits74: Chart on Product Type - Market share 2024-2029 (%)
- Exhibits75: Data Table on Product Type - Market share 2024-2029 (%)
- Exhibits76: Chart on Comparison by Product Type
- Exhibits77: Data Table on Comparison by Product Type
- Exhibits78: Chart on Medium temperature - Market size and forecast 2024-2029 ($ million)
- Exhibits79: Data Table on Medium temperature - Market size and forecast 2024-2029 ($ million)
- Exhibits80: Chart on Medium temperature - Year-over-year growth 2024-2029 (%)
- Exhibits81: Data Table on Medium temperature - Year-over-year growth 2024-2029 (%)
- Exhibits82: Chart on High temperature - Market size and forecast 2024-2029 ($ million)
- Exhibits83: Data Table on High temperature - Market size and forecast 2024-2029 ($ million)
- Exhibits84: Chart on High temperature - Year-over-year growth 2024-2029 (%)
- Exhibits85: Data Table on High temperature - Year-over-year growth 2024-2029 (%)
- Exhibits86: Chart on Low temperature - Market size and forecast 2024-2029 ($ million)
- Exhibits87: Data Table on Low temperature - Market size and forecast 2024-2029 ($ million)
- Exhibits88: Chart on Low temperature - Year-over-year growth 2024-2029 (%)
- Exhibits89: Data Table on Low temperature - Year-over-year growth 2024-2029 (%)
- Exhibits90: Market opportunity by Product Type ($ million)
- Exhibits91: Data Table on Market opportunity by Product Type ($ million)
- Exhibits92: Analysis of price sensitivity, lifecycle, customer purchase basket, adoption rates, and purchase criteria
- Exhibits93: Chart on Market share By Geographical Landscape 2024-2029 (%)
- Exhibits94: Data Table on Market share By Geographical Landscape 2024-2029 (%)
- Exhibits95: Chart on Geographic comparison
- Exhibits96: Data Table on Geographic comparison
- Exhibits97: Chart on APAC - Market size and forecast 2024-2029 ($ million)
- Exhibits98: Data Table on APAC - Market size and forecast 2024-2029 ($ million)
- Exhibits99: Chart on APAC - Year-over-year growth 2024-2029 (%)
- Exhibits100: Data Table on APAC - Year-over-year growth 2024-2029 (%)
- Exhibits101: Chart on Europe - Market size and forecast 2024-2029 ($ million)
- Exhibits102: Data Table on Europe - Market size and forecast 2024-2029 ($ million)
- Exhibits103: Chart on Europe - Year-over-year growth 2024-2029 (%)
- Exhibits104: Data Table on Europe - Year-over-year growth 2024-2029 (%)
- Exhibits105: Chart on North America - Market size and forecast 2024-2029 ($ million)
- Exhibits106: Data Table on North America - Market size and forecast 2024-2029 ($ million)
- Exhibits107: Chart on North America - Year-over-year growth 2024-2029 (%)
- Exhibits108: Data Table on North America - Year-over-year growth 2024-2029 (%)
- Exhibits109: Chart on Middle East and Africa - Market size and forecast 2024-2029 ($ million)
- Exhibits110: Data Table on Middle East and Africa - Market size and forecast 2024-2029 ($ million)
- Exhibits111: Chart on Middle East and Africa - Year-over-year growth 2024-2029 (%)
- Exhibits112: Data Table on Middle East and Africa - Year-over-year growth 2024-2029 (%)
- Exhibits113: Chart on South America - Market size and forecast 2024-2029 ($ million)
- Exhibits114: Data Table on South America - Market size and forecast 2024-2029 ($ million)
- Exhibits115: Chart on South America - Year-over-year growth 2024-2029 (%)
- Exhibits116: Data Table on South America - Year-over-year growth 2024-2029 (%)
- Exhibits117: Chart on China - Market size and forecast 2024-2029 ($ million)
- Exhibits118: Data Table on China - Market size and forecast 2024-2029 ($ million)
- Exhibits119: Chart on China - Year-over-year growth 2024-2029 (%)
- Exhibits120: Data Table on China - Year-over-year growth 2024-2029 (%)
- Exhibits121: Chart on India - Market size and forecast 2024-2029 ($ million)
- Exhibits122: Data Table on India - Market size and forecast 2024-2029 ($ million)
- Exhibits123: Chart on India - Year-over-year growth 2024-2029 (%)
- Exhibits124: Data Table on India - Year-over-year growth 2024-2029 (%)
- Exhibits125: Chart on Japan - Market size and forecast 2024-2029 ($ million)
- Exhibits126: Data Table on Japan - Market size and forecast 2024-2029 ($ million)
- Exhibits127: Chart on Japan - Year-over-year growth 2024-2029 (%)
- Exhibits128: Data Table on Japan - Year-over-year growth 2024-2029 (%)
- Exhibits129: Chart on US - Market size and forecast 2024-2029 ($ million)
- Exhibits130: Data Table on US - Market size and forecast 2024-2029 ($ million)
- Exhibits131: Chart on US - Year-over-year growth 2024-2029 (%)
- Exhibits132: Data Table on US - Year-over-year growth 2024-2029 (%)
- Exhibits133: Chart on Russia - Market size and forecast 2024-2029 ($ million)
- Exhibits134: Data Table on Russia - Market size and forecast 2024-2029 ($ million)
- Exhibits135: Chart on Russia - Year-over-year growth 2024-2029 (%)
- Exhibits136: Data Table on Russia - Year-over-year growth 2024-2029 (%)
- Exhibits137: Chart on South Korea - Market size and forecast 2024-2029 ($ million)
- Exhibits138: Data Table on South Korea - Market size and forecast 2024-2029 ($ million)
- Exhibits139: Chart on South Korea - Year-over-year growth 2024-2029 (%)
- Exhibits140: Data Table on South Korea - Year-over-year growth 2024-2029 (%)
- Exhibits141: Chart on Germany - Market size and forecast 2024-2029 ($ million)
- Exhibits142: Data Table on Germany - Market size and forecast 2024-2029 ($ million)
- Exhibits143: Chart on Germany - Year-over-year growth 2024-2029 (%)
- Exhibits144: Data Table on Germany - Year-over-year growth 2024-2029 (%)
- Exhibits145: Chart on United Arab Emirates - Market size and forecast 2024-2029 ($ million)
- Exhibits146: Data Table on United Arab Emirates - Market size and forecast 2024-2029 ($ million)
- Exhibits147: Chart on United Arab Emirates - Year-over-year growth 2024-2029 (%)
- Exhibits148: Data Table on United Arab Emirates - Year-over-year growth 2024-2029 (%)
- Exhibits149: Chart on UK - Market size and forecast 2024-2029 ($ million)
- Exhibits150: Data Table on UK - Market size and forecast 2024-2029 ($ million)
- Exhibits151: Chart on UK - Year-over-year growth 2024-2029 (%)
- Exhibits152: Data Table on UK - Year-over-year growth 2024-2029 (%)
- Exhibits153: Chart on Brazil - Market size and forecast 2024-2029 ($ million)
- Exhibits154: Data Table on Brazil - Market size and forecast 2024-2029 ($ million)
- Exhibits155: Chart on Brazil - Year-over-year growth 2024-2029 (%)
- Exhibits156: Data Table on Brazil - Year-over-year growth 2024-2029 (%)
- Exhibits157: Market opportunity By Geographical Landscape ($ million)
- Exhibits158: Data Tables on Market opportunity By Geographical Landscape ($ million)
- Exhibits159: Impact of drivers and challenges in 2024 and 2029
- Exhibits160: Overview on criticality of inputs and factors of differentiation
- Exhibits161: Overview on factors of disruption
- Exhibits162: Impact of key risks on business
- Exhibits163: Companies covered
- Exhibits164: Company ranking index
- Exhibits165: Matrix on companies position and classification
- Exhibits166: Aparna Carbons Pvt. Ltd. - Overview
- Exhibits167: Aparna Carbons Pvt. Ltd. - Product / Service
- Exhibits168: Aparna Carbons Pvt. Ltd. - Key offerings
- Exhibits169: SWOT
- Exhibits170: China Risun Group Ltd. - Overview
- Exhibits171: China Risun Group Ltd. - Business segments
- Exhibits172: China Risun Group Ltd. - Key offerings
- Exhibits173: China Risun Group Ltd. - Segment focus
- Exhibits174: SWOT
- Exhibits175: China Steel Chemical Corp. - Overview
- Exhibits176: China Steel Chemical Corp. - Business segments
- Exhibits177: China Steel Chemical Corp. - Key offerings
- Exhibits178: China Steel Chemical Corp. - Segment focus
- Exhibits179: SWOT
- Exhibits180: Coopers Creek Chemical Corp. - Overview
- Exhibits181: Coopers Creek Chemical Corp. - Product / Service
- Exhibits182: Coopers Creek Chemical Corp. - Key offerings
- Exhibits183: SWOT
- Exhibits184: DEZA AS - Overview
- Exhibits185: DEZA AS - Product / Service
- Exhibits186: DEZA AS - Key offerings
- Exhibits187: SWOT
- Exhibits188: Himadri Speciality Chemical Ltd. - Overview
- Exhibits189: Himadri Speciality Chemical Ltd. - Business segments
- Exhibits190: Himadri Speciality Chemical Ltd. - Key offerings
- Exhibits191: Himadri Speciality Chemical Ltd. - Segment focus
- Exhibits192: SWOT
- Exhibits193: JFE Holdings Inc. - Overview
- Exhibits194: JFE Holdings Inc. - Business segments
- Exhibits195: JFE Holdings Inc. - Key news
- Exhibits196: JFE Holdings Inc. - Key offerings
- Exhibits197: JFE Holdings Inc. - Segment focus
- Exhibits198: SWOT
- Exhibits199: Jining Carbon Group Co. Ltd. - Overview
- Exhibits200: Jining Carbon Group Co. Ltd. - Product / Service
- Exhibits201: Jining Carbon Group Co. Ltd. - Key offerings
- Exhibits202: SWOT
- Exhibits203: Koppers Holdings Inc. - Overview
- Exhibits204: Koppers Holdings Inc. - Business segments
- Exhibits205: Koppers Holdings Inc. - Key offerings
- Exhibits206: Koppers Holdings Inc. - Segment focus
- Exhibits207: SWOT
- Exhibits208: Mitsubishi Chemical Corp. - Overview
- Exhibits209: Mitsubishi Chemical Corp. - Business segments
- Exhibits210: Mitsubishi Chemical Corp. - Key offerings
- Exhibits211: Mitsubishi Chemical Corp. - Segment focus
- Exhibits212: SWOT
- Exhibits213: Nippon Steel Corp. - Overview
- Exhibits214: Nippon Steel Corp. - Business segments
- Exhibits215: Nippon Steel Corp. - Key news
- Exhibits216: Nippon Steel Corp. - Key offerings
- Exhibits217: Nippon Steel Corp. - Segment focus
- Exhibits218: SWOT
- Exhibits219: NLMK Group - Overview
- Exhibits220: NLMK Group - Product / Service
- Exhibits221: NLMK Group - Key offerings
- Exhibits222: SWOT
- Exhibits223: Quimica del Nalon SA - Overview
- Exhibits224: Quimica del Nalon SA - Product / Service
- Exhibits225: Quimica del Nalon SA - Key offerings
- Exhibits226: SWOT
- Exhibits227: Rain Carbon Inc. - Overview
- Exhibits228: Rain Carbon Inc. - Product / Service
- Exhibits229: Rain Carbon Inc. - Key offerings
- Exhibits230: SWOT
- Exhibits231: Sumitomo Chemical Co. Ltd. - Overview
- Exhibits232: Sumitomo Chemical Co. Ltd. - Business segments
- Exhibits233: Sumitomo Chemical Co. Ltd. - Key offerings
- Exhibits234: Sumitomo Chemical Co. Ltd. - Segment focus
- Exhibits235: SWOT
- Exhibits236: Inclusions checklist
- Exhibits237: Exclusions checklist
- Exhibits238: Currency conversion rates for US$
- Exhibits239: Research methodology
- Exhibits240: Information sources
- Exhibits241: Data validation
- Exhibits242: Validation techniques employed for market sizing
- Exhibits243: Data synthesis
- Exhibits244: 360 degree market analysis
- Exhibits245: List of abbreviations
The coal tar pitch market is forecasted to grow by USD 641.8 mn during 2024-2029, accelerating at a CAGR of 2.2% during the forecast period. The report on the coal tar pitch market provides a holistic analysis, market size and forecast, trends, growth drivers, and challenges, as well as vendor analysis covering around 25 vendors.
The report offers an up-to-date analysis regarding the current market scenario, the latest trends and drivers, and the overall market environment. The market is driven by increasing use of aluminum across various industries, diverse use of activated carbon, and rising urbanization.
| Market Scope | |
|---|---|
| Base Year | 2025 |
| End Year | 2029 |
| Series Year | 2025-2029 |
| Growth Momentum | Accelerate |
| YOY 2025 | 2.2% |
| CAGR | 2.2% |
| Incremental Value | $641.8 mn |
The study was conducted using an objective combination of primary and secondary information including inputs from key participants in the industry. The report contains a comprehensive market size data, segment with regional analysis and vendor landscape in addition to an analysis of the key companies. Reports have historic and forecast data.
Technavio's coal tar pitch market is segmented as below:
By Application
- Aluminum production
- Graphite electrodes and specialty graphite products
- Carbon processing industry
- Others
By Type
- Solid coal tar pitch
- Liquid coal tar pitch
By Product Type
- Medium temperature
- High temperature
- Low temperature
By Geographical Landscape
- APAC
- Europe
- North America
- Middle East and Africa
- South America
This study identifies the increasing use of advanced types of coal tar pitch as one of the prime reasons driving the coal tar pitch market growth during the next few years. Also, use of coal tar pitch-based needle coke in lithium-ion batteries and use of coal tar pitch in roofing will lead to sizable demand in the market.
The report on the coal tar pitch market covers the following areas:
- Coal Tar Pitch Market sizing
- Coal Tar Pitch Market forecast
- Coal Tar Pitch Market industry analysis
The robust vendor analysis is designed to help clients improve their market position, and in line with this, this report provides a detailed analysis of several leading coal tar pitch market vendors that include Aparna Carbons Pvt. Ltd., Bilbaina de Alquitranes SA, China Risun Group Ltd., China Steel Chemical Corp., Coopers Creek Chemical Corp., DEZA AS, Himadri Speciality Chemical Ltd., JFE Holdings Inc., Jining Carbon Group Co. Ltd., Konark Tar Products Pvt. Ltd., Koppers Holdings Inc., Lone Star Specialties LLC, Mitsubishi Chemical Corp., Nippon Steel Corp., NLMK Group, Quimica del Nalon SA, Rain Carbon Inc., Shree Shyam Chemicals, Sumitomo Chemical Co. Ltd., and Vanajaa Enterprises. Also, the coal tar pitch market analysis report includes information on upcoming trends and challenges that will influence market growth. This is to help companies strategize and leverage all forthcoming growth opportunities.
The publisher presents a detailed picture of the market by the way of study, synthesis, and summation of data from multiple sources by an analysis of key parameters such as profit, pricing, competition, and promotions. It presents various market facets by identifying the key industry influencers. The data presented is comprehensive, reliable, and a result of extensive primary and secondary research. The market research reports provide a complete competitive landscape and an in-depth vendor selection methodology and analysis using qualitative and quantitative research to forecast accurate market growth.
Table of Contents
1 Executive Summary
- 1.1 Market overview
- Executive Summary - Chart on Market Overview
- Executive Summary - Data Table on Market Overview
- Executive Summary - Chart on Global Market Characteristics
- Executive Summary - Chart on Market By Geographical Landscape
- Executive Summary - Chart on Market Segmentation by Application
- Executive Summary - Chart on Market Segmentation by Type
- Executive Summary - Chart on Market Segmentation by Product Type
- Executive Summary - Chart on Incremental Growth
- Executive Summary - Data Table on Incremental Growth
- Executive Summary - Chart on Company Market Positioning
2 Technavio Analysis
- 2.1 Analysis of price sensitivity, lifecycle, customer purchase basket, adoption rates, and purchase criteria
- Analysis of price sensitivity, lifecycle, customer purchase basket, adoption rates, and purchase criteria
- 2.2 Criticality of inputs and Factors of differentiation
- Overview on criticality of inputs and factors of differentiation
- 2.3 Factors of disruption
- Overview on factors of disruption
- 2.4 Impact of drivers and challenges
- Impact of drivers and challenges in 2024 and 2029
3 Market Landscape
- 3.1 Market ecosystem
- Parent Market
- Data Table on - Parent Market
- 3.2 Market characteristics
- Market characteristics analysis
- 3.3 Value chain analysis
- Value chain analysis
4 Market Sizing
- 4.1 Market definition
- Offerings of companies included in the market definition
- 4.2 Market segment analysis
- Market segments
- 4.3 Market size 2024
- 4.4 Market outlook: Forecast for 2024-2029
- Chart on Global - Market size and forecast 2024-2029 ($ million)
- Data Table on Global - Market size and forecast 2024-2029 ($ million)
- Chart on Global Market: Year-over-year growth 2024-2029 (%)
- Data Table on Global Market: Year-over-year growth 2024-2029 (%)
5 Historic Market Size
- 5.1 Global Coal Tar Pitch Market 2019 - 2023
- Historic Market Size - Data Table on Global Coal Tar Pitch Market 2019 - 2023 ($ million)
- 5.2 Application segment analysis 2019 - 2023
- Historic Market Size - Application Segment 2019 - 2023 ($ million)
- 5.3 Type segment analysis 2019 - 2023
- Historic Market Size - Type Segment 2019 - 2023 ($ million)
- 5.4 Product Type segment analysis 2019 - 2023
- Historic Market Size - Product Type Segment 2019 - 2023 ($ million)
- 5.5 Geography segment analysis 2019 - 2023
- Historic Market Size - Geography Segment 2019 - 2023 ($ million)
- 5.6 Country segment analysis 2019 - 2023
- Historic Market Size - Country Segment 2019 - 2023 ($ million)
6 Qualitative Analysis
- 6.1 The impact of AI in the global coal tar pitch market
7 Five Forces Analysis
- 7.1 Five forces summary
- Five forces analysis - Comparison between 2024 and 2029
- 7.2 Bargaining power of buyers
- Bargaining power of buyers - Impact of key factors 2024 and 2029
- 7.3 Bargaining power of suppliers
- Bargaining power of suppliers - Impact of key factors in 2024 and 2029
- 7.4 Threat of new entrants
- Threat of new entrants - Impact of key factors in 2024 and 2029
- 7.5 Threat of substitutes
- Threat of substitutes - Impact of key factors in 2024 and 2029
- 7.6 Threat of rivalry
- Threat of rivalry - Impact of key factors in 2024 and 2029
- 7.7 Market condition
- Chart on Market condition - Five forces 2024 and 2029
8 Market Segmentation by Application
- 8.1 Market segments
- Chart on Application - Market share 2024-2029 (%)
- Data Table on Application - Market share 2024-2029 (%)
- 8.2 Comparison by Application
- Chart on Comparison by Application
- Data Table on Comparison by Application
- 8.3 Aluminum production - Market size and forecast 2024-2029
- Chart on Aluminum production - Market size and forecast 2024-2029 ($ million)
- Data Table on Aluminum production - Market size and forecast 2024-2029 ($ million)
- Chart on Aluminum production - Year-over-year growth 2024-2029 (%)
- Data Table on Aluminum production - Year-over-year growth 2024-2029 (%)
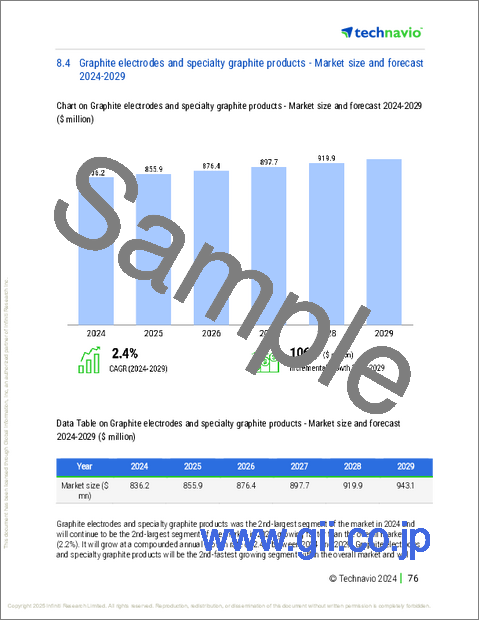
- 8.4 Graphite electrodes and specialty graphite products - Market size and forecast 2024-2029
- Chart on Graphite electrodes and specialty graphite products - Market size and forecast 2024-2029 ($ million)
- Data Table on Graphite electrodes and specialty graphite products - Market size and forecast 2024-2029 ($ million)
- Chart on Graphite electrodes and specialty graphite products - Year-over-year growth 2024-2029 (%)
- Data Table on Graphite electrodes and specialty graphite products - Year-over-year growth 2024-2029 (%)
- 8.5 Carbon processing industry - Market size and forecast 2024-2029
- Chart on Carbon processing industry - Market size and forecast 2024-2029 ($ million)
- Data Table on Carbon processing industry - Market size and forecast 2024-2029 ($ million)
- Chart on Carbon processing industry - Year-over-year growth 2024-2029 (%)
- Data Table on Carbon processing industry - Year-over-year growth 2024-2029 (%)
- 8.6 Others - Market size and forecast 2024-2029
- Chart on Others - Market size and forecast 2024-2029 ($ million)
- Data Table on Others - Market size and forecast 2024-2029 ($ million)
- Chart on Others - Year-over-year growth 2024-2029 (%)
- Data Table on Others - Year-over-year growth 2024-2029 (%)
- 8.7 Market opportunity by Application
- Market opportunity by Application ($ million)
- Data Table on Market opportunity by Application ($ million)
9 Market Segmentation by Type
- 9.1 Market segments
- Chart on Type - Market share 2024-2029 (%)
- Data Table on Type - Market share 2024-2029 (%)
- 9.2 Comparison by Type
- Chart on Comparison by Type
- Data Table on Comparison by Type
- 9.3 Solid coal tar pitch - Market size and forecast 2024-2029
- Chart on Solid coal tar pitch - Market size and forecast 2024-2029 ($ million)
- Data Table on Solid coal tar pitch - Market size and forecast 2024-2029 ($ million)
- Chart on Solid coal tar pitch - Year-over-year growth 2024-2029 (%)
- Data Table on Solid coal tar pitch - Year-over-year growth 2024-2029 (%)
- 9.4 Liquid coal tar pitch - Market size and forecast 2024-2029
- Chart on Liquid coal tar pitch - Market size and forecast 2024-2029 ($ million)
- Data Table on Liquid coal tar pitch - Market size and forecast 2024-2029 ($ million)
- Chart on Liquid coal tar pitch - Year-over-year growth 2024-2029 (%)
- Data Table on Liquid coal tar pitch - Year-over-year growth 2024-2029 (%)
- 9.5 Market opportunity by Type
- Market opportunity by Type ($ million)
- Data Table on Market opportunity by Type ($ million)
10 Market Segmentation by Product Type
- 10.1 Market segments
- Chart on Product Type - Market share 2024-2029 (%)
- Data Table on Product Type - Market share 2024-2029 (%)
- 10.2 Comparison by Product Type
- Chart on Comparison by Product Type
- Data Table on Comparison by Product Type
- 10.3 Medium temperature - Market size and forecast 2024-2029
- Chart on Medium temperature - Market size and forecast 2024-2029 ($ million)
- Data Table on Medium temperature - Market size and forecast 2024-2029 ($ million)
- Chart on Medium temperature - Year-over-year growth 2024-2029 (%)
- Data Table on Medium temperature - Year-over-year growth 2024-2029 (%)
- 10.4 High temperature - Market size and forecast 2024-2029
- Chart on High temperature - Market size and forecast 2024-2029 ($ million)
- Data Table on High temperature - Market size and forecast 2024-2029 ($ million)
- Chart on High temperature - Year-over-year growth 2024-2029 (%)
- Data Table on High temperature - Year-over-year growth 2024-2029 (%)
- 10.5 Low temperature - Market size and forecast 2024-2029
- Chart on Low temperature - Market size and forecast 2024-2029 ($ million)
- Data Table on Low temperature - Market size and forecast 2024-2029 ($ million)
- Chart on Low temperature - Year-over-year growth 2024-2029 (%)
- Data Table on Low temperature - Year-over-year growth 2024-2029 (%)
- 10.6 Market opportunity by Product Type
- Market opportunity by Product Type ($ million)
- Data Table on Market opportunity by Product Type ($ million)
11 Customer Landscape
- 11.1 Customer landscape overview
- Analysis of price sensitivity, lifecycle, customer purchase basket, adoption rates, and purchase criteria
12 Geographic Landscape
- 12.1 Geographic segmentation
- Chart on Market share By Geographical Landscape 2024-2029 (%)
- Data Table on Market share By Geographical Landscape 2024-2029 (%)
- 12.2 Geographic comparison
- Chart on Geographic comparison
- Data Table on Geographic comparison
- 12.3 APAC - Market size and forecast 2024-2029
- Chart on APAC - Market size and forecast 2024-2029 ($ million)
- Data Table on APAC - Market size and forecast 2024-2029 ($ million)
- Chart on APAC - Year-over-year growth 2024-2029 (%)
- Data Table on APAC - Year-over-year growth 2024-2029 (%)
- 12.4 Europe - Market size and forecast 2024-2029
- Chart on Europe - Market size and forecast 2024-2029 ($ million)
- Data Table on Europe - Market size and forecast 2024-2029 ($ million)
- Chart on Europe - Year-over-year growth 2024-2029 (%)
- Data Table on Europe - Year-over-year growth 2024-2029 (%)
- 12.5 North America - Market size and forecast 2024-2029
- Chart on North America - Market size and forecast 2024-2029 ($ million)
- Data Table on North America - Market size and forecast 2024-2029 ($ million)
- Chart on North America - Year-over-year growth 2024-2029 (%)
- Data Table on North America - Year-over-year growth 2024-2029 (%)
- 12.6 Middle East and Africa - Market size and forecast 2024-2029
- Chart on Middle East and Africa - Market size and forecast 2024-2029 ($ million)
- Data Table on Middle East and Africa - Market size and forecast 2024-2029 ($ million)
- Chart on Middle East and Africa - Year-over-year growth 2024-2029 (%)
- Data Table on Middle East and Africa - Year-over-year growth 2024-2029 (%)
- 12.7 South America - Market size and forecast 2024-2029
- Chart on South America - Market size and forecast 2024-2029 ($ million)
- Data Table on South America - Market size and forecast 2024-2029 ($ million)
- Chart on South America - Year-over-year growth 2024-2029 (%)
- Data Table on South America - Year-over-year growth 2024-2029 (%)
- 12.8 China - Market size and forecast 2024-2029
- Chart on China - Market size and forecast 2024-2029 ($ million)
- Data Table on China - Market size and forecast 2024-2029 ($ million)
- Chart on China - Year-over-year growth 2024-2029 (%)
- Data Table on China - Year-over-year growth 2024-2029 (%)
- 12.9 India - Market size and forecast 2024-2029
- Chart on India - Market size and forecast 2024-2029 ($ million)
- Data Table on India - Market size and forecast 2024-2029 ($ million)
- Chart on India - Year-over-year growth 2024-2029 (%)
- Data Table on India - Year-over-year growth 2024-2029 (%)
- 12.10 Japan - Market size and forecast 2024-2029
- Chart on Japan - Market size and forecast 2024-2029 ($ million)
- Data Table on Japan - Market size and forecast 2024-2029 ($ million)
- Chart on Japan - Year-over-year growth 2024-2029 (%)
- Data Table on Japan - Year-over-year growth 2024-2029 (%)
- 12.11 US - Market size and forecast 2024-2029
- Chart on US - Market size and forecast 2024-2029 ($ million)
- Data Table on US - Market size and forecast 2024-2029 ($ million)
- Chart on US - Year-over-year growth 2024-2029 (%)
- Data Table on US - Year-over-year growth 2024-2029 (%)
- 12.12 Russia - Market size and forecast 2024-2029
- Chart on Russia - Market size and forecast 2024-2029 ($ million)
- Data Table on Russia - Market size and forecast 2024-2029 ($ million)
- Chart on Russia - Year-over-year growth 2024-2029 (%)
- Data Table on Russia - Year-over-year growth 2024-2029 (%)
- 12.13 South Korea - Market size and forecast 2024-2029
- Chart on South Korea - Market size and forecast 2024-2029 ($ million)
- Data Table on South Korea - Market size and forecast 2024-2029 ($ million)
- Chart on South Korea - Year-over-year growth 2024-2029 (%)
- Data Table on South Korea - Year-over-year growth 2024-2029 (%)
- 12.14 Germany - Market size and forecast 2024-2029
- Chart on Germany - Market size and forecast 2024-2029 ($ million)
- Data Table on Germany - Market size and forecast 2024-2029 ($ million)
- Chart on Germany - Year-over-year growth 2024-2029 (%)
- Data Table on Germany - Year-over-year growth 2024-2029 (%)
- 12.15 United Arab Emirates - Market size and forecast 2024-2029
- Chart on United Arab Emirates - Market size and forecast 2024-2029 ($ million)
- Data Table on United Arab Emirates - Market size and forecast 2024-2029 ($ million)
- Chart on United Arab Emirates - Year-over-year growth 2024-2029 (%)
- Data Table on United Arab Emirates - Year-over-year growth 2024-2029 (%)
- 12.16 UK - Market size and forecast 2024-2029
- Chart on UK - Market size and forecast 2024-2029 ($ million)
- Data Table on UK - Market size and forecast 2024-2029 ($ million)
- Chart on UK - Year-over-year growth 2024-2029 (%)
- Data Table on UK - Year-over-year growth 2024-2029 (%)
- 12.17 Brazil - Market size and forecast 2024-2029
- Chart on Brazil - Market size and forecast 2024-2029 ($ million)
- Data Table on Brazil - Market size and forecast 2024-2029 ($ million)
- Chart on Brazil - Year-over-year growth 2024-2029 (%)
- Data Table on Brazil - Year-over-year growth 2024-2029 (%)
- 12.18 Market opportunity By Geographical Landscape
- Market opportunity By Geographical Landscape ($ million)
- Data Tables on Market opportunity By Geographical Landscape ($ million)
13 Drivers, Challenges, and Opportunity/Restraints
- 13.1 Market drivers
- 13.2 Market challenges
- 13.3 Impact of drivers and challenges
- Impact of drivers and challenges in 2024 and 2029
- 13.4 Market opportunities/restraints
14 Competitive Landscape
- 14.1 Overview
- 14.2 Competitive Landscape
- Overview on criticality of inputs and factors of differentiation
- 14.3 Landscape disruption
- Overview on factors of disruption
- 14.4 Industry risks
- Impact of key risks on business
15 Competitive Analysis
- 15.1 Companies profiled
- Companies covered
- 15.2 Company ranking index
- Company ranking index
- 15.3 Market positioning of companies
- Matrix on companies position and classification
- 15.4 Aparna Carbons Pvt. Ltd.
- Aparna Carbons Pvt. Ltd. - Overview
- Aparna Carbons Pvt. Ltd. - Product / Service
- Aparna Carbons Pvt. Ltd. - Key offerings
- SWOT
- 15.5 China Risun Group Ltd.
- China Risun Group Ltd. - Overview
- China Risun Group Ltd. - Business segments
- China Risun Group Ltd. - Key offerings
- China Risun Group Ltd. - Segment focus
- SWOT
- 15.6 China Steel Chemical Corp.
- China Steel Chemical Corp. - Overview
- China Steel Chemical Corp. - Business segments
- China Steel Chemical Corp. - Key offerings
- China Steel Chemical Corp. - Segment focus
- SWOT
- 15.7 Coopers Creek Chemical Corp.
- Coopers Creek Chemical Corp. - Overview
- Coopers Creek Chemical Corp. - Product / Service
- Coopers Creek Chemical Corp. - Key offerings
- SWOT
- 15.8 DEZA AS
- DEZA AS - Overview
- DEZA AS - Product / Service
- DEZA AS - Key offerings
- SWOT
- 15.9 Himadri Speciality Chemical Ltd.
- Himadri Speciality Chemical Ltd. - Overview
- Himadri Speciality Chemical Ltd. - Business segments
- Himadri Speciality Chemical Ltd. - Key offerings
- Himadri Speciality Chemical Ltd. - Segment focus
- SWOT
- 15.10 JFE Holdings Inc.
- JFE Holdings Inc. - Overview
- JFE Holdings Inc. - Business segments
- JFE Holdings Inc. - Key news
- JFE Holdings Inc. - Key offerings
- JFE Holdings Inc. - Segment focus
- SWOT
- 15.11 Jining Carbon Group Co. Ltd.
- Jining Carbon Group Co. Ltd. - Overview
- Jining Carbon Group Co. Ltd. - Product / Service
- Jining Carbon Group Co. Ltd. - Key offerings
- SWOT
- 15.12 Koppers Holdings Inc.
- Koppers Holdings Inc. - Overview
- Koppers Holdings Inc. - Business segments
- Koppers Holdings Inc. - Key offerings
- Koppers Holdings Inc. - Segment focus
- SWOT
- 15.13 Mitsubishi Chemical Corp.
- Mitsubishi Chemical Corp. - Overview
- Mitsubishi Chemical Corp. - Business segments
- Mitsubishi Chemical Corp. - Key offerings
- Mitsubishi Chemical Corp. - Segment focus
- SWOT
- 15.14 Nippon Steel Corp.
- Nippon Steel Corp. - Overview
- Nippon Steel Corp. - Business segments
- Nippon Steel Corp. - Key news
- Nippon Steel Corp. - Key offerings
- Nippon Steel Corp. - Segment focus
- SWOT
- 15.15 NLMK Group
- NLMK Group - Overview
- NLMK Group - Product / Service
- NLMK Group - Key offerings
- SWOT
- 15.16 Quimica del Nalon SA
- Quimica del Nalon SA - Overview
- Quimica del Nalon SA - Product / Service
- Quimica del Nalon SA - Key offerings
- SWOT
- 15.17 Rain Carbon Inc.
- Rain Carbon Inc. - Overview
- Rain Carbon Inc. - Product / Service
- Rain Carbon Inc. - Key offerings
- SWOT
- 15.18 Sumitomo Chemical Co. Ltd.
- Sumitomo Chemical Co. Ltd. - Overview
- Sumitomo Chemical Co. Ltd. - Business segments
- Sumitomo Chemical Co. Ltd. - Key offerings
- Sumitomo Chemical Co. Ltd. - Segment focus
- SWOT
16 Appendix
- 16.1 Scope of the report
- 16.2 Inclusions and exclusions checklist
- Inclusions checklist
- Exclusions checklist
- 16.3 Currency conversion rates for US$
- Currency conversion rates for US$
- 16.4 Research methodology
- Research methodology
- 16.5 Data procurement
- Information sources
- 16.6 Data validation
- Data validation
- 16.7 Validation techniques employed for market sizing
- Validation techniques employed for market sizing
- 16.8 Data synthesis
- Data synthesis
- 16.9 360 degree market analysis
- 360 degree market analysis
- 16.10 List of abbreviations
- List of abbreviations

