|
|
市場調査レポート
商品コード
1697273
半導体IPの世界市場 2025~2029年Global Semiconductor IP Market 2025-2029 |
||||||

|
|||||||
カスタマイズ可能
|
|||||||


| 半導体IPの世界市場 2025~2029年 |
|
出版日: 2025年03月28日
発行: TechNavio
ページ情報: 英文 261 Pages
納期: 即納可能
|

全表示
- 概要
- 図表
- 目次
半導体IP市場は2024-2029年に30億6,600万米ドル、予測期間中のCAGRは7.8%で成長すると予測されます。
当レポートでは、半導体IP市場の全体的な分析、市場規模・予測、動向、成長促進要因、課題、約25のベンダーを網羅したベンダー分析などを掲載しています。
現在の市場シナリオ、最新動向と促進要因、市場環境全体に関する最新分析を提供しています。同市場は、複雑なチップ設計とマルチコア技術の使用、最新のSoCチップの需要増加、モバイルコンピューティングデバイスの需要拡大が牽引しています。
| 市場範囲 | |
|---|---|
| 基準年 | 2025 |
| 終了年 | 2029 |
| 予測期間 | 2025-2029 |
| 成長モメンタム | 加速 |
| 前年比2025年 | 7.1% |
| CAGR | 7.8% |
| 増分額 | 30億6,600万米ドル |
本調査は、業界の主要参加者からのインプットを含め、一次情報と二次情報を客観的に組み合わせて実施しました。レポートには、主要企業の分析に加え、包括的な市場規模データ、地域別分析によるセグメント、ベンダー情勢が含まれています。レポートには過去データと予測データがあります。
本調査では、今後数年間の半導体IP市場の成長を促進する主な理由の一つとして、ナノフォトニックICsの出現を挙げています。また、IoTの出現と車載ネットワークの成長は市場の大きな需要につながります。
目次
第1章 エグゼクティブサマリー
- 市場概要
第2章 Technavio分析
- 価格・ライフサイクル・顧客購入バスケット・採用率・購入基準の分析
- インプットの重要性と差別化の要因
- 混乱の要因
- 促進要因と課題の影響
第3章 市場情勢
- 市場エコシステム
- 市場の特徴
- バリューチェーン分析
第4章 市場規模
- 市場の定義
- 市場セグメント分析
- 市場規模 2024
- 市場の見通し 2024-2029
第5章 市場規模実績
- 半導体IPの世界市場 2019-2023
- エンドユーザー別セグメント分析 2019-2023
- 用途別セグメント分析 2019-2023
- フォームファクター別セグメント分析 2019-2023
- タイプ別セグメント分析 2019-2023
- 製品タイプ別セグメント分析 2019-2023
- 地域別セグメント分析 2019-2023
- 国別セグメント分析 2019-2023
第6章 定性分析
- AIの影響半導体IPの世界市場
第7章 ファイブフォース分析
- ファイブフォースの要約
- 買い手の交渉力
- 供給企業の交渉力
- 新規参入業者の脅威
- 代替品の脅威
- 競争の脅威
- 市況
第8章 市場セグメンテーション:エンドユーザー別
- 市場セグメント
- 比較:エンドユーザー別
- ファブレス:市場規模と予測 2024-2029
- IDM:市場規模と予測 2024-2029
- 鋳造:市場規模と予測 2024-2029
- 市場機会:エンドユーザー別
第9章 市場セグメンテーション:用途別
- 市場セグメント
- 比較:用途別
- モバイルコンピューティングデバイス:市場規模と予測 2024-2029
- 家電:市場規模と予測 2024-2029
- 自動車:市場規模と予測 2024-2029
- 産業オートメーション:市場規模と予測 2024-2029
- その他:市場規模と予測 2024-2029
- 市場機会:用途別
第10章 市場セグメンテーション:フォームファクター別
- 市場セグメント
- 比較:フォームファクター別
- プロセッサIP:市場規模と予測 2024-2029
- 物理IP:市場規模と予測 2024-2029
- デジタルIP:市場規模と予測 2024-2029
- 市場機会:フォームファクター別
第11章 市場セグメンテーション:タイプ別
- 市場セグメント
- 比較:タイプ別
- ロイヤリティ:市場規模と予測 2024-2029
- ライセンス供与:市場規模と予測 2024-2029
- 市場機会:タイプ別
第12章 市場セグメンテーション:製品タイプ別
- 市場セグメント
- 比較:製品タイプ別
- ソフトIPコア:市場規模と予測 2024-2029
- ハードIPコア:市場規模と予測 2024-2029
- 市場機会:製品タイプ別
第13章 顧客情勢
- 顧客情勢の概要
第14章 地域別情勢
- 地域別セグメンテーション
- 地域別比較
- 北米:市場規模と予測 2024-2029
- アジア太平洋:市場規模と予測 2024-2029
- 欧州:市場規模と予測 2024-2029
- 南米:市場規模と予測 2024-2029
- 中東・アフリカ:市場規模と予測 2024-2029
- 米国:市場規模と予測 2024-2029
- 英国:市場規模と予測 2024-2029
- 中国:市場規模と予測 2024-2029
- 日本:市場規模と予測 2024-2029
- 韓国:市場規模と予測 2024-2029
- 台湾:市場規模と予測 2024-2029
- フランス:市場規模と予測 2024-2029
- ドイツ:市場規模と予測 2024-2029
- オランダ:市場規模と予測 2024-2029
- スイス:市場規模と予測 2024-2029
- 市場機会:地域情勢別
第15章 促進要因・課題・機会・抑制要因
- 市場促進要因
- 市場の課題
- 促進要因と課題の影響
- 市場の機会・抑制要因
第16章 競合情勢
- 概要
- 競合情勢
- 混乱の状況
- 業界のリスク
第17章 競合分析
- 企業プロファイル
- 企業ランキング指数
- 企業の市場ポジショニング
- Achronix Semiconductor Corp.
- Advanced Micro Devices Inc.
- Arm Ltd.
- Cadence Design Systems Inc.
- CAST Inc.
- CEVA Inc.
- Dolphin Design SAS
- eMemory Technology Inc.
- Imagination Technologies Ltd.
- Lattice Semiconductor Corp.
- Perceptia Devices Australia
- Rambus Inc.
- Siemens AG
- Synopsys Inc.
- VeriSilicon Microelectronics Shanghai Co. Ltd.
第18章 付録
Exhibits:
- Exhibits1: Executive Summary - Chart on Market Overview
- Exhibits2: Executive Summary - Data Table on Market Overview
- Exhibits3: Executive Summary - Chart on Global Market Characteristics
- Exhibits4: Executive Summary - Chart on Market By Geographical Landscape
- Exhibits5: Executive Summary - Chart on Market Segmentation by End-user
- Exhibits6: Executive Summary - Chart on Market Segmentation by Application
- Exhibits7: Executive Summary - Chart on Market Segmentation by Form Factor
- Exhibits8: Executive Summary - Chart on Market Segmentation by Type
- Exhibits9: Executive Summary - Chart on Market Segmentation by Product Type
- Exhibits10: Executive Summary - Chart on Incremental Growth
- Exhibits11: Executive Summary - Data Table on Incremental Growth
- Exhibits12: Executive Summary - Chart on Company Market Positioning
- Exhibits13: Analysis of price sensitivity, lifecycle, customer purchase basket, adoption rates, and purchase criteria
- Exhibits14: Overview on criticality of inputs and factors of differentiation
- Exhibits15: Overview on factors of disruption
- Exhibits16: Impact of drivers and challenges in 2024 and 2029
- Exhibits17: Parent Market
- Exhibits18: Data Table on - Parent Market
- Exhibits19: Market characteristics analysis
- Exhibits20: Value chain analysis
- Exhibits21: Offerings of companies included in the market definition
- Exhibits22: Market segments
- Exhibits23: Chart on Global - Market size and forecast 2024-2029 ($ million)
- Exhibits24: Data Table on Global - Market size and forecast 2024-2029 ($ million)
- Exhibits25: Chart on Global Market: Year-over-year growth 2024-2029 (%)
- Exhibits26: Data Table on Global Market: Year-over-year growth 2024-2029 (%)
- Exhibits27: Historic Market Size - Data Table on Global Semiconductor IP Market 2019 - 2023 ($ million)
- Exhibits28: Historic Market Size - End-user Segment 2019 - 2023 ($ million)
- Exhibits29: Historic Market Size - Application Segment 2019 - 2023 ($ million)
- Exhibits30: Historic Market Size - Form Factor Segment 2019 - 2023 ($ million)
- Exhibits31: Historic Market Size - Type Segment 2019 - 2023 ($ million)
- Exhibits32: Historic Market Size - Product Type Segment 2019 - 2023 ($ million)
- Exhibits33: Historic Market Size - Geography Segment 2019 - 2023 ($ million)
- Exhibits34: Historic Market Size - Country Segment 2019 - 2023 ($ million)
- Exhibits35: Five forces analysis - Comparison between 2024 and 2029
- Exhibits36: Bargaining power of buyers - Impact of key factors 2024 and 2029
- Exhibits37: Bargaining power of suppliers - Impact of key factors in 2024 and 2029
- Exhibits38: Threat of new entrants - Impact of key factors in 2024 and 2029
- Exhibits39: Threat of substitutes - Impact of key factors in 2024 and 2029
- Exhibits40: Threat of rivalry - Impact of key factors in 2024 and 2029
- Exhibits41: Chart on Market condition - Five forces 2024 and 2029
- Exhibits42: Chart on End-user - Market share 2024-2029 (%)
- Exhibits43: Data Table on End-user - Market share 2024-2029 (%)
- Exhibits44: Chart on Comparison by End-user
- Exhibits45: Data Table on Comparison by End-user
- Exhibits46: Chart on Fabless - Market size and forecast 2024-2029 ($ million)
- Exhibits47: Data Table on Fabless - Market size and forecast 2024-2029 ($ million)
- Exhibits48: Chart on Fabless - Year-over-year growth 2024-2029 (%)
- Exhibits49: Data Table on Fabless - Year-over-year growth 2024-2029 (%)
- Exhibits50: Chart on IDMs - Market size and forecast 2024-2029 ($ million)
- Exhibits51: Data Table on IDMs - Market size and forecast 2024-2029 ($ million)
- Exhibits52: Chart on IDMs - Year-over-year growth 2024-2029 (%)
- Exhibits53: Data Table on IDMs - Year-over-year growth 2024-2029 (%)
- Exhibits54: Chart on Foundries - Market size and forecast 2024-2029 ($ million)
- Exhibits55: Data Table on Foundries - Market size and forecast 2024-2029 ($ million)
- Exhibits56: Chart on Foundries - Year-over-year growth 2024-2029 (%)
- Exhibits57: Data Table on Foundries - Year-over-year growth 2024-2029 (%)
- Exhibits58: Market opportunity by End-user ($ million)
- Exhibits59: Data Table on Market opportunity by End-user ($ million)
- Exhibits60: Chart on Application - Market share 2024-2029 (%)
- Exhibits61: Data Table on Application - Market share 2024-2029 (%)
- Exhibits62: Chart on Comparison by Application
- Exhibits63: Data Table on Comparison by Application
- Exhibits64: Chart on Mobile computing devices - Market size and forecast 2024-2029 ($ million)
- Exhibits65: Data Table on Mobile computing devices - Market size and forecast 2024-2029 ($ million)
- Exhibits66: Chart on Mobile computing devices - Year-over-year growth 2024-2029 (%)
- Exhibits67: Data Table on Mobile computing devices - Year-over-year growth 2024-2029 (%)
- Exhibits68: Chart on Consumer electronics - Market size and forecast 2024-2029 ($ million)
- Exhibits69: Data Table on Consumer electronics - Market size and forecast 2024-2029 ($ million)
- Exhibits70: Chart on Consumer electronics - Year-over-year growth 2024-2029 (%)
- Exhibits71: Data Table on Consumer electronics - Year-over-year growth 2024-2029 (%)
- Exhibits72: Chart on Automotive - Market size and forecast 2024-2029 ($ million)
- Exhibits73: Data Table on Automotive - Market size and forecast 2024-2029 ($ million)
- Exhibits74: Chart on Automotive - Year-over-year growth 2024-2029 (%)
- Exhibits75: Data Table on Automotive - Year-over-year growth 2024-2029 (%)
- Exhibits76: Chart on Industrial automation - Market size and forecast 2024-2029 ($ million)
- Exhibits77: Data Table on Industrial automation - Market size and forecast 2024-2029 ($ million)
- Exhibits78: Chart on Industrial automation - Year-over-year growth 2024-2029 (%)
- Exhibits79: Data Table on Industrial automation - Year-over-year growth 2024-2029 (%)
- Exhibits80: Chart on Others - Market size and forecast 2024-2029 ($ million)
- Exhibits81: Data Table on Others - Market size and forecast 2024-2029 ($ million)
- Exhibits82: Chart on Others - Year-over-year growth 2024-2029 (%)
- Exhibits83: Data Table on Others - Year-over-year growth 2024-2029 (%)
- Exhibits84: Market opportunity by Application ($ million)
- Exhibits85: Data Table on Market opportunity by Application ($ million)
- Exhibits86: Chart on Form Factor - Market share 2024-2029 (%)
- Exhibits87: Data Table on Form Factor - Market share 2024-2029 (%)
- Exhibits88: Chart on Comparison by Form Factor
- Exhibits89: Data Table on Comparison by Form Factor
- Exhibits90: Chart on Processor IP - Market size and forecast 2024-2029 ($ million)
- Exhibits91: Data Table on Processor IP - Market size and forecast 2024-2029 ($ million)
- Exhibits92: Chart on Processor IP - Year-over-year growth 2024-2029 (%)
- Exhibits93: Data Table on Processor IP - Year-over-year growth 2024-2029 (%)
- Exhibits94: Chart on Physical IP - Market size and forecast 2024-2029 ($ million)
- Exhibits95: Data Table on Physical IP - Market size and forecast 2024-2029 ($ million)
- Exhibits96: Chart on Physical IP - Year-over-year growth 2024-2029 (%)
- Exhibits97: Data Table on Physical IP - Year-over-year growth 2024-2029 (%)
- Exhibits98: Chart on Digital IP - Market size and forecast 2024-2029 ($ million)
- Exhibits99: Data Table on Digital IP - Market size and forecast 2024-2029 ($ million)
- Exhibits100: Chart on Digital IP - Year-over-year growth 2024-2029 (%)
- Exhibits101: Data Table on Digital IP - Year-over-year growth 2024-2029 (%)
- Exhibits102: Market opportunity by Form Factor ($ million)
- Exhibits103: Data Table on Market opportunity by Form Factor ($ million)
- Exhibits104: Chart on Type - Market share 2024-2029 (%)
- Exhibits105: Data Table on Type - Market share 2024-2029 (%)
- Exhibits106: Chart on Comparison by Type
- Exhibits107: Data Table on Comparison by Type
- Exhibits108: Chart on Royalty - Market size and forecast 2024-2029 ($ million)
- Exhibits109: Data Table on Royalty - Market size and forecast 2024-2029 ($ million)
- Exhibits110: Chart on Royalty - Year-over-year growth 2024-2029 (%)
- Exhibits111: Data Table on Royalty - Year-over-year growth 2024-2029 (%)
- Exhibits112: Chart on Licensing - Market size and forecast 2024-2029 ($ million)
- Exhibits113: Data Table on Licensing - Market size and forecast 2024-2029 ($ million)
- Exhibits114: Chart on Licensing - Year-over-year growth 2024-2029 (%)
- Exhibits115: Data Table on Licensing - Year-over-year growth 2024-2029 (%)
- Exhibits116: Market opportunity by Type ($ million)
- Exhibits117: Data Table on Market opportunity by Type ($ million)
- Exhibits118: Chart on Product Type - Market share 2024-2029 (%)
- Exhibits119: Data Table on Product Type - Market share 2024-2029 (%)
- Exhibits120: Chart on Comparison by Product Type
- Exhibits121: Data Table on Comparison by Product Type
- Exhibits122: Chart on Soft IP core - Market size and forecast 2024-2029 ($ million)
- Exhibits123: Data Table on Soft IP core - Market size and forecast 2024-2029 ($ million)
- Exhibits124: Chart on Soft IP core - Year-over-year growth 2024-2029 (%)
- Exhibits125: Data Table on Soft IP core - Year-over-year growth 2024-2029 (%)
- Exhibits126: Chart on Hard IP core - Market size and forecast 2024-2029 ($ million)
- Exhibits127: Data Table on Hard IP core - Market size and forecast 2024-2029 ($ million)
- Exhibits128: Chart on Hard IP core - Year-over-year growth 2024-2029 (%)
- Exhibits129: Data Table on Hard IP core - Year-over-year growth 2024-2029 (%)
- Exhibits130: Market opportunity by Product Type ($ million)
- Exhibits131: Data Table on Market opportunity by Product Type ($ million)
- Exhibits132: Analysis of price sensitivity, lifecycle, customer purchase basket, adoption rates, and purchase criteria
- Exhibits133: Chart on Market share By Geographical Landscape 2024-2029 (%)
- Exhibits134: Data Table on Market share By Geographical Landscape 2024-2029 (%)
- Exhibits135: Chart on Geographic comparison
- Exhibits136: Data Table on Geographic comparison
- Exhibits137: Chart on North America - Market size and forecast 2024-2029 ($ million)
- Exhibits138: Data Table on North America - Market size and forecast 2024-2029 ($ million)
- Exhibits139: Chart on North America - Year-over-year growth 2024-2029 (%)
- Exhibits140: Data Table on North America - Year-over-year growth 2024-2029 (%)
- Exhibits141: Chart on APAC - Market size and forecast 2024-2029 ($ million)
- Exhibits142: Data Table on APAC - Market size and forecast 2024-2029 ($ million)
- Exhibits143: Chart on APAC - Year-over-year growth 2024-2029 (%)
- Exhibits144: Data Table on APAC - Year-over-year growth 2024-2029 (%)
- Exhibits145: Chart on Europe - Market size and forecast 2024-2029 ($ million)
- Exhibits146: Data Table on Europe - Market size and forecast 2024-2029 ($ million)
- Exhibits147: Chart on Europe - Year-over-year growth 2024-2029 (%)
- Exhibits148: Data Table on Europe - Year-over-year growth 2024-2029 (%)
- Exhibits149: Chart on South America - Market size and forecast 2024-2029 ($ million)
- Exhibits150: Data Table on South America - Market size and forecast 2024-2029 ($ million)
- Exhibits151: Chart on South America - Year-over-year growth 2024-2029 (%)
- Exhibits152: Data Table on South America - Year-over-year growth 2024-2029 (%)
- Exhibits153: Chart on Middle East and Africa - Market size and forecast 2024-2029 ($ million)
- Exhibits154: Data Table on Middle East and Africa - Market size and forecast 2024-2029 ($ million)
- Exhibits155: Chart on Middle East and Africa - Year-over-year growth 2024-2029 (%)
- Exhibits156: Data Table on Middle East and Africa - Year-over-year growth 2024-2029 (%)
- Exhibits157: Chart on US - Market size and forecast 2024-2029 ($ million)
- Exhibits158: Data Table on US - Market size and forecast 2024-2029 ($ million)
- Exhibits159: Chart on US - Year-over-year growth 2024-2029 (%)
- Exhibits160: Data Table on US - Year-over-year growth 2024-2029 (%)
- Exhibits161: Chart on UK - Market size and forecast 2024-2029 ($ million)
- Exhibits162: Data Table on UK - Market size and forecast 2024-2029 ($ million)
- Exhibits163: Chart on UK - Year-over-year growth 2024-2029 (%)
- Exhibits164: Data Table on UK - Year-over-year growth 2024-2029 (%)
- Exhibits165: Chart on China - Market size and forecast 2024-2029 ($ million)
- Exhibits166: Data Table on China - Market size and forecast 2024-2029 ($ million)
- Exhibits167: Chart on China - Year-over-year growth 2024-2029 (%)
- Exhibits168: Data Table on China - Year-over-year growth 2024-2029 (%)
- Exhibits169: Chart on Japan - Market size and forecast 2024-2029 ($ million)
- Exhibits170: Data Table on Japan - Market size and forecast 2024-2029 ($ million)
- Exhibits171: Chart on Japan - Year-over-year growth 2024-2029 (%)
- Exhibits172: Data Table on Japan - Year-over-year growth 2024-2029 (%)
- Exhibits173: Chart on South Korea - Market size and forecast 2024-2029 ($ million)
- Exhibits174: Data Table on South Korea - Market size and forecast 2024-2029 ($ million)
- Exhibits175: Chart on South Korea - Year-over-year growth 2024-2029 (%)
- Exhibits176: Data Table on South Korea - Year-over-year growth 2024-2029 (%)
- Exhibits177: Chart on Taiwan - Market size and forecast 2024-2029 ($ million)
- Exhibits178: Data Table on Taiwan - Market size and forecast 2024-2029 ($ million)
- Exhibits179: Chart on Taiwan - Year-over-year growth 2024-2029 (%)
- Exhibits180: Data Table on Taiwan - Year-over-year growth 2024-2029 (%)
- Exhibits181: Chart on France - Market size and forecast 2024-2029 ($ million)
- Exhibits182: Data Table on France - Market size and forecast 2024-2029 ($ million)
- Exhibits183: Chart on France - Year-over-year growth 2024-2029 (%)
- Exhibits184: Data Table on France - Year-over-year growth 2024-2029 (%)
- Exhibits185: Chart on Germany - Market size and forecast 2024-2029 ($ million)
- Exhibits186: Data Table on Germany - Market size and forecast 2024-2029 ($ million)
- Exhibits187: Chart on Germany - Year-over-year growth 2024-2029 (%)
- Exhibits188: Data Table on Germany - Year-over-year growth 2024-2029 (%)
- Exhibits189: Chart on The Netherlands - Market size and forecast 2024-2029 ($ million)
- Exhibits190: Data Table on The Netherlands - Market size and forecast 2024-2029 ($ million)
- Exhibits191: Chart on The Netherlands - Year-over-year growth 2024-2029 (%)
- Exhibits192: Data Table on The Netherlands - Year-over-year growth 2024-2029 (%)
- Exhibits193: Chart on Switzerland - Market size and forecast 2024-2029 ($ million)
- Exhibits194: Data Table on Switzerland - Market size and forecast 2024-2029 ($ million)
- Exhibits195: Chart on Switzerland - Year-over-year growth 2024-2029 (%)
- Exhibits196: Data Table on Switzerland - Year-over-year growth 2024-2029 (%)
- Exhibits197: Market opportunity By Geographical Landscape ($ million)
- Exhibits198: Data Tables on Market opportunity By Geographical Landscape ($ million)
- Exhibits199: Impact of drivers and challenges in 2024 and 2029
- Exhibits200: Overview on criticality of inputs and factors of differentiation
- Exhibits201: Overview on factors of disruption
- Exhibits202: Impact of key risks on business
- Exhibits203: Companies covered
- Exhibits204: Company ranking index
- Exhibits205: Matrix on companies position and classification
- Exhibits206: Achronix Semiconductor Corp. - Overview
- Exhibits207: Achronix Semiconductor Corp. - Product / Service
- Exhibits208: Achronix Semiconductor Corp. - Key offerings
- Exhibits209: SWOT
- Exhibits210: Advanced Micro Devices Inc. - Overview
- Exhibits211: Advanced Micro Devices Inc. - Business segments
- Exhibits212: Advanced Micro Devices Inc. - Key news
- Exhibits213: Advanced Micro Devices Inc. - Key offerings
- Exhibits214: Advanced Micro Devices Inc. - Segment focus
- Exhibits215: SWOT
- Exhibits216: Arm Ltd. - Overview
- Exhibits217: Arm Ltd. - Product / Service
- Exhibits218: Arm Ltd. - Key offerings
- Exhibits219: SWOT
- Exhibits220: Cadence Design Systems Inc. - Overview
- Exhibits221: Cadence Design Systems Inc. - Business segments
- Exhibits222: Cadence Design Systems Inc. - Key news
- Exhibits223: Cadence Design Systems Inc. - Key offerings
- Exhibits224: Cadence Design Systems Inc. - Segment focus
- Exhibits225: SWOT
- Exhibits226: CAST Inc. - Overview
- Exhibits227: CAST Inc. - Product / Service
- Exhibits228: CAST Inc. - Key news
- Exhibits229: CAST Inc. - Key offerings
- Exhibits230: SWOT
- Exhibits231: CEVA Inc. - Overview
- Exhibits232: CEVA Inc. - Product / Service
- Exhibits233: CEVA Inc. - Key offerings
- Exhibits234: SWOT
- Exhibits235: Dolphin Design SAS - Overview
- Exhibits236: Dolphin Design SAS - Product / Service
- Exhibits237: Dolphin Design SAS - Key offerings
- Exhibits238: SWOT
- Exhibits239: eMemory Technology Inc. - Overview
- Exhibits240: eMemory Technology Inc. - Product / Service
- Exhibits241: eMemory Technology Inc. - Key offerings
- Exhibits242: SWOT
- Exhibits243: Imagination Technologies Ltd. - Overview
- Exhibits244: Imagination Technologies Ltd. - Product / Service
- Exhibits245: Imagination Technologies Ltd. - Key offerings
- Exhibits246: SWOT
- Exhibits247: Lattice Semiconductor Corp. - Overview
- Exhibits248: Lattice Semiconductor Corp. - Product / Service
- Exhibits249: Lattice Semiconductor Corp. - Key offerings
- Exhibits250: SWOT
- Exhibits251: Perceptia Devices Australia - Overview
- Exhibits252: Perceptia Devices Australia - Product / Service
- Exhibits253: Perceptia Devices Australia - Key offerings
- Exhibits254: SWOT
- Exhibits255: Rambus Inc. - Overview
- Exhibits256: Rambus Inc. - Product / Service
- Exhibits257: Rambus Inc. - Key offerings
- Exhibits258: SWOT
- Exhibits259: Siemens AG - Overview
- Exhibits260: Siemens AG - Business segments
- Exhibits261: Siemens AG - Key news
- Exhibits262: Siemens AG - Key offerings
- Exhibits263: Siemens AG - Segment focus
- Exhibits264: SWOT
- Exhibits265: Synopsys Inc. - Overview
- Exhibits266: Synopsys Inc. - Business segments
- Exhibits267: Synopsys Inc. - Key news
- Exhibits268: Synopsys Inc. - Key offerings
- Exhibits269: Synopsys Inc. - Segment focus
- Exhibits270: SWOT
- Exhibits271: VeriSilicon Microelectronics Shanghai Co. Ltd. - Overview
- Exhibits272: VeriSilicon Microelectronics Shanghai Co. Ltd. - Product / Service
- Exhibits273: VeriSilicon Microelectronics Shanghai Co. Ltd. - Key offerings
- Exhibits274: SWOT
- Exhibits275: Inclusions checklist
- Exhibits276: Exclusions checklist
- Exhibits277: Currency conversion rates for US$
- Exhibits278: Research methodology
- Exhibits279: Information sources
- Exhibits280: Data validation
- Exhibits281: Validation techniques employed for market sizing
- Exhibits282: Data synthesis
- Exhibits283: 360 degree market analysis
- Exhibits284: List of abbreviations
The semiconductor ip market is forecasted to grow by USD 3066 mn during 2024-2029, accelerating at a CAGR of 7.8% during the forecast period. The report on the semiconductor ip market provides a holistic analysis, market size and forecast, trends, growth drivers, and challenges, as well as vendor analysis covering around 25 vendors.
The report offers an up-to-date analysis regarding the current market scenario, the latest trends and drivers, and the overall market environment. The market is driven by complex chip designs and use of multi-core technologies, increasing demand for modern soc chips, and growing demand for mobile computing devices.
| Market Scope | |
|---|---|
| Base Year | 2025 |
| End Year | 2029 |
| Series Year | 2025-2029 |
| Growth Momentum | Accelerate |
| YOY 2025 | 7.1% |
| CAGR | 7.8% |
| Incremental Value | $3066 mn |
The study was conducted using an objective combination of primary and secondary information including inputs from key participants in the industry. The report contains a comprehensive market size data, segment with regional analysis and vendor landscape in addition to an analysis of the key companies. Reports have historic and forecast data.
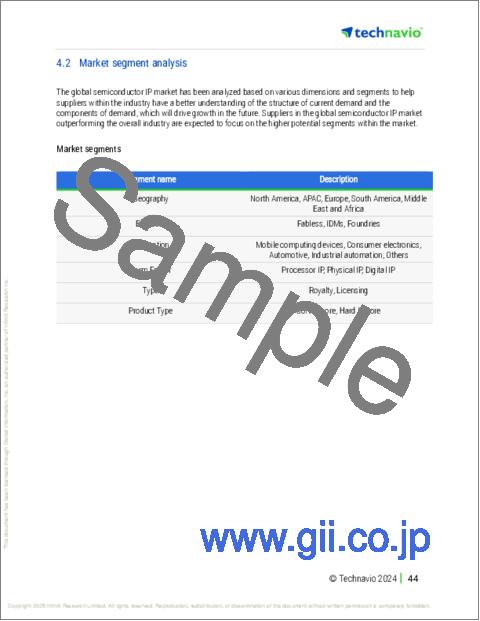
Technavio's semiconductor ip market is segmented as below:
By End-user
- Fabless
- IDMs
- Foundries
By Application
- Mobile computing devices
- Consumer electronics
- Automotive
- Industrial automation
- Others
By Form Factor
- Processor IP
- Physical IP
- Digital IP
By Type
- Royalty
- Licensing
By Product Type
- Soft IP core
- Hard IP core
By Geographical Landscape
- North America
- APAC
- Europe
- South America
- Middle East and Africa
This study identifies the emergence of nanophotonic ics as one of the prime reasons driving the semiconductor ip market growth during the next few years. Also, emergence of iot and growth in in-vehicle networks will lead to sizable demand in the market.
The report on the semiconductor ip market covers the following areas:
- Semiconductor IP Market sizing
- Semiconductor IP Market forecast
- Semiconductor IP Market industry analysis
The robust vendor analysis is designed to help clients improve their market position, and in line with this, this report provides a detailed analysis of several leading semiconductor ip market vendors that include Achronix Semiconductor Corp., Advanced Micro Devices Inc., Alphawave IP Group plc, Arm Ltd., Arteric Inc., Cadence Design Systems Inc., CAST Inc., CEVA Inc., Dolphin Design SAS, Dream Chip Technologies GmbH, eMemory Technology Inc., Faraday Technology Corp., Imagination Technologies Ltd., Lattice Semiconductor Corp., Perceptia Devices Australia, Rambus Inc., Siemens AG, Synopsys Inc., VeriSilicon Microelectronics Shanghai Co. Ltd., and videantis GmbH. Also, the semiconductor ip market analysis report includes information on upcoming trends and challenges that will influence market growth. This is to help companies strategize and leverage all forthcoming growth opportunities.
The publisher presents a detailed picture of the market by the way of study, synthesis, and summation of data from multiple sources by an analysis of key parameters such as profit, pricing, competition, and promotions. It presents various market facets by identifying the key industry influencers. The data presented is comprehensive, reliable, and a result of extensive primary and secondary research. The market research reports provide a complete competitive landscape and an in-depth vendor selection methodology and analysis using qualitative and quantitative research to forecast accurate market growth.
Table of Contents
1 Executive Summary
- 1.1 Market overview
- Executive Summary - Chart on Market Overview
- Executive Summary - Data Table on Market Overview
- Executive Summary - Chart on Global Market Characteristics
- Executive Summary - Chart on Market By Geographical Landscape
- Executive Summary - Chart on Market Segmentation by End-user
- Executive Summary - Chart on Market Segmentation by Application
- Executive Summary - Chart on Market Segmentation by Form Factor
- Executive Summary - Chart on Market Segmentation by Type
- Executive Summary - Chart on Market Segmentation by Product Type
- Executive Summary - Chart on Incremental Growth
- Executive Summary - Data Table on Incremental Growth
- Executive Summary - Chart on Company Market Positioning
2 Technavio Analysis
- 2.1 Analysis of price sensitivity, lifecycle, customer purchase basket, adoption rates, and purchase criteria
- Analysis of price sensitivity, lifecycle, customer purchase basket, adoption rates, and purchase criteria
- 2.2 Criticality of inputs and Factors of differentiation
- Overview on criticality of inputs and factors of differentiation
- 2.3 Factors of disruption
- Overview on factors of disruption
- 2.4 Impact of drivers and challenges
- Impact of drivers and challenges in 2024 and 2029
3 Market Landscape
- 3.1 Market ecosystem
- Parent Market
- Data Table on - Parent Market
- 3.2 Market characteristics
- Market characteristics analysis
- 3.3 Value chain analysis
- Value chain analysis
4 Market Sizing
- 4.1 Market definition
- Offerings of companies included in the market definition
- 4.2 Market segment analysis
- Market segments
- 4.3 Market size 2024
- 4.4 Market outlook: Forecast for 2024-2029
- Chart on Global - Market size and forecast 2024-2029 ($ million)
- Data Table on Global - Market size and forecast 2024-2029 ($ million)
- Chart on Global Market: Year-over-year growth 2024-2029 (%)
- Data Table on Global Market: Year-over-year growth 2024-2029 (%)
5 Historic Market Size
- 5.1 Global Semiconductor IP Market 2019 - 2023
- Historic Market Size - Data Table on Global Semiconductor IP Market 2019 - 2023 ($ million)
- 5.2 End-user segment analysis 2019 - 2023
- Historic Market Size - End-user Segment 2019 - 2023 ($ million)
- 5.3 Application segment analysis 2019 - 2023
- Historic Market Size - Application Segment 2019 - 2023 ($ million)
- 5.4 Form Factor segment analysis 2019 - 2023
- Historic Market Size - Form Factor Segment 2019 - 2023 ($ million)
- 5.5 Type segment analysis 2019 - 2023
- Historic Market Size - Type Segment 2019 - 2023 ($ million)
- 5.6 Product Type segment analysis 2019 - 2023
- Historic Market Size - Product Type Segment 2019 - 2023 ($ million)
- 5.7 Geography segment analysis 2019 - 2023
- Historic Market Size - Geography Segment 2019 - 2023 ($ million)
- 5.8 Country segment analysis 2019 - 2023
- Historic Market Size - Country Segment 2019 - 2023 ($ million)
6 Qualitative Analysis
- 6.1 Impact of AI on the global semiconductor IP market
7 Five Forces Analysis
- 7.1 Five forces summary
- Five forces analysis - Comparison between 2024 and 2029
- 7.2 Bargaining power of buyers
- Bargaining power of buyers - Impact of key factors 2024 and 2029
- 7.3 Bargaining power of suppliers
- Bargaining power of suppliers - Impact of key factors in 2024 and 2029
- 7.4 Threat of new entrants
- Threat of new entrants - Impact of key factors in 2024 and 2029
- 7.5 Threat of substitutes
- Threat of substitutes - Impact of key factors in 2024 and 2029
- 7.6 Threat of rivalry
- Threat of rivalry - Impact of key factors in 2024 and 2029
- 7.7 Market condition
- Chart on Market condition - Five forces 2024 and 2029
8 Market Segmentation by End-user
- 8.1 Market segments
- Chart on End-user - Market share 2024-2029 (%)
- Data Table on End-user - Market share 2024-2029 (%)
- 8.2 Comparison by End-user
- Chart on Comparison by End-user
- Data Table on Comparison by End-user
- 8.3 Fabless - Market size and forecast 2024-2029
- Chart on Fabless - Market size and forecast 2024-2029 ($ million)
- Data Table on Fabless - Market size and forecast 2024-2029 ($ million)
- Chart on Fabless - Year-over-year growth 2024-2029 (%)
- Data Table on Fabless - Year-over-year growth 2024-2029 (%)
- 8.4 IDMs - Market size and forecast 2024-2029
- Chart on IDMs - Market size and forecast 2024-2029 ($ million)
- Data Table on IDMs - Market size and forecast 2024-2029 ($ million)
- Chart on IDMs - Year-over-year growth 2024-2029 (%)
- Data Table on IDMs - Year-over-year growth 2024-2029 (%)
- 8.5 Foundries - Market size and forecast 2024-2029
- Chart on Foundries - Market size and forecast 2024-2029 ($ million)
- Data Table on Foundries - Market size and forecast 2024-2029 ($ million)
- Chart on Foundries - Year-over-year growth 2024-2029 (%)
- Data Table on Foundries - Year-over-year growth 2024-2029 (%)
- 8.6 Market opportunity by End-user
- Market opportunity by End-user ($ million)
- Data Table on Market opportunity by End-user ($ million)
9 Market Segmentation by Application
- 9.1 Market segments
- Chart on Application - Market share 2024-2029 (%)
- Data Table on Application - Market share 2024-2029 (%)
- 9.2 Comparison by Application
- Chart on Comparison by Application
- Data Table on Comparison by Application
- 9.3 Mobile computing devices - Market size and forecast 2024-2029
- Chart on Mobile computing devices - Market size and forecast 2024-2029 ($ million)
- Data Table on Mobile computing devices - Market size and forecast 2024-2029 ($ million)
- Chart on Mobile computing devices - Year-over-year growth 2024-2029 (%)
- Data Table on Mobile computing devices - Year-over-year growth 2024-2029 (%)
- 9.4 Consumer electronics - Market size and forecast 2024-2029
- Chart on Consumer electronics - Market size and forecast 2024-2029 ($ million)
- Data Table on Consumer electronics - Market size and forecast 2024-2029 ($ million)
- Chart on Consumer electronics - Year-over-year growth 2024-2029 (%)
- Data Table on Consumer electronics - Year-over-year growth 2024-2029 (%)
- 9.5 Automotive - Market size and forecast 2024-2029
- Chart on Automotive - Market size and forecast 2024-2029 ($ million)
- Data Table on Automotive - Market size and forecast 2024-2029 ($ million)
- Chart on Automotive - Year-over-year growth 2024-2029 (%)
- Data Table on Automotive - Year-over-year growth 2024-2029 (%)
- 9.6 Industrial automation - Market size and forecast 2024-2029
- Chart on Industrial automation - Market size and forecast 2024-2029 ($ million)
- Data Table on Industrial automation - Market size and forecast 2024-2029 ($ million)
- Chart on Industrial automation - Year-over-year growth 2024-2029 (%)
- Data Table on Industrial automation - Year-over-year growth 2024-2029 (%)
- 9.7 Others - Market size and forecast 2024-2029
- Chart on Others - Market size and forecast 2024-2029 ($ million)
- Data Table on Others - Market size and forecast 2024-2029 ($ million)
- Chart on Others - Year-over-year growth 2024-2029 (%)
- Data Table on Others - Year-over-year growth 2024-2029 (%)
- 9.8 Market opportunity by Application
- Market opportunity by Application ($ million)
- Data Table on Market opportunity by Application ($ million)
10 Market Segmentation by Form Factor
- 10.1 Market segments
- Chart on Form Factor - Market share 2024-2029 (%)
- Data Table on Form Factor - Market share 2024-2029 (%)
- 10.2 Comparison by Form Factor
- Chart on Comparison by Form Factor
- Data Table on Comparison by Form Factor
- 10.3 Processor IP - Market size and forecast 2024-2029
- Chart on Processor IP - Market size and forecast 2024-2029 ($ million)
- Data Table on Processor IP - Market size and forecast 2024-2029 ($ million)
- Chart on Processor IP - Year-over-year growth 2024-2029 (%)
- Data Table on Processor IP - Year-over-year growth 2024-2029 (%)
- 10.4 Physical IP - Market size and forecast 2024-2029
- Chart on Physical IP - Market size and forecast 2024-2029 ($ million)
- Data Table on Physical IP - Market size and forecast 2024-2029 ($ million)
- Chart on Physical IP - Year-over-year growth 2024-2029 (%)
- Data Table on Physical IP - Year-over-year growth 2024-2029 (%)
- 10.5 Digital IP - Market size and forecast 2024-2029
- Chart on Digital IP - Market size and forecast 2024-2029 ($ million)
- Data Table on Digital IP - Market size and forecast 2024-2029 ($ million)
- Chart on Digital IP - Year-over-year growth 2024-2029 (%)
- Data Table on Digital IP - Year-over-year growth 2024-2029 (%)
- 10.6 Market opportunity by Form Factor
- Market opportunity by Form Factor ($ million)
- Data Table on Market opportunity by Form Factor ($ million)
11 Market Segmentation by Type
- 11.1 Market segments
- Chart on Type - Market share 2024-2029 (%)
- Data Table on Type - Market share 2024-2029 (%)
- 11.2 Comparison by Type
- Chart on Comparison by Type
- Data Table on Comparison by Type
- 11.3 Royalty - Market size and forecast 2024-2029
- Chart on Royalty - Market size and forecast 2024-2029 ($ million)
- Data Table on Royalty - Market size and forecast 2024-2029 ($ million)
- Chart on Royalty - Year-over-year growth 2024-2029 (%)
- Data Table on Royalty - Year-over-year growth 2024-2029 (%)
- 11.4 Licensing - Market size and forecast 2024-2029
- Chart on Licensing - Market size and forecast 2024-2029 ($ million)
- Data Table on Licensing - Market size and forecast 2024-2029 ($ million)
- Chart on Licensing - Year-over-year growth 2024-2029 (%)
- Data Table on Licensing - Year-over-year growth 2024-2029 (%)
- 11.5 Market opportunity by Type
- Market opportunity by Type ($ million)
- Data Table on Market opportunity by Type ($ million)
12 Market Segmentation by Product Type
- 12.1 Market segments
- Chart on Product Type - Market share 2024-2029 (%)
- Data Table on Product Type - Market share 2024-2029 (%)
- 12.2 Comparison by Product Type
- Chart on Comparison by Product Type
- Data Table on Comparison by Product Type
- 12.3 Soft IP core - Market size and forecast 2024-2029
- Chart on Soft IP core - Market size and forecast 2024-2029 ($ million)
- Data Table on Soft IP core - Market size and forecast 2024-2029 ($ million)
- Chart on Soft IP core - Year-over-year growth 2024-2029 (%)
- Data Table on Soft IP core - Year-over-year growth 2024-2029 (%)
- 12.4 Hard IP core - Market size and forecast 2024-2029
- Chart on Hard IP core - Market size and forecast 2024-2029 ($ million)
- Data Table on Hard IP core - Market size and forecast 2024-2029 ($ million)
- Chart on Hard IP core - Year-over-year growth 2024-2029 (%)
- Data Table on Hard IP core - Year-over-year growth 2024-2029 (%)
- 12.5 Market opportunity by Product Type
- Market opportunity by Product Type ($ million)
- Data Table on Market opportunity by Product Type ($ million)
13 Customer Landscape
- 13.1 Customer landscape overview
- Analysis of price sensitivity, lifecycle, customer purchase basket, adoption rates, and purchase criteria
14 Geographic Landscape
- 14.1 Geographic segmentation
- Chart on Market share By Geographical Landscape 2024-2029 (%)
- Data Table on Market share By Geographical Landscape 2024-2029 (%)
- 14.2 Geographic comparison
- Chart on Geographic comparison
- Data Table on Geographic comparison
- 14.3 North America - Market size and forecast 2024-2029
- Chart on North America - Market size and forecast 2024-2029 ($ million)
- Data Table on North America - Market size and forecast 2024-2029 ($ million)
- Chart on North America - Year-over-year growth 2024-2029 (%)
- Data Table on North America - Year-over-year growth 2024-2029 (%)
- 14.4 APAC - Market size and forecast 2024-2029
- Chart on APAC - Market size and forecast 2024-2029 ($ million)
- Data Table on APAC - Market size and forecast 2024-2029 ($ million)
- Chart on APAC - Year-over-year growth 2024-2029 (%)
- Data Table on APAC - Year-over-year growth 2024-2029 (%)
- 14.5 Europe - Market size and forecast 2024-2029
- Chart on Europe - Market size and forecast 2024-2029 ($ million)
- Data Table on Europe - Market size and forecast 2024-2029 ($ million)
- Chart on Europe - Year-over-year growth 2024-2029 (%)
- Data Table on Europe - Year-over-year growth 2024-2029 (%)
- 14.6 South America - Market size and forecast 2024-2029
- Chart on South America - Market size and forecast 2024-2029 ($ million)
- Data Table on South America - Market size and forecast 2024-2029 ($ million)
- Chart on South America - Year-over-year growth 2024-2029 (%)
- Data Table on South America - Year-over-year growth 2024-2029 (%)
- 14.7 Middle East and Africa - Market size and forecast 2024-2029
- Chart on Middle East and Africa - Market size and forecast 2024-2029 ($ million)
- Data Table on Middle East and Africa - Market size and forecast 2024-2029 ($ million)
- Chart on Middle East and Africa - Year-over-year growth 2024-2029 (%)
- Data Table on Middle East and Africa - Year-over-year growth 2024-2029 (%)
- 14.8 US - Market size and forecast 2024-2029
- Chart on US - Market size and forecast 2024-2029 ($ million)
- Data Table on US - Market size and forecast 2024-2029 ($ million)
- Chart on US - Year-over-year growth 2024-2029 (%)
- Data Table on US - Year-over-year growth 2024-2029 (%)
- 14.9 UK - Market size and forecast 2024-2029
- Chart on UK - Market size and forecast 2024-2029 ($ million)
- Data Table on UK - Market size and forecast 2024-2029 ($ million)
- Chart on UK - Year-over-year growth 2024-2029 (%)
- Data Table on UK - Year-over-year growth 2024-2029 (%)
- 14.10 China - Market size and forecast 2024-2029
- Chart on China - Market size and forecast 2024-2029 ($ million)
- Data Table on China - Market size and forecast 2024-2029 ($ million)
- Chart on China - Year-over-year growth 2024-2029 (%)
- Data Table on China - Year-over-year growth 2024-2029 (%)
- 14.11 Japan - Market size and forecast 2024-2029
- Chart on Japan - Market size and forecast 2024-2029 ($ million)
- Data Table on Japan - Market size and forecast 2024-2029 ($ million)
- Chart on Japan - Year-over-year growth 2024-2029 (%)
- Data Table on Japan - Year-over-year growth 2024-2029 (%)
- 14.12 South Korea - Market size and forecast 2024-2029
- Chart on South Korea - Market size and forecast 2024-2029 ($ million)
- Data Table on South Korea - Market size and forecast 2024-2029 ($ million)
- Chart on South Korea - Year-over-year growth 2024-2029 (%)
- Data Table on South Korea - Year-over-year growth 2024-2029 (%)
- 14.13 Taiwan - Market size and forecast 2024-2029
- Chart on Taiwan - Market size and forecast 2024-2029 ($ million)
- Data Table on Taiwan - Market size and forecast 2024-2029 ($ million)
- Chart on Taiwan - Year-over-year growth 2024-2029 (%)
- Data Table on Taiwan - Year-over-year growth 2024-2029 (%)
- 14.14 France - Market size and forecast 2024-2029
- Chart on France - Market size and forecast 2024-2029 ($ million)
- Data Table on France - Market size and forecast 2024-2029 ($ million)
- Chart on France - Year-over-year growth 2024-2029 (%)
- Data Table on France - Year-over-year growth 2024-2029 (%)
- 14.15 Germany - Market size and forecast 2024-2029
- Chart on Germany - Market size and forecast 2024-2029 ($ million)
- Data Table on Germany - Market size and forecast 2024-2029 ($ million)
- Chart on Germany - Year-over-year growth 2024-2029 (%)
- Data Table on Germany - Year-over-year growth 2024-2029 (%)
- 14.16 The Netherlands - Market size and forecast 2024-2029
- Chart on The Netherlands - Market size and forecast 2024-2029 ($ million)
- Data Table on The Netherlands - Market size and forecast 2024-2029 ($ million)
- Chart on The Netherlands - Year-over-year growth 2024-2029 (%)
- Data Table on The Netherlands - Year-over-year growth 2024-2029 (%)
- 14.17 Switzerland - Market size and forecast 2024-2029
- Chart on Switzerland - Market size and forecast 2024-2029 ($ million)
- Data Table on Switzerland - Market size and forecast 2024-2029 ($ million)
- Chart on Switzerland - Year-over-year growth 2024-2029 (%)
- Data Table on Switzerland - Year-over-year growth 2024-2029 (%)
- 14.18 Market opportunity By Geographical Landscape
- Market opportunity By Geographical Landscape ($ million)
- Data Tables on Market opportunity By Geographical Landscape ($ million)
15 Drivers, Challenges, and Opportunity/Restraints
- 15.1 Market drivers
- 15.2 Market challenges
- 15.3 Impact of drivers and challenges
- Impact of drivers and challenges in 2024 and 2029
- 15.4 Market opportunities/restraints
16 Competitive Landscape
- 16.1 Overview
- 16.2 Competitive Landscape
- Overview on criticality of inputs and factors of differentiation
- 16.3 Landscape disruption
- Overview on factors of disruption
- 16.4 Industry risks
- Impact of key risks on business
17 Competitive Analysis
- 17.1 Companies profiled
- Companies covered
- 17.2 Company ranking index
- Company ranking index
- 17.3 Market positioning of companies
- Matrix on companies position and classification
- 17.4 Achronix Semiconductor Corp.
- Achronix Semiconductor Corp. - Overview
- Achronix Semiconductor Corp. - Product / Service
- Achronix Semiconductor Corp. - Key offerings
- SWOT
- 17.5 Advanced Micro Devices Inc.
- Advanced Micro Devices Inc. - Overview
- Advanced Micro Devices Inc. - Business segments
- Advanced Micro Devices Inc. - Key news
- Advanced Micro Devices Inc. - Key offerings
- Advanced Micro Devices Inc. - Segment focus
- SWOT
- 17.6 Arm Ltd.
- Arm Ltd. - Overview
- Arm Ltd. - Product / Service
- Arm Ltd. - Key offerings
- SWOT
- 17.7 Cadence Design Systems Inc.
- Cadence Design Systems Inc. - Overview
- Cadence Design Systems Inc. - Business segments
- Cadence Design Systems Inc. - Key news
- Cadence Design Systems Inc. - Key offerings
- Cadence Design Systems Inc. - Segment focus
- SWOT
- 17.8 CAST Inc.
- CAST Inc. - Overview
- CAST Inc. - Product / Service
- CAST Inc. - Key news
- CAST Inc. - Key offerings
- SWOT
- 17.9 CEVA Inc.
- CEVA Inc. - Overview
- CEVA Inc. - Product / Service
- CEVA Inc. - Key offerings
- SWOT
- 17.10 Dolphin Design SAS
- Dolphin Design SAS - Overview
- Dolphin Design SAS - Product / Service
- Dolphin Design SAS - Key offerings
- SWOT
- 17.11 eMemory Technology Inc.
- eMemory Technology Inc. - Overview
- eMemory Technology Inc. - Product / Service
- eMemory Technology Inc. - Key offerings
- SWOT
- 17.12 Imagination Technologies Ltd.
- Imagination Technologies Ltd. - Overview
- Imagination Technologies Ltd. - Product / Service
- Imagination Technologies Ltd. - Key offerings
- SWOT
- 17.13 Lattice Semiconductor Corp.
- Lattice Semiconductor Corp. - Overview
- Lattice Semiconductor Corp. - Product / Service
- Lattice Semiconductor Corp. - Key offerings
- SWOT
- 17.14 Perceptia Devices Australia
- Perceptia Devices Australia - Overview
- Perceptia Devices Australia - Product / Service
- Perceptia Devices Australia - Key offerings
- SWOT
- 17.15 Rambus Inc.
- Rambus Inc. - Overview
- Rambus Inc. - Product / Service
- Rambus Inc. - Key offerings
- SWOT
- 17.16 Siemens AG
- Siemens AG - Overview
- Siemens AG - Business segments
- Siemens AG - Key news
- Siemens AG - Key offerings
- Siemens AG - Segment focus
- SWOT
- 17.17 Synopsys Inc.
- Synopsys Inc. - Overview
- Synopsys Inc. - Business segments
- Synopsys Inc. - Key news
- Synopsys Inc. - Key offerings
- Synopsys Inc. - Segment focus
- SWOT
- 17.18 VeriSilicon Microelectronics Shanghai Co. Ltd.
- VeriSilicon Microelectronics Shanghai Co. Ltd. - Overview
- VeriSilicon Microelectronics Shanghai Co. Ltd. - Product / Service
- VeriSilicon Microelectronics Shanghai Co. Ltd. - Key offerings
- SWOT
18 Appendix
- 18.1 Scope of the report
- 18.2 Inclusions and exclusions checklist
- Inclusions checklist
- Exclusions checklist
- 18.3 Currency conversion rates for US$
- Currency conversion rates for US$
- 18.4 Research methodology
- Research methodology
- 18.5 Data procurement
- Information sources
- 18.6 Data validation
- Data validation
- 18.7 Validation techniques employed for market sizing
- Validation techniques employed for market sizing
- 18.8 Data synthesis
- Data synthesis
- 18.9 360 degree market analysis
- 360 degree market analysis
- 18.10 List of abbreviations
- List of abbreviations

