
ハイテク産業におけるレアアース:中国貿易禁止下の市場分析と予測
Rare Earths Elements In High-Tech Industries: Market Analysis And Forecasts Amid China's Trade Embargo- 発行日
- ページ情報
- 英文
- 納期
- 2~3営業日
- 商品コード
- 1479762
- 翻訳ツール提供対象 PDF対応AI翻訳ツールの無料貸し出しサービスのご利用が可能です
- 電子部品/半導体関連専門 電子部品/半導体関連専門を専門とする市場調査会社です。
概要
イントロダクション
レアアースは、化学的にユニークな17種類の元素からなるグループで、最先端技術や再生可能エネルギーシステムの幅広い分野で不可欠なコンポーネントとなっています。電気自動車や風力タービンからスマートフォンや先進医療機器に至るまで、レアアースはさまざまな産業でイノベーションと持続可能性を実現する上で重要な役割を果たしています。
ハイテク産業、代替エネルギー産業の動向
ハイテク産業、代替エネルギー産業におけるレアアースの利用は広範囲に及び、現代技術や再生可能エネルギーソリューションの進歩や効率化に不可欠な幅広い用途をカバーしています。ここではその詳細を紹介します。
レポートで取り上げるハイテク産業
電子機器・通信機器:レアアースは、スマートフォン、コンピューター、薄型モニターなどの電子機器の製造において極めて重要です。ネオジム、プラセオジム、ジスプロシウムなどの元素は、スピーカー、ハードドライブ、小型モーターの磁石に使用されています。ユーロピウムとテルビウムは、蛍光体の役割を果たすことで、スクリーンの鮮やかな表示に寄与しています。
先進光学・レーザー:ガドリニウム、エルビウム、イッテルビウムは、光ファイバーやレーザー技術に使用されています。これらの元素は、高速インターネット伝送や医療用レーザーの精度に不可欠です。
防衛・航空宇宙:サマリウムから作られるサマリウムコバルト磁石は、精密誘導弾や衛星通信システムに利用されています。イットリウムやテルビウムのようなレアアースは、そのユニークな光学的および磁気的特性により、レーダーシステムやその他の防衛用電子機器に使用されています。
レポートで取り上げる代替エネルギー産業
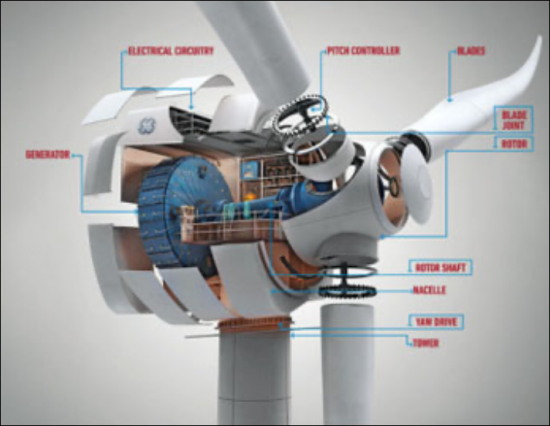
風力タービン:ネオジム、プラセオジム、ジスプロシウムは、風力タービンの発電機の強力な永久磁石に不可欠です。これらの磁石により、風速が低い場合でも効率的に発電することができます。
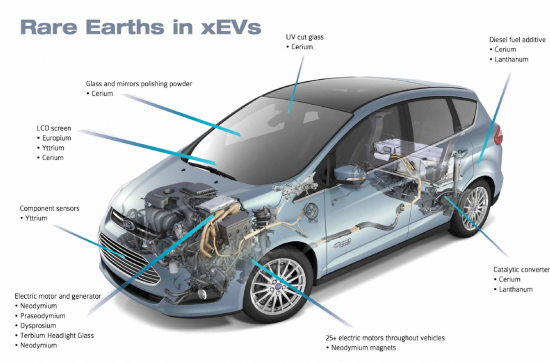
電気自動車(EV):電気自動車やハイブリッド車のトラクションモーターには、NdFeB(ネオジム・鉄・ボロン)磁石が多く使用されています。この磁石の高性能は、EVの効率と航続距離に寄与しています。
ソーラーパネル:レアアースは太陽電池の主成分ではありませんが、セリウムなどのレアアース酸化物はソーラーパネルのガラス研磨に使用されます。また、ランタンは太陽エネルギーを貯蔵する先進の電池の生産に使用されています。
エネルギー貯蔵:ランタンやセリウムのようなレアアースは、再生可能エネルギー貯蔵ソリューションに不可欠なニッケル水素(NiMH)電池に使用されています。これらの元素は、再生可能エネルギーの安定供給に不可欠な電池の容量と寿命の向上に役立ちます。
動向
ハイテク産業、代替エネルギー産業におけるレアアース(REE)の動向は、さまざまな用途における重要な部品としての重要性の高まりを反映しています。
顕著な動向の1つは、電気自動車(EV)や風力タービン、ソーラーパネルなどの再生可能エネルギー技術におけるレアアースの需要の高まりです。よりクリーンなエネルギー源への移行が世界的に加速するにつれて、NdPr永久磁石、触媒、電池技術に使用されるレアアースの需要は大幅に増加すると予測されます。
さらに、特に地政学的緊張の観点から、サプライチェーンリスクを軽減し、一部の支配的な生産者への依存を減らすために、持続可能で多様なレアアース供給を確保することが重視されるようになっています。
もう1つの動向は、従来のレアアース採掘および加工に伴う供給制約や環境問題に対処するための、代替の供給源やリサイクル方法の模索です。さらに、材料科学と技術革新の進歩が、レアアースの抽出、精製、さまざまな用途での活用に向けた、より効率的で環境にやさしいプロセスの開発を後押ししています。
全体として、この動向はハイテク産業と代替エネルギー産業の発展におけるレアアースの重要な役割を強調する一方で、持続可能で強靭なサプライチェーンを確保するための戦略的な計画と協力の必要性を浮き彫りにしています。
当レポートでは、世界のレアアース産業について調査分析し、レアアースの生産、需要、市場力学、技術の進歩、将来見通しなどの情報を提供しています。
目次
第1章 イントロダクション
第2章 レアアース産業
- 中国のレアアース産業
- 中国の生産
- 中国のレアアース生産構造
- 中国のレアアース消費構造
- 中国のレアアース輸出
- 中国のレアアース産業の近年の活動
- その他の地域のレアアース産業
- 米国
- カナダ
- 南アフリカ
- オーストラリア
- グリーンランド
- アルゼンチン
- インド
- ロシア
- 鉱業企業のプロファイル
第3章 レアアース市場の分析
- 概要
- レアアース市場
- 国内の生産と消費
- 中国の生産と消費
- 世界のレアアース市場の分析
第4章 ハイテク用途に対する影響
- 概要
- 半導体
- ハードディスクドライブ(HDD)
- モバイル、モバイルインターネット機器
- 固体照明 - LED/CFL
- グリーン技術
第5章 米国の戦略的金属の見通し
- 国防におけるレアアースの利用
- レアアース資源と潜在生産力
- サプライチェーンの問題
- レアアースに関する法律
第6章 欧州の戦略的金属の見通し
- 重要度の評価
- 2020年のEU重要原材料リスト
- 現在と過去の取り組み
第7章 米国のサプライチェーンの再構築
- 材料サプライチェーンの課題と機会
- 価格上昇の影響:用途別
- 米国のREE/REOリサイクル
目次
Introduction
The report "Rare Earths Elements in High-Tech and Alternative Energy Industries: Market Analysis and Forecasts" presents a comprehensive exploration into the pivotal role of rare earth elements (REEs) within high-tech and alternative energy sectors.
Rare earth elements, a group of 17 chemically unique elements, are integral components in a wide array of cutting-edge technologies and renewable energy systems. From electric vehicles and wind turbines to smartphones and advanced medical devices, REEs play a vital role in enabling innovation and sustainability across various industries.
This report delves into the intricate dynamics of the REEs market, examining factors such as global supply chain resilience, evolving demand patterns, pricing dynamics, and geopolitical influences.
By providing in-depth insights and forecasts, the report aims to empower stakeholders with the knowledge and strategic insights necessary to navigate the complex landscape of high-tech and alternative energy industries amid challenges such as supply chain disruptions and geopolitical tensions.
High-Tech and Alternative Energy Industries Trends
The utilization of Rare Earth Elements (REEs) in high-tech and alternative energy industries is extensive, covering a wide range of applications essential for the advancement and efficiency of modern technologies and renewable energy solutions. Here's a detailed exploration:
High-Tech Industries Discussed in Report::
Electronics and Communication Devices: REEs are pivotal in manufacturing smartphones, computers, flat-screen monitors, and other electronic devices. Elements like neodymium, praseodymium, and dysprosium are used in magnets for speakers, hard drives, and small motors. Europium and terbium contribute to the vibrant displays of screens through their role in phosphors.
Advanced Optics and Lasers: Gadolinium, erbium, and ytterbium are used in optical fibers and laser technology. These elements are crucial for high-speed internet transmission and precision in medical lasers.
Defense and Aerospace: Samarium-cobalt magnets, made from samarium, are utilized in precision-guided munitions, and satellite communication systems. REEs like yttrium and terbium are used in radar systems and other defense electronics due to their unique optical and magnetic properties.
Alternative Energy Industries Discussed in Report
Wind Turbines: Neodymium, praseodymium, and dysprosium are essential for the powerful permanent magnets in the generators of wind turbines. These magnets allow the turbines to generate electricity efficiently, even at low wind speeds.
Electric Vehicles (EVs): The traction motors in electric and hybrid vehicles often use neodymium-iron-boron (NdFeB) magnets. The high performance of these magnets contributes to the efficiency and range of EVs.
Solar Panels: While REEs are not major components in photovoltaic cells, certain rare earth oxides like cerium are used for polishing the glass of solar panels. Additionally, lanthanum is used in the production of advanced batteries that store solar energy.
Energy Storage: REEs like lanthanum and cerium are used in nickel-metal hydride (NiMH) batteries, which are crucial for renewable energy storage solutions. These elements help improve the battery's capacity and longevity, essential for the stability of renewable energy sources.
Trends
The trends in Rare Earth Elements (REEs) within high-tech and alternative energy industries reflect their increasing importance as critical components in various applications.
One prominent trend is the growing demand for REEs in electric vehicles (EVs) and renewable energy technologies such as wind turbines and solar panels. As the global transition toward cleaner energy sources accelerates, the demand for REEs used in NdPr permanent magnets, catalysts, and battery technologies is expected to rise significantly.
Additionally, there is a growing emphasis on securing sustainable and diversified REE supplies to mitigate supply chain risks and reduce dependence on a few dominant producers, particularly in light of geopolitical tensions.
Another trend is the exploration of alternative sources and recycling methods to address supply constraints and environmental concerns associated with traditional REE mining and processing. Furthermore, advancements in material science and technological innovations are driving the development of more efficient and environmentally friendly processes for extracting, refining, and utilizing REEs in various applications.
Overall, the trends underscore the critical role of REEs in advancing high-tech and alternative energy industries while highlighting the need for strategic planning and collaboration to ensure a sustainable and resilient supply chain.
About This Report
Rare Earths Elements in High-Tech and Alternative Energy Industries report covers a wide range of topics related to the production, demand, market dynamics, technological advancements, and future prospects of REEs. Specifically, the report include:
Market Analysis: An overview of the global REE market, including historical trends, current market size, and growth projections, detailing market drivers, challenges, and opportunities.
Industry Trends: Exploration of key trends shaping the demand for REEs in high-tech and alternative energy sectors, such as electric vehicles, renewable energy technologies, consumer electronics, and advanced manufacturing.
Supply Chain Analysis: Examination of the REE supply chain, including major producers, mining projects, processing facilities, and distribution networks. This section also discusses geopolitical factors, trade policies, and supply chain risks affecting REE availability.
Application Segmentation: Detailed analysis of REE applications across various industries, highlighting their uses in magnets, batteries, catalysts, lighting, electronics, and other high-tech products.
Technology Innovation: Exploration of technological advancements and research initiatives aimed at improving REE extraction, processing, recycling, and substitution. This section also covers innovations in material science, manufacturing processes, and product design to enhance REE efficiency and sustainability.
Regulatory Environment: Overview of regulatory frameworks, environmental regulations, and policies impacting REE mining, production, trade, and usage. This section also addresses sustainability standards, responsible sourcing initiatives, and compliance requirements for REErelated industries.
Market Forecasts: Forecasting of future trends and growth opportunities in the REE market, including projections for demand, supply, prices, and market shares. This section provides insights into emerging technologies, market disruptions, and investment prospects in the REE sector.
Competitive Landscape: Analysis of key players in the REE industry, including mining companies, processors, manufacturers, and end-users. This section includes company profiles, market strategies, competitive positioning, and partnerships in the REE value chain. Overall, the comprehensive report aims to provide stakeholders with actionable insights, strategic recommendations, and data-driven analyses to navigate the complex landscape of REEs in high-tech and alternative energy industries.
Table of Contents
Chapter 1. Introduction
- 1.1. Rare Earth Element Characteristics
- 1.2. Rare Earth Element Resources
- 1.3. Overview of Rare Earth Element Applications
Chapter 2. Rare Earth Industry
- 2.1. China' Rare Earth Industry
- 2.1.1. China's Production
- 2.1.2. China Rare Earth Production Structure
- 2.1.3. China Rare Earth Consumption Structure
- 2.1.4. China Export of Rare Earths
- 2.1.5. Recent Activities Of China's Rare Earth Industry
- 2.1.5.1. Consolidation Of China's Rare Earth Industry
- 2.1.5.2. Export Quotas
- 2.2. Rest Of World's Rare Earth Industry
- 2.2.1. UNITED STATES
- 2.2.1.1. Mountain Pass
- 2.2.1.2. Utah Rare Earth Project
- 2.2.1.3. Bear Lodge Rare-Earth Project
- 2.2.1.4. Elk Creek
- 2.2.1.5. Bokan-Dotson Ridge
- 2.2.1.6. Diamond Creek
- 2.2.1.7. Lemhi Pass
- 2.2.2. CANADA
- 2.2.2.1. MacLeod Lake Project
- 2.2.2.2. Hoidas Lake
- 2.2.2.3. Benjamin River Project
- 2.2.2.4. Douglas River Project
- 2.2.2.5. Nechalacho Rare Earth Element Project
- 2.2.2.6. Archie Lake
- 2.2.2.7. Bulstrode Rare Earth Property
- 2.2.2.8. Mount Copeland
- 2.2.2.9. Cross Hills Newfoundland
- 2.2.2.10. Kipawa
- 2.2.2.11. Strange Lake
- 2.2.2.12. Ytterby
- 2.2.2.13. Grevet REE
- 2.2.2.14. Turner Falls
- 2.2.3. SOUTH AFRICA
- 2.2.3.1. Steenkampskraal Mine South Africa
- 2.2.4. AUSTRALIA
- 2.2.4.1. Nolans Bore
- 2.2.4.2. Mount Weld
- 2.2.4.3. Jungle Well/ Laverton
- 2.2.5. GREENLAND
- 2.2.5.1. Kvanefjeld Project
- 2.2.6. ARGENTINA
- 2.2.6.1. Cueva del Chacho
- 2.2.6.2. Susques Property - Jujuy Province
- 2.2.6.3. John Galt Project
- 2.2.7. INDIA
- 2.2.7.1. Indian Rare Earth
- 2.2.8. RUSSIA
- 2.2.8.1. Kutessay II
- 2.2.1. UNITED STATES
- 2.3. Profiles of Mining Corporations
Chapter 3. Rare Earth Market Analysis
- 3.1. Overview
- 3.2. Rare Earth Market
- 3.2.1. Domestic Production and Consumption
- 3.2.2. China Production and Consumption
- 3.3. Global Rare Earth Market Analysis
Chapter 4. Impact on Hi-Tech Applications
- 4.1. Overview
- 4.1.1. Rare Earth Market By Application
- 4.1.2. NdPr Magnets
- 4.2. Semiconductors
- 4.2.1. Technology Impacted
- 4.2.1.1. High-k Dielectrics
- 4.2.1.2. Polishing Powders
- 4.2.2. Rare Earth Material Used
- 4.2.3. Market Forecast of Impacted Semiconductor Devices/Materials
- 4.2.1. Technology Impacted
- 4.3. Hard Disk Drives (HDDs)
- 4.3.1. Technology Impacted
- 4.3.1.1. Neo Magnets for HDDs
- 4.3.1.2. High Strength Glass Substrates
- 4.3.1.3. Polishing Materials
- 4.3.2. Rare Earth Material Used
- 4.3.3. Market Forecast of Impacted HDD Devices/Materials
- 4.3.1. Technology Impacted
- 4.4. Mobile and Mobile Internet Devices
- 4.4.1. Technology Impacted
- 4.4.2. Rare Earth Material Used
- 4.4.3. Market Forecast of Impacted Mobile Devices/Materials
- 4.5. Solid State Lighting - LED/CFL
- 4.5.1. Technology Impacted
- 4.5.1.1. Phosphors for Light Emitting Diodes (LEDs)
- 4.5.1.2. Phosphors for Compact Fluorescent Lamps (CFL)
- 4.5.2. Rare Earth Material Used
- 4.5.3. Market Forecast of Impacted LED Devices/Materials
- 4.5.1. Technology Impacted
- 4.6. Green Technology
- 4.6.1. Technology Impacted
- 4.6.1.1. Magnets for Hybrid Vehicle Electric Motors and Brakes
- 4.6.1.2. Neo Magnets for Wind Turbines
- 4.6.1.3. Cerium for Catalytic Converters for Automobiles
- 4.6.2. Rare Earth Material Used
- 4.6.3. Market Forecast of Impacted Green Devices/Materials
- 4.6.4. Other Green Technologies
- 4.6.1. Technology Impacted
Chapter 5. U.S Strategic Metal Perspective
- 5.1. The Application of Rare Earth Metals in National Defense
- 5.2. Rare Earth Resources and Production Potential
- 5.3. Supply Chain Issues
- 5.4. Rare Earth Legislation
Chapter 6. European Strategic Metal Perspective
- 6.1. Assessing Criticality
- 6.2. The 2020 EU Critical Raw Materials List
- 6.3. Current And Past Initiatives
Chapter 7. Rebuilding a U.S. Supply Chain
- 7.1. Materials Supply Chain Challenges And Opportunities
- 7.2. Impact of Price Hikes by Application
- 7.2.1. REE/REO Recycling In U.S.
- 7.2.1.1. Overall Process
- 7.2.1.2. Recycling RE Magnets
- 7.2.1.3. Recycling Phosphors
- 7.2.1.4. Company Programs
- 7.2.1. REE/REO Recycling In U.S.
TABLES
- 1.1. Selected Rare Earth Element Bearing Products
- 1.2. Rare Earths Elements And Some Of Their End Uses
- 2.1. World Mine Production and Reserves
- 2.2. Global Rare Earth Supply/Demand
- 2.3. China's Rare Earth Export Volume And Export Amount
- 2.4. Rare Earth Projects Outside China
- 3.1. U.S. Rare Earth Statistics
- 3.2. Rare Earth Prices
- 3.3. Rare Earth Elements: World Production
- 3.4. Rare Earth Oxide Demand-Supply
- 3.5. Rare Earth Composition By End Use
- 4.1. NdPr Oxide Supply Market Forecast
- 4.2. NdPr Oxide Demand Market Forecast
- 4.3. Forecast of Ceria CMP Slurry for Semiconductors
- 4.4. Market Forecast for Hard Disk Drives
- 4.5. Neodymium Consumption For Hard Disk Drives
- 4.6. Market Forecast For Ceria Slurry For Glass Disks
- 4.7. Shipment Forecast of Smartphones
- 4.8. Neodymium Consumption For Smartphones
- 4.9. Market Forecast of LEDs by Application
- 4.10. Demand of Rare Earths in LEDs
- 4.11. Shipment Forecast Of Electric Vehicles
- 4.12. Neodymium Consumption For Electric Vehicles
- 4-13. Shipment Forecast Of Internal Combustion Engine Vehicles
- 4-14. Ceria Consumption For Catalytic Converters
- 4-15. Shipment Forecast Of Wind Turbines
- 4-16. Neodymium Consumption For Wind Turbines
- 5.1. Rare Earth Elements: World Production And Reserves
- 7.1. NdFeB Permanent Magnet Supply Chain Steps
FIGURES
- 1.1. Periodic Table Of Rare Earth Elements
- 1.2. Abundance Of The Rare Earth Elements
- 1.3. Rare Earth Production Since 1950
- 1.4. China's Rare Earth Dominance
- 2.1. Rare Earth Proportion And Distribution In China
- 2.2. Production Of Rare Earth Concentrates Since 1987
- 2.3. Production Of Rare Earth Oxides Since 1994
- 2.4. China Mining Quota By Company
- 2.5. China Rare Earth Oxide Exports By Destination
- 2.6. China Rare Earth Metal Exports By Destination
- 2.7. China's Rare-Earth Exports
- 3.1. U.S. Distribution Of Refined Rare Earth Products
- 3.2. Rare-Earth Price Index
- 3.3. Comparison Of Rare Earth Consumption Between China And The World
- 3.4. Global Supply-Demand Forecast
- 3.5. REE Demand By Volume
- 3.6. REE Demand By Value
- 3.7. REE Applications Global
- 3.8. REE Applications U.S.
- 3.9. REE Composition By End Use
- 3.10. Approximate % Content Of Current And Prospective Ores
- 4.1. Application Market Share by Volume
- 4.2. High-Performance Magnet Share by Application
- 4.3. High-Performance Magnet Share by Application - 2030
- 4.4. Illustration of MOSFET and Gate Oxide
- 4.5. STI CMP Using Ceria
- 4.6. Hafnium Demand for Semiconductors
- 4.7. HDD Drive and Neo Magnets
- 4.8. REE Usage in Phosphors
- 4.9. Scattered Photon Extraction white LED
- 4.10. Supply Chain for Fluorescent Lighting
- 4.11. EV Rare Earths Applications
- 4.12. Wind Turbine Motor
- 4.13. Supply Chain for Permanent Magnets
- 4.14. Catalytic Converter for Automobiles
- 5.1. Global Rare Earth Reserves
- 6.1. Supply Of Strategic Metals To The European Union
- 発行日
- 発行
- Information Network
- ページ情報
- 英文
- 納期
- 2~3営業日


