|
|
市場調査レポート
商品コード
1362950
TMSシステム(経頭蓋磁気刺激システム)の市場規模、シェア、動向分析レポート:タイプ別、用途別、年齢層別、地域別、セグメント別予測、2023年~2030年Transcranial Magnetic Stimulation System Market Size, Share & Trends Analysis Report By Type (rTMS, dTMS), By Application (Depression, Epilepsy), By Age Group, By Region, And Segment Forecasts, 2023 - 2030 |
||||||
|
|
|||||||
|
● お客様のご希望に応じて、既存データの加工や未掲載情報(例:国別セグメント)の追加などの対応が可能です。 詳細はお問い合わせください。 |
|||||||


| TMSシステム(経頭蓋磁気刺激システム)の市場規模、シェア、動向分析レポート:タイプ別、用途別、年齢層別、地域別、セグメント別予測、2023年~2030年 |
|
出版日: 2023年09月11日
発行: Grand View Research
ページ情報: 英文 100 Pages
納期: 2~10営業日
|
- 全表示
- 概要
- 図表
- 目次
TMSシステム(経頭蓋磁気刺激システム)市場の成長と動向:
Grand View Research, Inc.の最新レポートによると、TMSシステムの世界市場は2030年までに22億6,000万米ドルに達すると予測され、2023年から2030年までの複合年間成長率(CAGR)は9.0%を記録すると予測されています。
TMSシステム市場は、パーキンソン病、アルツハイマー病、その他の神経学的問題などの神経学的疾患の有病率の増加と技術の進歩により成長が見込まれています。
2020年10月のFDAによると、COVID-19公衆衛生上の緊急事態のため、市場に短期的なマイナスの影響が出ています。この減少は主に、当四半期に販売されたTMSシステムの台数が減少したことによるものです。例えば、ニューロネティクス社は、COVID-19の影響により、2019年第1四半期の43システムから38システムを販売しました。しかし、2020年3月現在、米国における有効設置台数は1,119台です。これは、2019年3月31日時点の稼動台設置ベースと比較して188台(20%)の増加、2019年12月31日時点の稼動台設置ベースと比較して34台の増加となります。
企業は、製品ポートフォリオを拡大し、企業収益を増加させるために、既存市場に新製品を絶えず投入しています。例えば、Neuronetics社によると、2022年7月、FDAは、大うつ病性障害の人の不安症状を治療するための経頭蓋磁気刺激装置「NeuroStar Advanced Therapy for Mental Health」を承認しました。さらにFDAは、経頭蓋磁気刺激(TMS)システムを強迫性障害の患者の追加治療として承認しました。この非薬物、非侵襲的治療は、FDAの承認を受けた最初のうつ病のTMSシステムです。TMSシステム市場は、このような進歩の結果、高い割合で増加すると予測されています。
TMSシステム市場レポートハイライト
- タイプ別では、反復経頭蓋磁気刺激(rTMS)が2022年の最大市場シェア38.5%を占めます。より深く、より大きな脳容積を直接活性化できるユニークな治療法、反復経頭蓋磁気刺激が提案されています。これは、手術や電極挿入を伴わない高度な脳刺激です。さらに、単極性うつ病、統合失調症、双極性障害などの精神疾患にrTMS治療が必要かどうかも調査されています。医師がrTMSを好み、使用するようになった結果、市場は拡大しています。
- 用途別では、うつ病分野が予測期間中最も速いCAGR 9.5%で成長すると予測されています。ストレスや肥満に起因するうつ病の世界の有病率の増加と技術の進歩が、近い将来の市場成長を後押しすると予測されています。
- 年齢層に基づくと、成人セグメントは2022年に58.5%以上のシェアで市場を独占しました。パーキンソン病(PD)の有病率の増加と政府・団体のイニシアチブの高まりが市場成長を促進する要因となっています。
- 全地域の中で、アジア太平洋のTMSシステム市場は予測期間中に最も高いCAGRで成長すると予想されます。これは、神経疾患の増加やNGOによる啓発プログラムの増加によるものです。そのため、TMSシステム市場の成長も期待されています。
目次
第1章 調査手法と範囲
第2章 エグゼクティブサマリー
第3章 TMSシステム市場の変数、動向、範囲
- 市場系統の見通し
- 親市場の見通し
- 関連/付随市場の見通し
- 普及と成長の見通しマッピング
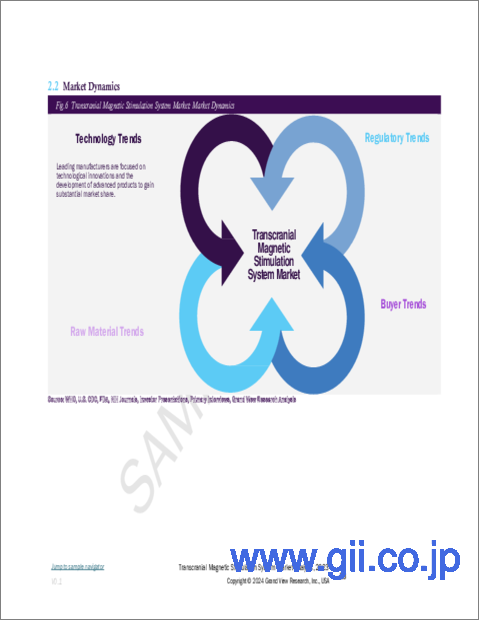
- 市場力学
- 市場促進要因の分析
- 市場抑制要因分析
- TMSシステム市場分析ツール
- 業界分析- ポーターのファイブフォース分析
- PESTEL分析
第4章 TMSシステム:タイプの推定・動向分析
- TMSシステム市場:重要なポイント
- TMSシステム市場:動向と市場シェア分析、2022年および2030年
- dTMS
- rTMS
- その他
第5章 TMSシステム市場:用途の推定・動向分析
- TMSシステム市場:重要なポイント
- TMSシステム市場:動向と市場シェア分析、2022年および2030年
- アルツハイマー病
- うつ病
- パーキンソン病
- てんかん
- その他
第6章 TMSシステム市場:年齢層の推定・動向分析
- TMSシステム市場:重要なポイント
- TMSシステム市場:動向と市場シェア分析、2022年および2030年
- 成人
- 子供
第7章 TMSシステム市場:地域の推定・動向分析
- 地域の展望
- 地域別のTMSシステム市場:主要なマーケットプレースのポイント
- 北米
- 米国
- カナダ
- 欧州
- 英国
- ドイツ
- フランス
- イタリア
- スペイン
- スウェーデン
- ノルウェー
- デンマーク
- アジア太平洋地域
- 日本
- 中国
- インド
- オーストラリア
- タイ
- 韓国
- ラテンアメリカ
- ブラジル
- メキシコ
- アルゼンチン
- 中東・アフリカ
- サウジアラビア
- 南アフリカ
- アラブ首長国連邦
- クウェート
第8章 競合情勢
- 主要市場参入企業による最近の動向と影響分析
- 市場参入企業の分類
- BrainsWay
- Magstim
- Nexstim
- Salience
- MagVenture A/S
- eNeura Inc.
List of Tables
- Table 1 List of Abbreviations
- Table 2 North America transcranial magnetic stimulation systems market, by type, 2018 - 2030 (USD Million)
- Table 3 North America transcranial magnetic stimulation systems market, by application, 2018 - 2030 (USD Million)
- Table 4 North America transcranial magnetic stimulation systems market, by age group, 2018 - 2030 (USD Million)
- Table 5 North America transcranial magnetic stimulation systems market, by region, 2018 - 2030 (USD Million)
- Table 6 U.S. transcranial magnetic stimulation systems market, by type, 2018 - 2030 (USD Million)
- Table 7 U.S. transcranial magnetic stimulation systems market, by application, 2018 - 2030 (USD Million)
- Table 8 U.S. transcranial magnetic stimulation systems market, by age group, 2018 - 2030 (USD Million)
- Table 9 Canada transcranial magnetic stimulation systems market, by type, 2018 - 2030 (USD Million)
- Table 10 Canada transcranial magnetic stimulation systems market, by application, 2018 - 2030 (USD Million)
- Table 11 Canada transcranial magnetic stimulation systems market, by age group, 2018 - 2030 (USD Million)
- Table 12 Europe transcranial magnetic stimulation systems market, by type, (USD Million) 2018 - 2030
- Table 13 Europe transcranial magnetic stimulation systems market, by application, 2018 - 2030 (USD Million)
- Table 14 Europe transcranial magnetic stimulation systems market, by age group, 2018 - 2030 (USD Million)
- Table 15 Europe transcranial magnetic stimulation systems market, by region, 2018 - 2030 (USD Million)
- Table 16 Germany transcranial magnetic stimulation systems market, by type, (USD Million) 2018 - 2030
- Table 17 Germany transcranial magnetic stimulation systems market, by application, 2018 - 2030 (USD Million)
- Table 18 Germany transcranial magnetic stimulation systems market, by age group, 2018 - 2030 (USD Million)
- Table 19 UK transcranial magnetic stimulation systems market, by type, (USD Million) 2018 - 2030
- Table 20 UK transcranial magnetic stimulation systems market, by application, 2018 - 2030 (USD Million)
- Table 21 UK transcranial magnetic stimulation systems market, by age group, 2018 - 2030 (USD Million)
- Table 22 France transcranial magnetic stimulation systems market, by type, (USD Million) 2018 - 2030
- Table 23 France transcranial magnetic stimulation systems market, by application, 2018 - 2030 (USD Million)
- Table 24 France transcranial magnetic stimulation systems market, by age group, 2018 - 2030 (USD Million)
- Table 25 Italy transcranial magnetic stimulation systems market, by type, (USD Million) 2018 - 2030
- Table 26 Italy transcranial magnetic stimulation systems market, by application, 2018 - 2030 (USD Million)
- Table 27 Italy transcranial magnetic stimulation systems market, by age group, 2018 - 2030 (USD Million)
- Table 28 Spain transcranial magnetic stimulation systems market, by type, 2018 - 2030 (USD Million)
- Table 29 Spain transcranial magnetic stimulation systems market, by application, 2018 - 2030 (USD Million)
- Table 30 Spain transcranial magnetic stimulation systems market, by age group, 2018 - 2030 (USD Million)
- Table 31 Sweden transcranial magnetic stimulation systems market, by type, 2018 - 2030 (USD Million)
- Table 32 Sweden transcranial magnetic stimulation systems market, by application, 2018 - 2030 (USD Million)
- Table 33 Sweden transcranial magnetic stimulation systems market, by age group, 2018 - 2030 (USD Million)
- Table 34 Norway transcranial magnetic stimulation systems market, by type, 2018 - 2030 (USD Million)
- Table 35 Norway transcranial magnetic stimulation systems market, by application, 2018 - 2030 (USD Million)
- Table 36 Norway transcranial magnetic stimulation systems market, by age group, 2018 - 2030 (USD Million)
- Table 37 Denmark transcranial magnetic stimulation systems market, by type, 2018 - 2030 (USD Million)
- Table 38 Denmark transcranial magnetic stimulation systems market, by application, 2018 - 2030 (USD Million)
- Table 39 Denmark transcranial magnetic stimulation systems market, by age group, 2018 - 2030 (USD Million)
- Table 40 Asia Pacific transcranial magnetic stimulation systems market, by type, 2018 - 2030 (USD Million)
- Table 41 Asia Pacific transcranial magnetic stimulation systems market, by application, 2018 - 2030 (USD Million)
- Table 42 Asia Pacific transcranial magnetic stimulation systems market, by age group, 2018 - 2030 (USD Million)
- Table 43 Asia Pacific transcranial magnetic stimulation systems market, by region, 2018 - 2030 (USD Million)
- Table 44 Japan transcranial magnetic stimulation systems market, by type, 2018 - 2030 (USD Million)
- Table 45 Japan transcranial magnetic stimulation systems market, by application, 2018 - 2030 (USD Million)
- Table 46 Japan transcranial magnetic stimulation systems market, by age group, 2018 - 2030 (USD Million)
- Table 47 China transcranial magnetic stimulation systems market, by type, 2018 - 2030 (USD Million)
- Table 48 China transcranial magnetic stimulation systems market, by application, 2018 - 2030 (USD Million)
- Table 49 China transcranial magnetic stimulation systems market, by age group, 2018 - 2030 (USD Million)
- Table 50 India transcranial magnetic stimulation systems market, by type, 2018 - 2030 (USD Million)
- Table 51 India transcranial magnetic stimulation systems market, by application, 2018 - 2030 (USD Million)
- Table 52 India transcranial magnetic stimulation systems market, by age group, (USD Million) 2018 - 2030
- Table 53 Australia transcranial magnetic stimulation systems market, by type, 2018 - 2030 (USD Million)
- Table 54 Australia transcranial magnetic stimulation systems market, by application, 2018 - 2030 (USD Million)
- Table 55 Australia transcranial magnetic stimulation systems market, by age group, 2018 - 2030 (USD Million)
- Table 56 Thailand transcranial magnetic stimulation systems market, by type, 2018 - 2030 (USD Million)
- Table 57 Thailand transcranial magnetic stimulation systems market, by application, 2018 - 2030 (USD Million)
- Table 58 Thailand transcranial magnetic stimulation systems market, by age group, 2018 - 2030 (USD Million)
- Table 59 South Korea transcranial magnetic stimulation systems market, by type, 2018 - 2030 (USD Million)
- Table 60 South Korea transcranial magnetic stimulation systems market, by application, 2018 - 2030 (USD Million)
- Table 61 South Korea transcranial magnetic stimulation systems market, by age group, 2018 - 2030 (USD Million)
- Table 62 Latin America transcranial magnetic stimulation systems market, by type, 2018 - 2030 (USD Million)
- Table 63 Latin America transcranial magnetic stimulation systems market, by application, 2018 - 2030 (USD Million)
- Table 64 Latin America transcranial magnetic stimulation systems market, by age group, 2018 - 2030 (USD Million)
- Table 65 Latin America transcranial magnetic stimulation systems market, by region, 2018 - 2030 (USD Million)
- Table 66 Brazil transcranial magnetic stimulation systems market, by type, 2018 - 2030 (USD Million)
- Table 67 Brazil transcranial magnetic stimulation systems market, by application, 2018 - 2030 (USD Million)
- Table 68 Brazil transcranial magnetic stimulation systems market, by age group, 2018 - 2030 (USD Million)
- Table 69 Mexico transcranial magnetic stimulation systems market, by type, 2018 - 2030 (USD Million)
- Table 70 Mexico transcranial magnetic stimulation systems market, by application, 2018 - 2030 (USD Million)
- Table 71 Mexico transcranial magnetic stimulation systems market, by age group, 2018 - 2030 (USD Million)
- Table 72 Argentina transcranial magnetic stimulation systems market, by type, 2018 - 2030 (USD Million)
- Table 73 Argentina transcranial magnetic stimulation systems market, by application, 2018 - 2030 (USD Million)
- Table 74 Argentina transcranial magnetic stimulation systems market, by age group, 2018 - 2030 (USD Million)
- Table 75 Middle East and Africa transcranial magnetic stimulation systems market, by type, 2018 - 2030 (USD Million)
- Table 76 Middle East and Africa transcranial magnetic stimulation systems market, by application, 2018 - 2030 (USD Million)
- Table 77 Middle East and Africa transcranial magnetic stimulation systems market, by age group, 2018 - 2030 (USD Million)
- Table 78 Middle East and Africa transcranial magnetic stimulation systems market, by region, 2018 - 2030 (USD Million)
- Table 79 South Africa transcranial magnetic stimulation systems market, by type, 2018 - 2030 (USD Million)
- Table 80 South Africa transcranial magnetic stimulation systems market, by application, 2018 - 2030 (USD Million)
- Table 81 South Africa transcranial magnetic stimulation systems market, by age group, 2018 - 2030 (USD Million)
- Table 82 Saudi Arabia transcranial magnetic stimulation systems market, by type, 2018 - 2030 (USD Million)
- Table 83 Saudi Arabia transcranial magnetic stimulation systems market, by application, 2018 - 2030 (USD Million)
- Table 84 Saudi Arabia transcranial magnetic stimulation systems market, by age group, 2018 - 2030 (USD Million)
- Table 85 UAE transcranial magnetic stimulation systems market, by type, 2018 - 2030 (USD Million)
- Table 86 UAE transcranial magnetic stimulation systems market, by application, 2018 - 2030 (USD Million)
- Table 87 UAE transcranial magnetic stimulation systems market, by age group, 2018 - 2030 (USD Million)
- Table 88 Kuwait transcranial magnetic stimulation systems market, by type, 2018 - 2030 (USD Million)
- Table 89 Kuwait transcranial magnetic stimulation systems market, by application, 2018 - 2030 (USD Million)
- Table 90 Kuwait transcranial magnetic stimulation systems market, by age group, 2018 - 2030 (USD Million)
List of Figures
- Fig. 1 Market research process
- Fig. 2 Data triangulation techniques
- Fig. 3 Primary research pattern
- Fig. 4 Market research approaches
- Fig. 5 Value-chain-based sizing & forecasting
- Fig. 6 QFD modeling for market share assessment
- Fig. 7 Market formulation & validation
- Fig. 8 Transcranial magnetic stimulation systems: Market outlook
- Fig. 9 Transcranial magnetic stimulation systems: Competitive insights
- Fig. 10 Parent market outlook
- Fig. 11 Related/ancillary market outlook
- Fig. 12 Penetration and growth prospect mapping
- Fig. 13 Industry value chain analysis
- Fig. 14 Transcranial magnetic stimulation systems market driver impact
- Fig. 15 Transcranial magnetic stimulation systems market restraint impact
- Fig. 16 Transcranial magnetic stimulation systems market strategic initiatives analysis
- Fig. 17 Transcranial magnetic stimulation systems market: Type movement analysis
- Fig. 18 Transcranial magnetic stimulation systems market: Type outlook and key takeaways
- Fig. 19 Deep transcranial magnetic stimulator market estimates and forecasts, 2018 - 2030 (USD Million)
- Fig. 20 Repetitive transcranial magnetic stimulator market estimates and forecasts, 2018 - 2030 (USD Million)
- Fig. 21 Other market estimates and forecasts, 2018 - 2030 (USD Million)
- Fig. 22 Transcranial magnetic stimulation systems market: Application movement analysis
- Fig. 23 Transcranial magnetic stimulation systems market: Application outlook and key takeaways
- Fig. 24 Alzheimer's disease market estimates and forecasts, 2018 - 2030 (USD Million)
- Fig. 25 Depression market estimates and forecasts, 2018 - 2030 (USD Million)
- Fig. 26 Parkinson's disease market estimates and forecasts, 2018 - 2030 (USD Million)
- Fig. 27 Epilepsy market estimates and forecasts, 2018 - 2030 (USD Million)
- Fig. 28 Others market estimates and forecasts, 2018 - 2030 (USD Million)
- Fig. 29 Transcranial magnetic stimulation systems market: Age Group movement analysis
- Fig. 30 Transcranial magnetic stimulation systems market: Age Group outlook and key takeaways
- Fig. 31 Adults market estimates and forecasts, 2018 - 2030 (USD Million)
- Fig. 32 Children market estimates and forecasts, 2018 - 2030 (USD Million)
- Fig. 33 Global transcranial magnetic stimulation systems market: Regional movement analysis
- Fig. 34 Global transcranial magnetic stimulation systems market: Regional outlook and key takeaways
- Fig. 35 North America market estimates and forecasts, 2018 - 2030 (USD Million)
- Fig. 36 U.S. market estimates and forecasts, 2018 - 2030 (USD Million)
- Fig. 37 Canada market estimates and forecasts, 2018 - 2030 (USD Million)
- Fig. 38 Europe market estimates and forecasts, 2018 - 2030 (USD Million)
- Fig. 39 UK market estimates and forecasts, 2018 - 2030 (USD Million)
- Fig. 40 Germany market estimates and forecasts, 2018 - 2030 (USD Million)
- Fig. 41 France market estimates and forecasts, 2018 - 2030 (USD Million)
- Fig. 42 Italy market estimates and forecasts, 2018 - 2030 (USD Million)
- Fig. 43 Spain market estimates and forecasts, 2018 - 2030 (USD Million)
- Fig. 44 Sweden market estimates and forecasts, 2018 - 2030 (USD Million)
- Fig. 45 Norway market estimates and forecasts, 2018 - 2030 (USD Million)
- Fig. 46 Denmark market estimates and forecasts, 2018 - 2030 (USD Million)
- Fig. 47 Asia Pacific market estimates and forecasts, 2018 - 2030 (USD Million)
- Fig. 48 Japan market estimates and forecasts, 2018 - 2030 (USD Million)
- Fig. 49 China market estimates and forecasts, 2018 - 2030 (USD Million)
- Fig. 50 India market estimates and forecasts, 2018 - 2030 (USD Million)
- Fig. 51 Australia market estimates and forecasts, 2018 - 2030 (USD Million)
- Fig. 52 Thailand market estimates and forecasts, 2018 - 2030 (USD Million)
- Fig. 53 South Korea market estimates and forecasts, 2018 - 2030 (USD Million)
- Fig. 54 Latin America market estimates and forecasts, 2018 - 2030 (USD Million)
- Fig. 55 Brazil market estimates and forecasts, 2018 - 2030 (USD Million)
- Fig. 56 Mexico market estimates and forecasts, 2018 - 2030 (USD Million)
- Fig. 57 Argentina market estimates and forecasts, 2018 - 2030 (USD Million)
- Fig. 58 Middle East and Africa. Market estimates and forecasts, 2018 - 2030 (USD Million)
- Fig. 59 Saudi Arabia market estimates and forecasts, 2018 - 2030 (USD Million)
- Fig. 60 South Africa market estimates and forecasts, 2018 - 2030 (USD Million)
- Fig. 61 UAE market estimates and forecasts, 2018 - 2030 (USD Million)
- Fig. 62 Kuwait market estimates and forecasts, 2018 - 2030 (USD Million)
Transcranial Magnetic Stimulation System Market Growth & Trends:
The global transcranial magnetic stimulation system market is anticipated to reach USD 2.26 billion by 2030 and is projected to register a compound annual growth rate (CAGR) of 9.0% from 2023 to 2030, according to a new report by Grand View Research, Inc.. The transcranial magnetic stimulation system market is expected to grow owing to the increasing prevalence of neurological diseases such as Parkinson's Disease, Alzheimer's Disease, and other neurological problems, along with the increasing technological advancements.
According to FDA in October 2020, due to the COVID-19 public health emergency, there has been a short term negative impact on the market. The decrease was primarily driven by a lower number of transcranial magnetic stimulation systems sold in the quarter. For instance, Neuronetics, Inc. sold 38 systems, down from 43 systems in the first quarter of 2019 as a result of the impact of COVID-19. However, as of March 2020, the active unit installed base in the U.S. was 1,119. This represents an increase of 188 units, or 20%, over the active unit installed base as of March 31, 2019, and an increase of 34 units over the active installed base as of December 31, 2019.
Companies are constantly launching new products in the existing market to expand their product portfolio and increase the revenue of the company. For instance, in July 2022, according to Neuronetics, the FDA approved their NeuroStar Advanced Therapy for Mental Health transcranial magnetic stimulation device for treating anxiety symptoms in people with major depressive disorder. Additionally, the FDA approved the transcranial magnetic stimulation (TMS) system as an additional form of treatment for people with OCD. The non-drug, non-invasive therapy is the first TMS system for depression to receive FDA approval. The transcranial magnetic stimulation system market is predicted to increase at a high rate as a result of these advancements.
Transcranial Magnetic Stimulation System Market Report Highlights:
- By type, Repetitive Transcranial Magnetic Stimulation (rTMS) accounted for the largest market share of 38.5% in 2022. A unique therapy that permits direct activation of deeper and greater brain volumes has been proposed: repetitive transcranial magnetic stimulation (7-10). It is a sophisticated type of brain stimulation that doesn't involve surgery or electrode insertion. Additionally, research has looked into whether rTMS treatment is necessary for psychiatric diseases like unipolar depression, schizophrenia, and bipolar disorder. The market is expanding as a result of physicians' growing preference for and use of rTMS.
- Based on the application, the depression segment is expected to grow at the fastest CAGR of 9.5% over the forecast period. The increasing global prevalence of stress and obesity-induced depression along with technological advancements is expected to boost the market growth in the near future.
- Based on the age group, adults segment dominated the market with a share of over 58.5% in 2022. The increasing prevalence of Parkinson's Disease (PD) along with the increasing government and organizations initiatives are the factors driving the growth of the market.
- Among all regions, the TMS system market in Asia Pacific is expected to grow at the highest CAGR during the forecast period, owing to the increasing number of neurological disorders and the rising number of awareness programs by NGOs. Thus, in turn, transcranial magnetic stimulation system market is expected to grow.
Table of Contents
Chapter 1. Methodology and Scope
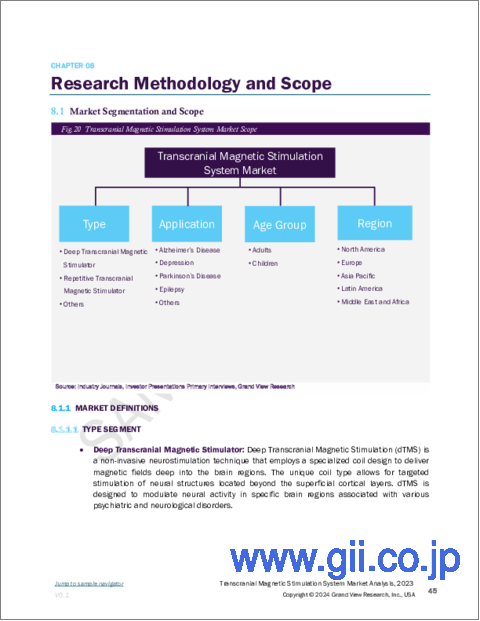
- 1.1. Market Segmentation & Scope
- 1.1.1. Type
- 1.1.2. Application
- 1.1.3. Age Group
- 1.1.4. Regional scope
- 1.1.5. Estimates and forecast timeline
- 1.2. Research Methodology
- 1.3. Information Procurement
- 1.3.1. Purchased database
- 1.3.2. GVR's internal database
- 1.3.3. Secondary sources
- 1.3.4. Primary research
- 1.3.5. Details of primary research
- 1.4. Information or Data Analysis
- 1.5. Market Formulation & Validation
- 1.6. Model Details
- 1.7. List of Secondary Sources
- 1.8. List of Primary Sources
- 1.9. Objectives
Chapter 2. Executive Summary
- 2.1. Market Outlook
- 2.2. Segment Outlook
- 2.2.1. Type outlook
- 2.2.2. Application outlook
- 2.2.3. Age Group Outlook
- 2.2.4. Regional outlook
- 2.3. Competitive Insights
Chapter 3. Transcranial Magnetic Stimulation Systems Market Variables, Trends & Scope
- 3.1. Market Lineage Outlook
- 3.1.1. Parent market outlook
- 3.1.2. Related/ancillary market outlook
- 3.2. Penetration & Growth Prospect Mapping
- 3.3. Market Dynamics
- 3.3.1. Market Driver Analysis
- 3.3.2. Market Restraint Analysis
- 3.4. Transcranial Magnetic Stimulation Systems Market Analysis Tools
- 3.4.1. Industry Analysis - Porter's
- 3.4.1.1. Supplier power
- 3.4.1.2. Buyer power
- 3.4.1.3. Substitution threat
- 3.4.1.4. Threat of new entrant
- 3.4.1.5. Competitive rivalry
- 3.4.2. PESTEL Analysis
- 3.4.2.1. Political landscape
- 3.4.2.2. Technological landscape
- 3.4.2.3. Economic Landscape
- 3.4.1. Industry Analysis - Porter's
Chapter 4. Transcranial Magnetic Stimulation Systems: Type Estimates & Trend Analysis
- 4.1. Transcranial Magnetic Stimulation Systems Market: Key Takeaways
- 4.2. Transcranial Magnetic Stimulation Systems Market: Movement & Market Share Analysis, 2022 & 2030
- 4.3. Deep Transcranial Magnetic Stimulation
- 4.3.1. Deep transcranial magnetic stimulation market estimates and forecasts, 2018 to 2030 (USD Million)
- 4.4. Repetitive Transcranial Magnetic Stimulation
- 4.4.1. Repetitive transcranial magnetic stimulation market estimates and forecasts, 2018 to 2030 (USD Million)
- 4.5. Others
- 4.5.1. Other market estimates and forecasts, 2018 to 2030 (USD Million)
Chapter 5. Transcranial Magnetic Stimulation Systems Market: Application Estimates & Trend Analysis
- 5.1. Transcranial Magnetic Stimulation Systems Market: Key Takeaways
- 5.2. Transcranial Magnetic Stimulation Systems Market: Movement & Market Share Analysis, 2022 & 2030
- 5.3. Alzheimer's Disease
- 5.3.1. Alzheimer's disease market estimates and forecasts, 2018 to 2030 (USD Million)
- 5.4. Depression
- 5.4.1. Depression market estimates and forecasts, 2018 to 2030 (USD Million)
- 5.5. Parkinson's Disease
- 5.5.1. Parkinson's disease market estimates and forecasts, 2018 to 2030 (USD Million)
- 5.6. Epilepsy
- 5.6.1. Epilepsy market estimates and forecasts, 2018 to 2030 (USD Million)
- 5.7. Others
- 5.7.1. Other market estimates and forecasts, 2018 to 2030 (USD Million)
Chapter 6. Transcranial Magnetic Stimulation Systems Market: Age Group Estimates & Trend Analysis
- 6.1. Transcranial Magnetic Stimulation Systems Market: Key Takeaways
- 6.2. Transcranial Magnetic Stimulation Systems Market: Movement & Market Share Analysis, 2022 & 2030
- 6.3. Adults
- 6.3.1. Adults market estimates and forecasts, 2018 to 2030 (USD Million)
- 6.4. Children
- 6.4.1. Children market estimates and forecasts, 2018 to 2030 (USD Million)
Chapter 7. Transcranial Magnetic Stimulation Systems Market: Regional Estimates & Trend Analysis
- 7.1. Regional Outlook
- 7.2. Transcranial Magnetic Stimulation Systems Market by Region: Key Marketplace Takeaway
- 7.3. North America
- 7.3.1. Market estimates and forecasts, 2018 - 2030 (Revenue, USD Million)
- 7.3.2. U.S.
- 7.3.2.1. Market estimates and forecasts, 2018 - 2030 (Revenue, USD Million)
- 7.3.3. Canada
- 7.3.3.1. Market estimates and forecasts, 2018 - 2030 (Revenue, USD Million)
- 7.4. Europe
- 7.4.1. UK
- 7.4.1.1. Market estimates and forecasts, 2018 - 2030 (Revenue, USD Million)
- 7.4.2. Germany
- 7.4.2.1. Market estimates and forecasts, 2018 - 2030 (Revenue, USD Million)
- 7.4.3. France
- 7.4.3.1. Market estimates and forecasts, 2018 - 2030 (Revenue, USD Million)
- 7.4.4. Italy
- 7.4.4.1. Market estimates and forecasts, 2018 - 2030 (Revenue, USD Million)
- 7.4.5. Spain
- 7.4.5.1. Market estimates and forecasts, 2018 - 2030 (Revenue, USD Million)
- 7.4.6. Sweden
- 7.4.6.1. Market estimates and forecasts, 2018 - 2030 (Revenue, USD Million)
- 7.4.7. Norway
- 7.4.7.1. Market estimates and forecasts, 2018 - 2030 (Revenue, USD Million)
- 7.4.8. Denmark
- 7.4.8.1. Market estimates and forecasts, 2018 - 2030 (Revenue, USD Million)
- 7.4.1. UK
- 7.5. Asia Pacific
- 7.5.1. Japan
- 7.5.1.1. Market estimates and forecasts, 2018 - 2030 (Revenue, USD Million)
- 7.5.2. China
- 7.5.2.1. Market estimates and forecasts, 2018 - 2030 (Revenue, USD Million)
- 7.5.3. India
- 7.5.3.1. Market estimates and forecasts, 2018 - 2030 (Revenue, USD Million)
- 7.5.4. Australia
- 7.5.4.1. Market estimates and forecasts, 2018 - 2030 (Revenue, USD Million)
- 7.5.5. Thailand
- 7.5.5.1. Market estimates and forecasts, 2018 - 2030 (Revenue, USD Million)
- 7.5.6. South Korea
- 7.5.6.1. Market estimates and forecasts, 2018 - 2030 (Revenue, USD Million)
- 7.5.1. Japan
- 7.6. Latin America
- 7.6.1. Brazil
- 7.6.1.1. Market estimates and forecasts, 2018 - 2030 (Revenue, USD Million)
- 7.6.2. Mexico
- 7.6.2.1. Market estimates and forecasts, 2018 - 2030 (Revenue, USD Million)
- 7.6.3. Argentina
- 7.6.3.1. Market estimates and forecasts, 2018 - 2030 (Revenue, USD Million)
- 7.6.1. Brazil
- 7.7. MEA
- 7.7.1. Saudi Arabia
- 7.7.1.1. Market estimates and forecasts, 2018 - 2030 (Revenue, USD Million)
- 7.7.2. South Africa
- 7.7.2.1. Market estimates and forecasts, 2018 - 2030 (Revenue, USD Million)
- 7.7.3. UAE
- 7.7.3.1. Market estimates and forecasts, 2018 - 2030 (Revenue, USD Million)
- 7.7.4. Kuwait
- 7.7.4.1. Market estimates and forecasts, 2018 - 2030 (Revenue, USD Million)
- 7.7.1. Saudi Arabia
Chapter 8. Competitive Landscape
- 8.1. Recent Developments & Impact Analysis, By Key Market Participants
- 8.2. Market Participant Categorization
- 8.2.1. BrainsWay
- 8.2.1.1. Company overview
- 8.2.1.2. Financial performance
- 8.2.1.3. Product benchmarking
- 8.2.1.4. Strategic initiatives
- 8.2.2. Magstim
- 8.2.2.1. Company Overview
- 8.2.2.2. Financial performance
- 8.2.2.3. Product benchmarking
- 8.2.2.4. Strategic initiatives
- 8.2.3. Nexstim
- 8.2.3.1. Company overview
- 8.2.3.2. Financial performance
- 8.2.3.3. Product benchmarking
- 8.2.3.4. Strategic initiatives
- 8.2.4. Salience
- 8.2.4.1. Company overview
- 8.2.4.2. Financial performance
- 8.2.4.3. Product benchmarking
- 8.2.4.4. Strategic initiatives
- 8.2.5. MagVenture A/S
- 8.2.5.1. Company overview
- 8.2.5.2. Financial performance
- 8.2.5.3. Product benchmarking
- 8.2.5.4. Strategic initiatives
- 8.2.6. eNeura Inc.
- 8.2.6.1. Company overview
- 8.2.6.2. Financial performance
- 8.2.6.3. Product benchmarking
- 8.2.6.4. Strategic initiatives
- 8.2.1. BrainsWay