|
|
市場調査レポート
商品コード
1394981
生鮮野菜市場規模:野菜タイプ、最終用途、流通チャネル、地域別展望・予測、2023年~2032年Fresh Vegetables Market Size - By Vegetable Type, End-use, Distribution Channel, Regional Outlook & Forecast, 2023 - 2032 |
||||||
|
|
|||||||
|
● お客様のご希望に応じて、既存データの加工や未掲載情報(例:国別セグメント)の追加などの対応が可能です。 詳細はお問い合わせください。 |
|||||||


| 生鮮野菜市場規模:野菜タイプ、最終用途、流通チャネル、地域別展望・予測、2023年~2032年 |
|
出版日: 2023年10月04日
発行: Global Market Insights Inc.
ページ情報: 英文 150 Pages
納期: 2~3営業日
|
- 全表示
- 概要
- 図表
- 目次
生鮮野菜市場規模は、オンライン食料品ショッピングの増加傾向に後押しされ、2023年から2032年にかけてCAGR 3.3%で拡大すると推定されます。
eコマース・プラットフォームへの嗜好の高まりに伴い、幅広い生鮮野菜へのアクセスが便利なオンライン食料品ショッピングへの消費者の嗜好が大幅に高まっています。さらに、いくつかの業界参加者は、ユーザーフレンドリーなインターフェイス、シームレスなナビゲーション、および多様な新鮮な野菜のオプションを消費者に提供するための革新的なプラットフォームの開発に焦点を当てています。新しいオンライン食料品アプリが提供するアクセシビリティと効率性は、消費者の関与の増加にも寄与しており、業界の成長をさらに加速させています。一例を挙げると、2023年2月、電子食料品プラットフォームのZeptoは、新鮮な野菜や果物の入手可能性を拡大する一方で、協力関係にある農家のサプライ・チェーンを自動化する農家エンゲージメント・アプリを導入しました。
生鮮野菜産業は、野菜タイプ、最終用途、流通チャネル、地域に区分されます。
野菜タイプ別では、根菜類セグメントの市場シェアが2022年に高い需要を目の当たりにし、2023年から2032年にかけて着実な成長を記録すると予測されています。ニンジン、ジャガイモ、ビーツを含む根菜類は、その高い栄養価、汎用性、料理の魅力により、様々な料理の主食として人気を集めています。さらに、根菜類に関連する健康上の利点に対する意識の高まりと、調理における多様な用途が相まって、同分野の成長を促進すると思われます。
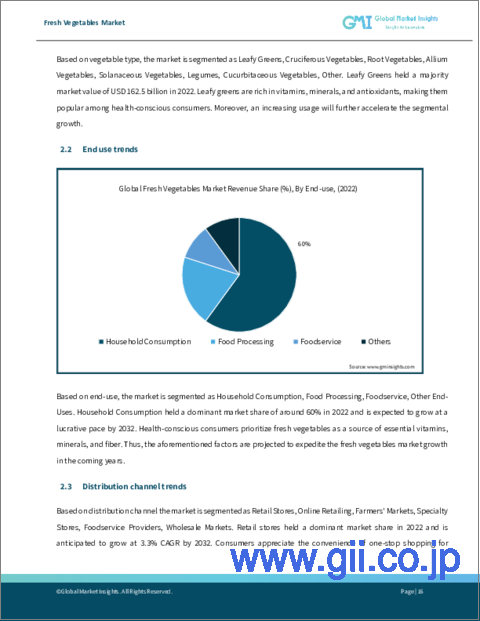
最終用途に基づくと、外食分野の生鮮野菜市場は2023年から2032年にかけて大きな成長を記録するとみられています。レストラン、ホテル、ケータリング・サービスでは、健康的で多様な食品を求める消費者の志向に合わせて、新鮮で多様な野菜に対する需要が高まっており、生鮮野菜の需要を急増させる可能性が高いです。また、料理の視覚的な魅力と栄養価を高めることが重視されるようになったことも、健康的で風味豊かな食事を調理するための生鮮野菜の使用増加に寄与しています。
アジア太平洋地域の生鮮野菜産業は、人口の急増、都市化の進展、健康的な食生活への関心の高まりにより、2032年まで顕著な成長率で拡大する見通しです。豊かな食文化遺産を持つ同地域では、新鮮野菜の価値が高く評価され、多様で風味豊かな料理に取り入れられています。
さらに、複数の業界参加者が地元の農家を積極的に支援し、有機野菜や新鮮な野菜に対する需要の高まりに応えており、この地域の業界の見通しをさらに強めています。例えば、2022年12月、アマゾン・リテール・インディアは、農家に力を与え、信頼できるオーガニック認証を受けた高品質の果物や野菜を顧客に提供するという継続的なコミットメントの一環として、インドのプネーに11番目の農家集荷施設を開設しました。
目次
第1章 調査手法と調査範囲
第2章 エグゼクティブサマリー
第3章 生鮮野菜産業洞察
- エコシステム分析
- 業界への影響要因
- 促進要因
- 業界の潜在的リスク&課題
- 成長可能性分析
- COVID-19影響分析
- 規制状況
- 米国
- 欧州
- 価格分析、2022年
- 償還シナリオ
- 技術展望
- 今後の市場動向
- GAP分析
- ポーター分析
- PESTEL分析
- ロシア・ウクライナ戦争の影響
第4章 競合情勢
- イントロダクション
- 企業マトリックス分析
- 世界企業シェア分析
- 競合のポジショニングマトリックス
- 戦略ダッシュボード
第5章 生鮮野菜の市場規模・予測:野菜タイプ別、2018年~2032年
- 葉物野菜
- レタス
- ほうれん草
- ケール
- スイスチャード
- その他
- アブラナ科の野菜
- ブロッコリー
- カリフラワー
- キャベツ
- 芽キャベツ
- その他
- 根菜類
- ニンジン
- ジャガイモ
- ビーツ
- 大根
- その他
- アリウム野菜
- タマネギ
- ニンニク
- ネギ
- エシャロット
- その他
- ナス科の野菜
- トマト
- ピーマン
- ナス
- ジャガイモ
- その他
- 豆類
- エンドウ豆
- 豆類
- レンズ豆
- その他
- ウリ科野菜
- キュウリ
- ズッキーニ
- カボチャ
- メロン
- その他
- その他
- トウモロコシ
- アスパラガス
- アーティチョーク
- その他
第6章 生鮮野菜の市場規模・予測:最終用途別、2018年~2032年
- 家庭消費
- 食品加工
- 外食
- その他の最終用途
第7章 生鮮野菜の市場規模・予測:流通チャネル別、2018年~2032年
- 小売店舗
- オンライン小売
- ファーマーズマーケット
- 専門店
- 外食産業
- 卸売市場
第8章 生鮮野菜の市場規模・予測:地域別、2018年~2032年
- 主要動向:地域別
- 北米
- 米国
- カナダ
- 欧州
- ドイツ
- 英国
- フランス
- スペイン
- イタリア
- アジア太平洋
- 日本
- 中国
- インド
- オーストラリア
- 韓国
- インドネシア
- マレーシア
- ラテンアメリカ
- ブラジル
- メキシコ
- アルゼンチン
- 中東・アフリカ
- 南アフリカ
- サウジアラビア
- アラブ首長国連邦
- エジプト
第9章 企業プロファイル
- Dole Food Company, Inc.
- Fresh Del Monte Produce Inc.
- The Kraft Heinz Company
- Conagra Brands, Inc.
- Taylor Farms
- Calavo Growers, Inc.
- NestléS.A.
- Ardo Group
- Bonduelle Group
- Green Giant(a subsidiary of B&G Foods)
- Mann Packing Company
- Church Brothers Farms
- SunFed
- Lipman Family Farms
Data Tables
- TABLE 1. Market revenue, by vegetable type (2022)
- TABLE 2. Market revenue, by end-use (2022)
- TABLE 3. Market revenue, by distribution channel (2022)
- TABLE 4. Market revenue, by region (2022)
- TABLE 5. Global fresh vegetables market size, 2018 - 2032 (USD Billion)
- TABLE 6. Global fresh vegetables market size, 2018 - 2032 (Kilo Tons)
- TABLE 7. Global fresh vegetables market size, by region, 2018 - 2032 (USD Billion)
- TABLE 8. Global fresh vegetables market size, by region, 2018 - 2032 (Kilo Tons)
- TABLE 9. Global fresh vegetables market size, by vegetable type, 2018 - 2032 (USD Billion)
- TABLE 10. Global fresh vegetables market size, by vegetable type, 2018 - 2032 (Kilo Tons)
- TABLE 11. Global fresh vegetables market size, by end-use, 2018 - 2032 (USD Billion)
- TABLE 12. Global fresh vegetables market size, by end-use, 2018 - 2032 (Kilo Tons)
- TABLE 13. Global fresh vegetables market size, by distribution channel, 2018 - 2032 (USD Billion)
- TABLE 14. Global fresh vegetables market size, by distribution channel, 2018 - 2032 (Kilo Tons)
- TABLE 15. Industry impact forces
- TABLE 16. North America fresh vegetables market size, by country, 2018 - 2032 (USD Billion)
- TABLE 17. North America fresh vegetables market size, by country, 2018 - 2032 (Kilo Tons)
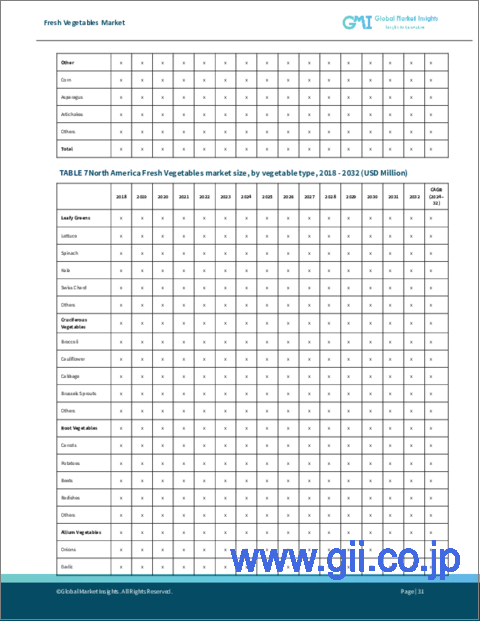
- TABLE 18. North America fresh vegetables market size, by vegetable type, 2018 - 2032 (USD Billion)
- TABLE 19. North America fresh vegetables market size, by vegetable type, 2018 - 2032 (Kilo Tons)
- TABLE 20. North America fresh vegetables market size, by end-use, 2018 - 2032 (USD Billion)
- TABLE 21. North America fresh vegetables market size, by end-use, 2018 - 2032 (Kilo Tons)
- TABLE 22. North America fresh vegetables market size, by distribution channel, 2018 - 2032 (USD Billion)
- TABLE 23. North America fresh vegetables market size, by distribution channel, 2018 - 2032 (Kilo Tons)
- TABLE 24. U.S. fresh vegetables market size, by vegetable type, 2018 - 2032 (USD Billion)
- TABLE 25. U.S. fresh vegetables market size, by vegetable type, 2018 - 2032 (Kilo Tons)
- TABLE 26. U.S. fresh vegetables market size, by end-use, 2018 - 2032 (USD Billion)
- TABLE 27. U.S. fresh vegetables market size, by end-use, 2018 - 2032 (Kilo Tons)
- TABLE 28. U.S. fresh vegetables market size, by distribution channel, 2018 - 2032 (USD Billion)
- TABLE 29. U.S. fresh vegetables market size, by distribution channel, 2018 - 2032 (Kilo Tons)
- TABLE 30. Canada fresh vegetables market size, by vegetable type, 2018 - 2032 (USD Billion)
- TABLE 31. Canada fresh vegetables market size, by vegetable type, 2018 - 2032 (Kilo Tons)
- TABLE 32. Canada fresh vegetables market size, by end-use, 2018 - 2032 (USD Billion)
- TABLE 33. Canada fresh vegetables market size, by end-use, 2018 - 2032 (Kilo Tons)
- TABLE 34. Canada fresh vegetables market size, by distribution channel, 2018 - 2032 (USD Billion)
- TABLE 35. Canada fresh vegetables market size, by distribution channel, 2018 - 2032 (Kilo Tons)
- TABLE 36. Europe fresh vegetables market size, by country, 2018 - 2032 (USD Billion)
- TABLE 37. Europe fresh vegetables market size, by country, 2018 - 2032 (Kilo Tons)
- TABLE 38. Europe fresh vegetables market size, by vegetable type, 2018 - 2032 (USD Billion)
- TABLE 39. Europe fresh vegetables market size, by vegetable type, 2018 - 2032 (Kilo Tons)
- TABLE 40. Europe fresh vegetables market size, by end-use, 2018 - 2032 (USD Billion)
- TABLE 41. Europe fresh vegetables market size, by end-use, 2018 - 2032 (Kilo Tons)
- TABLE 42. Europe fresh vegetables market size, by distribution channel, 2018 - 2032 (USD Billion)
- TABLE 43. Europe fresh vegetables market size, by distribution channel, 2018 - 2032 (Kilo Tons)
- TABLE 44. Germany fresh vegetables market size, by vegetable type, 2018 - 2032 (USD Billion)
- TABLE 45. Germany fresh vegetables market size, by vegetable type, 2018 - 2032 (Kilo Tons)
- TABLE 46. Germany fresh vegetables market size, by end-use, 2018 - 2032 (USD Billion)
- TABLE 47. Germany fresh vegetables market size, by end-use, 2018 - 2032 (Kilo Tons)
- TABLE 48. Germany fresh vegetables market size, by distribution channel, 2018 - 2032 (USD Billion)
- TABLE 49. Germany fresh vegetables market size, by distribution channel, 2018 - 2032 (Kilo Tons)
- TABLE 50. UK fresh vegetables market size, by vegetable type, 2018 - 2032 (USD Billion)
- TABLE 51. UK fresh vegetables market size, by vegetable type, 2018 - 2032 (Kilo Tons)
- TABLE 52. UK fresh vegetables market size, by end-use, 2018 - 2032 (USD Billion)
- TABLE 53. UK fresh vegetables market size, by end-use, 2018 - 2032 (Kilo Tons)
- TABLE 54. UK fresh vegetables market size, by distribution channel, 2018 - 2032 (USD Billion)
- TABLE 55. UK fresh vegetables market size, by distribution channel, 2018 - 2032 (Kilo Tons)
- TABLE 56. France fresh vegetables market size, by vegetable type, 2018 - 2032 (USD Billion)
- TABLE 57. France fresh vegetables market size, by vegetable type, 2018 - 2032 (Kilo Tons)
- TABLE 58. France fresh vegetables market size, by end-use, 2018 - 2032 (USD Billion)
- TABLE 59. France fresh vegetables market size, by end-use, 2018 - 2032 (Kilo Tons)
- TABLE 60. France fresh vegetables market size, by distribution channel, 2018 - 2032 (USD Billion)
- TABLE 61. France fresh vegetables market size, by distribution channel, 2018 - 2032 (Kilo Tons)
- TABLE 62. Spain fresh vegetables market size, by vegetable type, 2018 - 2032 (USD Billion)
- TABLE 63. Spain fresh vegetables market size, by vegetable type, 2018 - 2032 (Kilo Tons)
- TABLE 64. Spain fresh vegetables market size, by end-use, 2018 - 2032 (USD Billion)
- TABLE 65. Spain fresh vegetables market size, by end-use, 2018 - 2032 (Kilo Tons)
- TABLE 66. Spain fresh vegetables market size, by distribution channel, 2018 - 2032 (USD Billion)
- TABLE 67. Spain fresh vegetables market size, by distribution channel, 2018 - 2032 (Kilo Tons)
- TABLE 68. Italy fresh vegetables market size, by vegetable type, 2018 - 2032 (USD Billion)
- TABLE 69. Italy fresh vegetables market size, by vegetable type, 2018 - 2032 (Kilo Tons)
- TABLE 70. Italy fresh vegetables market size, by end-use, 2018 - 2032 (USD Billion)
- TABLE 71. Italy fresh vegetables market size, by end-use, 2018 - 2032 (Kilo Tons)
- TABLE 72. Italy fresh vegetables market size, by distribution channel, 2018 - 2032 (USD Billion)
- TABLE 73. Italy fresh vegetables market size, by distribution channel, 2018 - 2032 (Kilo Tons)
- TABLE 74. Asia Pacific fresh vegetables market size, by country, 2018 - 2032 (USD Billion)
- TABLE 75. Asia Pacific fresh vegetables market size, by country, 2018 - 2032 (Kilo Tons)
- TABLE 76. Asia Pacific fresh vegetables market size, by vegetable type, 2018 - 2032 (USD Billion)
- TABLE 77. Asia Pacific fresh vegetables market size, by vegetable type, 2018 - 2032 (Kilo Tons)
- TABLE 78. Asia Pacific fresh vegetables market size, by end-use, 2018 - 2032 (USD Billion)
- TABLE 79. Asia Pacific fresh vegetables market size, by end-use, 2018 - 2032 (Kilo Tons)
- TABLE 80. Asia Pacific fresh vegetables market size, by distribution channel, 2018 - 2032 (USD Billion)
- TABLE 81. Asia Pacific fresh vegetables market size, by distribution channel, 2018 - 2032 (Kilo Tons)
- TABLE 82. China fresh vegetables market size, by vegetable type, 2018 - 2032 (USD Billion)
- TABLE 83. China fresh vegetables market size, by vegetable type, 2018 - 2032 (Kilo Tons)
- TABLE 84. China fresh vegetables market size, by end-use, 2018 - 2032 (USD Billion)
- TABLE 85. China fresh vegetables market size, by end-use, 2018 - 2032 (Kilo Tons)
- TABLE 86. China fresh vegetables market size, by distribution channel, 2018 - 2032 (USD Billion)
- TABLE 87. China fresh vegetables market size, by distribution channel, 2018 - 2032 (Kilo Tons)
- TABLE 88. Japan fresh vegetables market size, by vegetable type, 2018 - 2032 (USD Billion)
- TABLE 89. Japan fresh vegetables market size, by vegetable type, 2018 - 2032 (Kilo Tons)
- TABLE 90. Japan fresh vegetables market size, by end-use, 2018 - 2032 (USD Billion)
- TABLE 91. Japan fresh vegetables market size, by end-use, 2018 - 2032 (Kilo Tons)
- TABLE 92. Japan fresh vegetables market size, by distribution channel, 2018 - 2032 (USD Billion)
- TABLE 93. Japan fresh vegetables market size, by distribution channel, 2018 - 2032 (Kilo Tons)
- TABLE 94. India fresh vegetables market size, by vegetable type, 2018 - 2032 (USD Billion)
- TABLE 95. India fresh vegetables market size, by vegetable type, 2018 - 2032 (Kilo Tons)
- TABLE 96. India fresh vegetables market size, by end-use, 2018 - 2032 (USD Billion)
- TABLE 97. India fresh vegetables market size, by end-use, 2018 - 2032 (Kilo Tons)
- TABLE 98. India fresh vegetables market size, by distribution channel, 2018 - 2032 (USD Billion)
- TABLE 99. India fresh vegetables market size, by distribution channel, 2018 - 2032 (Kilo Tons)
- TABLE 100. Australia fresh vegetables market size, by vegetable type, 2018 - 2032 (USD Billion)
- TABLE 101. Australia fresh vegetables market size, by vegetable type, 2018 - 2032 (Kilo Tons)
- TABLE 102. Australia fresh vegetables market size, by end-use, 2018 - 2032 (USD Billion)
- TABLE 103. Australia fresh vegetables market size, by end-use, 2018 - 2032 (Kilo Tons)
- TABLE 104. Australia fresh vegetables market size, by distribution channel, 2018 - 2032 (USD Billion)
- TABLE 105. Australia fresh vegetables market size, by distribution channel, 2018 - 2032 (Kilo Tons)
- TABLE 106. South Korea fresh vegetables market size, by vegetable type, 2018 - 2032 (USD Billion)
- TABLE 107. South Korea fresh vegetables market size, by vegetable type, 2018 - 2032 (Kilo Tons)
- TABLE 108. South Korea fresh vegetables market size, by end-use, 2018 - 2032 (USD Billion)
- TABLE 109. South Korea fresh vegetables market size, by end-use, 2018 - 2032 (Kilo Tons)
- TABLE 110. South Korea fresh vegetables market size, by distribution channel, 2018 - 2032 (USD Billion)
- TABLE 111. South Korea fresh vegetables market size, by distribution channel, 2018 - 2032 (Kilo Tons)
- TABLE 112. Indonesia fresh vegetables market size, by vegetable type, 2018 - 2032 (USD Billion)
- TABLE 113. Indonesia fresh vegetables market size, by vegetable type, 2018 - 2032 (Kilo Tons)
- TABLE 114. Indonesia fresh vegetables market size, by end-use, 2018 - 2032 (USD Billion)
- TABLE 115. Indonesia fresh vegetables market size, by end-use, 2018 - 2032 (Kilo Tons)
- TABLE 116. Indonesia fresh vegetables market size, by distribution channel, 2018 - 2032 (USD Billion)
- TABLE 117. Indonesia fresh vegetables market size, by distribution channel, 2018 - 2032 (Kilo Tons)
- TABLE 118. Malaysia fresh vegetables market size, by vegetable type, 2018 - 2032 (USD Billion)
- TABLE 119. Malaysia fresh vegetables market size, by vegetable type, 2018 - 2032 (Kilo Tons)
- TABLE 120. Malaysia fresh vegetables market size, by end-use, 2018 - 2032 (USD Billion)
- TABLE 121. Malaysia fresh vegetables market size, by end-use, 2018 - 2032 (Kilo Tons)
- TABLE 122. Malaysia fresh vegetables market size, by distribution channel, 2018 - 2032 (USD Billion)
- TABLE 123. Malaysia fresh vegetables market size, by distribution channel, 2018 - 2032 (Kilo Tons)
- TABLE 124. Latin America fresh vegetables market size, by country, 2018 - 2032 (USD Billion)
- TABLE 125. Latin America fresh vegetables market size, by country, 2018 - 2032 (Kilo Tons)
- TABLE 126. Latin America fresh vegetables market size, by vegetable type, 2018 - 2032 (USD Billion)
- TABLE 127. Latin America fresh vegetables market size, by vegetable type, 2018 - 2032 (Kilo Tons)
- TABLE 128. Latin America fresh vegetables market size, by end-use, 2018 - 2032 (USD Billion)
- TABLE 129. Latin America fresh vegetables market size, by end-use, 2018 - 2032 (Kilo Tons)
- TABLE 130. Latin America fresh vegetables market size, by distribution channel, 2018 - 2032 (USD Billion)
- TABLE 131. Latin America fresh vegetables market size, by distribution channel, 2018 - 2032 (Kilo Tons)
- TABLE 132. Brazil fresh vegetables market size, by vegetable type, 2018 - 2032 (USD Billion)
- TABLE 133. Brazil fresh vegetables market size, by vegetable type, 2018 - 2032 (Kilo Tons)
- TABLE 134. Brazil fresh vegetables market size, by end-use, 2018 - 2032 (USD Billion)
- TABLE 135. Brazil fresh vegetables market size, by end-use, 2018 - 2032 (Kilo Tons)
- TABLE 136. Brazil fresh vegetables market size, by distribution channel, 2018 - 2032 (USD Billion)
- TABLE 137. Brazil fresh vegetables market size, by distribution channel, 2018 - 2032 (Kilo Tons)
- TABLE 138. Mexico fresh vegetables market size, by vegetable type, 2018 - 2032 (USD Billion)
- TABLE 139. Mexico fresh vegetables market size, by vegetable type, 2018 - 2032 (Kilo Tons)
- TABLE 140. Mexico fresh vegetables market size, by end-use, 2018 - 2032 (USD Billion)
- TABLE 141. Mexico fresh vegetables market size, by end-use, 2018 - 2032 (Kilo Tons)
- TABLE 142. Mexico fresh vegetables market size, by distribution channel, 2018 - 2032 (USD Billion)
- TABLE 143. Mexico fresh vegetables market size, by distribution channel, 2018 - 2032 (Kilo Tons)
- TABLE 144. Argentina fresh vegetables market size, by vegetable type, 2018 - 2032 (USD Billion)
- TABLE 145. Argentina fresh vegetables market size, by vegetable type, 2018 - 2032 (Kilo Tons)
- TABLE 146. Argentina fresh vegetables market size, by end-use, 2018 - 2032 (USD Billion)
- TABLE 147. Argentina fresh vegetables market size, by end-use, 2018 - 2032 (Kilo Tons)
- TABLE 148. Argentina fresh vegetables market size, by distribution channel, 2018 - 2032 (USD Billion)
- TABLE 149. Argentina fresh vegetables market size, by distribution channel, 2018 - 2032 (Kilo Tons)
- TABLE 150. MEA fresh vegetables market size, by country, 2018 - 2032 (USD Billion)
- TABLE 151. MEA fresh vegetables market size, by country, 2018 - 2032 (Kilo Tons)
- TABLE 152. MEA fresh vegetables market size, by vegetable type, 2018 - 2032 (USD Billion)
- TABLE 153. MEA fresh vegetables market size, by vegetable type, 2018 - 2032 (Kilo Tons)
- TABLE 154. MEA fresh vegetables market size, by end-use, 2018 - 2032 (USD Billion)
- TABLE 155. MEA fresh vegetables market size, by end-use, 2018 - 2032 (Kilo Tons)
- TABLE 156. MEA fresh vegetables market size, by distribution channel, 2018 - 2032 (USD Billion)
- TABLE 157. MEA fresh vegetables market size, by distribution channel, 2018 - 2032 (Kilo Tons)
- TABLE 158. South Africa fresh vegetables market size, by vegetable type, 2018 - 2032 (USD Billion)
- TABLE 159. South Africa fresh vegetables market size, by vegetable type, 2018 - 2032 (Kilo Tons)
- TABLE 160. South Africa fresh vegetables market size, by end-use, 2018 - 2032 (USD Billion)
- TABLE 161. South Africa fresh vegetables market size, by end-use, 2018 - 2032 (Kilo Tons)
- TABLE 162. South Africa fresh vegetables market size, by distribution channel, 2018 - 2032 (USD Billion)
- TABLE 163. South Africa fresh vegetables market size, by distribution channel, 2018 - 2032 (Kilo Tons)
- TABLE 164. Saudi Arabia fresh vegetables market size, by vegetable type, 2018 - 2032 (USD Billion)
- TABLE 165. Saudi Arabia fresh vegetables market size, by vegetable type, 2018 - 2032 (Kilo Tons)
- TABLE 166. Saudi Arabia fresh vegetables market size, by end-use, 2018 - 2032 (USD Billion)
- TABLE 167. Saudi Arabia fresh vegetables market size, by end-use, 2018 - 2032 (Kilo Tons)
- TABLE 168. Saudi Arabia fresh vegetables market size, by distribution channel, 2018 - 2032 (USD Billion)
- TABLE 169. Saudi Arabia fresh vegetables market size, by distribution channel, 2018 - 2032 (Kilo Tons)
- TABLE 170. UAE fresh vegetables market size, by vegetable type, 2018 - 2032 (USD Billion)
- TABLE 171. UAE fresh vegetables market size, by vegetable type, 2018 - 2032 (Kilo Tons)
- TABLE 172. UAE fresh vegetables market size, by end-use, 2018 - 2032 (USD Billion)
- TABLE 173. UAE fresh vegetables market size, by end-use, 2018 - 2032 (Kilo Tons)
- TABLE 174. UAE fresh vegetables market size, by distribution channel, 2018 - 2032 (USD Billion)
- TABLE 175. UAE fresh vegetables market size, by distribution channel, 2018 - 2032 (Kilo Tons)
- TABLE 176. Egypt fresh vegetables market size, by vegetable type, 2018 - 2032 (USD Billion)
- TABLE 177. Egypt fresh vegetables market size, by vegetable type, 2018 - 2032 (Kilo Tons)
- TABLE 178. Egypt fresh vegetables market size, by end-use, 2018 - 2032 (USD Billion)
- TABLE 179. Egypt fresh vegetables market size, by end-use, 2018 - 2032 (Kilo Tons)
- TABLE 180. Egypt fresh vegetables market size, by distribution channel, 2018 - 2032 (USD Billion)
- TABLE 181. Egypt fresh vegetables market size, by distribution channel, 2018 - 2032 (Kilo Tons)
Charts & Figures
- FIG. 1 Industry segmentation
- FIG. 2 Market estimation and forecast methodology
- FIG. 3 Breakdown of primary participants
- FIG. 4 Fresh vegetables industry, 360 degree synopsis, 2018 - 2032
- FIG. 5 Industry landscape, 2018-2032 (USD Million)
- FIG. 6 Growth potential analysis
- FIG. 7 Porter's analysis
- FIG. 8 PESTEL analysis
- FIG. 9 Company matrix analysis, 2022
- FIG. 10 Strategy dashboard, 2022
Fresh Vegetables Market size is estimated to expand at 3.3% CAGR from 2023-2032 propelled by the rising trend of online grocery shopping.
With the surging preference for E-commerce platforms, the consumer preference for online grocery shopping due to the convenient access to wide range of fresh vegetables has significantly increased. Additionally, several industry participants are focusing on the development of innovative platforms to provide consumers with user-friendly interfaces, seamless navigation, and diverse fresh vegetable options. The accessibility and efficiency offered by new online grocery apps are also contributing to increased consumer engagement, further accelerating the industry growth. To cite an instance, in February 2023, Zepto, an e-grocery platform, introduced a farmer engagement app to automate supply chains for farmers with whom it works while expanding the availability of fresh fruits and vegetables.
The fresh vegetables industry is segmented into vegetable type, end-use, distribution channel, and region.
In terms of vegetable type, the market share from the root vegetables segment witnessed high demand in 2022 and is anticipated to record steady growth from 2023-2032. Root vegetables, including carrots, potatoes, and beets, are gaining popularity as staples in various cuisines due to their high nutritional value, versatility, and culinary appeal. Moreover, the rising awareness of the health benefits associated with root vegetables coupled with their diverse application in cooking will fuel the segment growth.
Based on end-use, the fresh vegetables market from the food service segment is set to record significant growth between 2023 and 2032. The growing demand from restaurants, hotels, and catering services for fresh and diverse vegetables to match the consumer inclination towards healthy and varied food options is likely to surge the demand for fresh vegetables. The increasing emphasis on enhancing the visual appeal and nutritional content of dishes is also contributing to the increasing use of fresh vegetables to prepare wholesome and flavorful meals.
Asia Pacific fresh vegetables industry is poised to expand at a notable growth rate through 2032 due to the burgeoning population, increasing urbanization, and the rising focus on healthy diets across the region. With rich culinary heritage, the region is recording high value on fresh vegetables, incorporating them into diverse and flavorful dishes.
Additionally, several industry participants are actively supporting local farmers and meeting the rising demand for organic and fresh produce, further augmenting the regional industry outlook. For instance, in December 2022, Amazon Retail India launched its eleventh farmer collecting facility in Pune, India, as part of its ongoing commitment for empowering farmers and providing customers with trustworthy, certified organic high-quality fruits and vegetables.
Table of Contents
Chapter 1 Methodology & Scope
- 1.1 Industry coverage
- 1.2 Market scope & definition
- 1.3 Base estimates & calculations
- 1.3.1 Data collection
- 1.4 Forecast parameters
- 1.5 COVID-19 impact analysis at global level
- 1.6 Data validation
- 1.7 Data Sources
- 1.7.1 Primary
- 1.7.2 Secondary
- 1.7.2.1 Paid sources
- 1.7.2.2 Unpaid sources
Chapter 2 Executive Summary
- 2.1 Fresh vegetables industry 360 degree synopsis, 2018 - 2032
- 2.2 Business trends
- 2.3 Vegetable type trends
- 2.4 End-use trends
- 2.5 Distribution channel trends
- 2.6 Regional trends
Chapter 3 Fresh vegetables Industry Insights
- 3.1 Industry ecosystem analysis
- 3.2 Industry impact forces
- 3.2.1 Growth drivers
- 3.2.2 Industry pitfalls & challenges
- 3.3 Growth potential analysis
- 3.3.1 By vegetable type
- 3.3.2 By end-use
- 3.3.3 By distribution channel
- 3.4 COVID- 19 impact analysis
- 3.5 Regulatory landscape
- 3.5.1 U.S.
- 3.5.2 Europe
- 3.6 Pricing analysis, 2022
- 3.7 Reimbursement scenario
- 3.8 Technology landscape
- 3.9 Future market trends
- 3.10 GAP analysis
- 3.11 Porter's analysis
- 3.12 PESTEL analysis
- 3.13 Impact of Russia Ukraine war
Chapter 4 Competitive Landscape, 2022
- 4.1 Introduction
- 4.2 Company matrix analysis, 2022
- 4.3 Global company market share analysis, 2022
- 4.4 Competitive positioning matrix
- 4.5 Strategy dashboard
Chapter 5 Fresh vegetables Market Size and Forecast, By Vegetable Type 2018 - 2032
- 5.1 Leafy Greens
- 5.1.1 Lettuce
- 5.1.2 Spinach
- 5.1.3 Kale
- 5.1.4 Swiss Chard
- 5.1.5 Others
- 5.2 Cruciferous Vegetables
- 5.2.1 Broccoli
- 5.2.2 Cauliflower
- 5.2.3 Cabbage
- 5.2.4 Brussels Sprouts
- 5.2.5 Others
- 5.3 Root Vegetables
- 5.3.1 Carrots
- 5.3.2 Potatoes
- 5.3.3 Beets
- 5.3.4 Radishes
- 5.3.5 Others
- 5.4 Allium Vegetables
- 5.4.1 Onions
- 5.4.2 Garlic
- 5.4.3 Leeks
- 5.4.4 Shallots
- 5.4.5 Others
- 5.5 Solanaceous Vegetables
- 5.5.1 Tomatoes
- 5.5.2 Peppers
- 5.5.3 Eggplants
- 5.5.4 Potatoes
- 5.5.5 Others
- 5.6 Legumes
- 5.6.1 Peas
- 5.6.2 Beans
- 5.6.3 Lentils
- 5.6.4 Others
- 5.7 Cucurbitaceous Vegetables
- 5.7.1 Cucumbers
- 5.7.2 Zucchinis
- 5.7.3 Pumpkins
- 5.7.4 Melons
- 5.7.5 Others
- 5.8 Other
- 5.8.1 Corn
- 5.8.2 Asparagus
- 5.8.3 Artichokes
- 5.8.4 Others
Chapter 6 Fresh vegetables Market Size and Forecast, By End-use 2018 - 2032
- 6.1 Household Consumption
- 6.2 Food Processing
- 6.3 Foodservice
- 6.4 Other End-Uses
Chapter 7 Fresh vegetables Market Size and Forecast, By Distribution Channel 2018 - 2032
- 7.1 Retail Stores
- 7.2 Online Retailing
- 7.3 Farmers' Markets
- 7.4 Specialty Stores
- 7.5 Foodservice Providers
- 7.6 Wholesale Markets
Chapter 8 Fresh vegetables Market Size and Forecast, By Region 2018 - 2032
- 8.1 Key trends, by region
- 8.2 North America
- 8.2.1 U.S.
- 8.2.2 Canada
- 8.3 Europe
- 8.3.1 Germany
- 8.3.2 UK
- 8.3.3 France
- 8.3.4 Spain
- 8.3.5 Italy
- 8.4 Asia Pacific
- 8.4.1 Japan
- 8.4.2 China
- 8.4.3 India
- 8.4.4 Australia
- 8.4.5 South Korea
- 8.4.6 Indonesia
- 8.4.7 Malaysia
- 8.5 Latin America
- 8.5.1 Brazil
- 8.5.2 Mexico
- 8.5.3 Argentina
- 8.6 MEA
- 8.6.1 South Africa
- 8.6.2 Saudi Arabia
- 8.6.3 UAE
- 8.6.4 Egypt
Chapter 9 Company Profiles
- 9.1 Dole Food Company, Inc.
- 9.2 Fresh Del Monte Produce Inc.
- 9.3 The Kraft Heinz Company
- 9.4 Conagra Brands, Inc.
- 9.5 Taylor Farms
- 9.6 Calavo Growers, Inc.
- 9.7 Nestlé S.A.
- 9.8 Ardo Group
- 9.9 Bonduelle Group
- 9.10 Green Giant (a subsidiary of B&G Foods)
- 9.11 Mann Packing Company
- 9.12 Church Brothers Farms
- 9.13 SunFed
- 9.14 Lipman Family Farms