|
|
市場調査レポート
商品コード
1319246
エナジードリンクの世界市場-2023年~2030年Global Energy Drinks Market - 2023-2030 |
||||||
|
|
|||||||
|
● お客様のご希望に応じて、既存データの加工や未掲載情報(例:国別セグメント)の追加などの対応が可能です。 詳細はお問い合わせください。 |
|||||||


| エナジードリンクの世界市場-2023年~2030年 |
|
出版日: 2023年07月31日
発行: DataM Intelligence
ページ情報: 英文 195 Pages
納期: 約2営業日
|
- 全表示
- 概要
- 目次
市場概要
世界のエナジードリンク市場は、2022年に913億4,800万米ドルに達し、2030年には1,665億9,000万米ドルに達する好成長が予測されています。予測期間(2023-2030年)のCAGRは7.8%です。
消費者は、エネルギーレベルを高め、精神的な覚醒度を高めるための手軽で便利な方法として、エナジードリンクをよく利用します。これらの飲料には通常、カフェイン、タウリン、ビタミンB群、ガラナ抽出物、高麗人参抽出物などの成分が含まれており、これらが協力して望ましい効果をもたらし、エナジードリンク市場規模を押し上げています。摂取すると、カフェインは中枢神経系を刺激し、覚醒を促し、疲労を軽減します。タウリンとビタミンB群は、エネルギー代謝と神経機能をサポートします。高いカフェイン含有量で知られるガラナ・エキスは、全体的な活力増強効果に寄与します。高麗人参エキスは、肉体的・精神的パフォーマンスを高めると考えられています。これらの成分を組み合わせることで、精神的な覚醒をサポートし、エネルギーレベルを一時的に高める相乗効果が生まれ、エナジードリンク市場の収益を押し上げます。
市場力学
消費者はエナジードリンクにおいて低糖または無糖飲料を好むようになっています
消費者がより健康的な選択肢を優先するため、エナジードリンクにおける低糖または無糖の選択肢に対する需要が増加しています。過剰な糖分を含まず、活力を高めるエナジードリンクを求める人が増えています。このような消費者の嗜好の変化は、砂糖の大量摂取に伴う潜在的な健康リスクに対する意識の高まりと、飲料の選択についてより十分な情報を得た上で意識的な意思決定を行いたいという願望を反映しています。その結果、砂糖の添加量を減らした、あるいは無添加のエナジードリンクが市場に登場し、消費者に健康とウェルネスの目標に沿った選択肢を提供しています。例えば、2022年5月27日、オーストラリアの清涼飲料会社ネクスバは、ビタミンとプレバイオティクスを添加した無糖エナジードリンクを発売しました。
高いカフェイン含有量がエナジードリンクの消費を制限する
エナジードリンクはカフェイン含有量が多いため、しばしば消費が制限されます。エナジードリンクに含まれる高濃度のカフェインは中枢神経系を刺激し、覚醒と覚醒を促します。しかし、カフェインを過剰に摂取すると、心拍数の増加、落ち着きのなさ、神経過敏、睡眠障害などの悪影響が生じる可能性があります。そのため、潜在的な健康リスクを避けるために、エナジードリンクの摂取を控えめにし、個人のカフェイン耐性を意識することが勧められています。
COVID-19影響分析
COVID-19分析には、COVID前シナリオ、COVIDシナリオ、COVID後シナリオが含まれ、価格力学(COVID前シナリオと比較したパンデミック中およびパンデミック後の価格変動を含む)、需給スペクトラム(取引制限、封鎖、およびその後の問題による需要と供給のシフト)、政府の取り組み(政府機関による市場、セクター、産業を復興させる取り組み)、メーカーの戦略的取り組み(COVID問題を緩和するためにメーカーが行ったことをここで取り上げる)が含まれます。
人工知能分析
エナジードリンクに関する人工知能(AI)分析は、消費者の嗜好、市場動向、製品処方に関する貴重な洞察を提供することができます。AIアルゴリズムは、カスタマーレビュー、ソーシャルメディアでの議論、販売データなど、大量のデータを分析してパターンを特定し、意味のある情報を抽出することができます。この分析により、企業は消費者の感情を理解し、新たな動向を特定し、製品処方を最適化し、エナジードリンク市場の進化する需要に対応するためのデータ主導の意思決定を行うことができます。さらに、AIは消費者の嗜好を予測し、マーケティング戦略を最適化し、エナジードリンク業界におけるイノベーションの新たな機会を特定するのに役立ちます。
目次
第1章 調査手法と調査範囲
第2章 定義と概要
第3章 エグゼクティブサマリー
第4章 市場力学
- 影響要因
- 促進要因
- 消費者の低糖質飲料や無糖質飲料への志向の高まり
- 抑制要因
- カフェイン含有量が多いため、エナジードリンクの消費が制限されます。
- 機会
- 人口増加によるエナジードリンク需要の増加
- 影響分析
- 促進要因
第5章 産業分析
- ポーターのファイブフォース分析
- サプライチェーン分析
- 価格分析
- 規制分析
第6章 COVID-19分析
第7章 タイプ別
- ハイパートニック
- ハイポトニック
- アイソトニック
第8章 成分別
- アクア/水
- 添加物
- 甘味料
- 多糖類とオリゴ糖
- 香料
- 酸味料
- その他
第9章 パッケージ別
- 缶
- ボトル(ペット/ガラス)
- その他
第10章 流通チャネル別
- スーパーマーケット/ハイパーマーケット
- オンライン小売店
- コンビニエンスストア
- 専門店
- その他
第11章 地域別
- 北米
- 米国
- カナダ
- メキシコ
- 欧州
- ドイツ
- 英国
- フランス
- イタリア
- スペイン
- その他欧州
- 南米
- ブラジル
- アルゼンチン
- その他南米
- アジア太平洋
- 中国
- インド
- 日本
- オーストラリア
- その他アジア太平洋地域
- 中東・アフリカ
第12章 競合情勢
- 競合シナリオ
- 市況/シェア分析
- M&A分析
第13章 企業プロファイル
- Arizona Beverage Company
- 会社概要
- グレード・ポートフォリオと概要
- 財務概要
- 主な発展
- PepsiCo
- Coca-cola
- Dr. Pepper Snapple Group
- Extreme Drinks Co
- Living Essentials
- Monster Beverage Corporation
- Mountain Fuel Co
- National Beverage Corp
- Otsuka Holdings
第14章 付録
Market Overview
The Global Energy Drinks Market reached US$ 91,348 million in 2022 and is projected to witness lucrative growth by reaching up to US$ 166,590 million by 2030. The market is growing at a CAGR of 7.8% during the forecast period (2023-2030).
Consumers often turn to energy drinks for a quick and convenient way to boost their energy levels and enhance mental alertness. These beverages typically contain ingredients such as caffeine, taurine, B-vitamins, guarana extract, and ginseng extract, which work together to provide the desired effects and drives the energy drinks market size. Upon consumption, the caffeine stimulates the central nervous system, promoting wakefulness and reducing fatigue. Taurine and B-vitamins help support energy metabolism and neurological function. Guarana extract, known for its high caffeine content, contributes to the overall energizing effect. Ginseng extract is believed to enhance physical and mental performance. Combined, these ingredients create a synergistic effect that supports mental alertness and temporarily increases energy levels which drives the energy drinks market revenue.
Market Dynamics
Consumers Increasingly Prefer Low-Sugar or Sugar-Free Beverages in Energy Drinks.
The demand for low-sugar or sugar-free options in energy drinks is on the rise as consumers prioritize healthier choices. Increasingly, individuals are seeking energy drinks that provide a boost of vitality without the excessive sugar content. This shift in consumer preference reflects a growing awareness of the potential health risks associated with high sugar intake and a desire to make more informed and conscious decisions about their beverage choices. As a result, the market has seen an emergence of energy drink options that offer reduced or no added sugars, providing consumers with alternatives that align with their health and wellness goals. For instance, on May 27, 2022, The Australian soft drinks company, Nexba, launched sugar-free energy drinks with added vitamins and prebiotics.
The High Caffeine Content Limits the Consumption of Energy Drinks
Consumption of energy drinks is often restricted due to their high caffeine content, which serves as a limiting factor. The significant levels of caffeine in these beverages can have stimulating effects on the central nervous system, promoting wakefulness and alertness. However, excessive caffeine intake can lead to adverse effects such as increased heart rate, restlessness, nervousness, and difficulty sleeping. As a result, individuals are advised to moderate their consumption of energy drinks and be mindful of their personal caffeine tolerance to avoid potential health risks.
COVID-19 Impact Analysis
The COVID-19 Analysis includes Pre-COVID Scenario, COVID Scenario and Post-COVID Scenario along with Pricing Dynamics (Including pricing change during and post-pandemic comparing it with pre-COVID scenarios), Demand-Supply Spectrum (Shift in demand and supply owing to trading restrictions, lockdown and subsequent issues), Government Initiatives (Initiatives to revive market, sector or Industry by Government Bodies) and Manufacturers Strategic Initiatives (What manufacturers did to mitigate the COVID issues will be covered here).
Artificial Intelligence Analysis
Artificial intelligence (AI) analysis on energy drinks can provide valuable insights into consumer preferences, market trends, and product formulations. AI algorithms can analyze large volumes of data, including customer reviews, social media discussions, and sales data, to identify patterns and extract meaningful information. This analysis can help companies understand consumer sentiment, identify emerging trends, optimize product formulations, and make data-driven decisions to meet the evolving demands of the energy drink market. Additionally, AI can assist in predicting consumer preferences, optimizing marketing strategies, and identifying new opportunities for innovation in the energy drinks industry.
Segment Analysis
The global energy drinks market is segmented based on type, ingredients, packaging, distribution channel, and region.
Hypertonic Segment Accounts Sizable Share in the Global Energy Drinks Market
Hypertonic energy drinks typically contain a range of nutritional values per serving, which can vary depending on the brand and specific formulation. For instance, on average, a serving size of these beverages (usually around 8 to 16 fluid ounces) may provide approximately 20-40 grams of carbohydrates and 15-30 grams of sugars. In terms of calories, hypertonic energy drinks can range from 80 to 150 calories per serving. These drinks also tend to contain electrolytes such as sodium (100-200 milligrams), potassium (50-100 milligrams), and magnesium (10-30 milligrams), which help support hydration and muscle function.
Additionally, caffeine is often included in these beverages to enhance alertness and performance, with amounts typically ranging from 50 to 100 milligrams per serving. It's important to keep in mind that specific nutritional values can vary among different brands and formulations, so it is recommended to refer to the product packaging for precise and up-to-date information on the nutritional content of each hypertonic energy drink.
Geographical Analysis
Asia-Pacific Holds the Largest Share in the Global Energy Drinks Market
By region, the global energy drinks market is segmented into North America, South America, Europe, Asia-Pacific, Middle-east and Africa.
The energy drinks market in the Asia Pacific region has experienced notable growth in recent years. This growth can be attributed to factors such as the region's large and youthful population, increasing disposable income, and changing consumer lifestyles. Energy drinks have gained popularity among the younger demographic who seek beverages that provide an instant energy boost and enhanced mental alertness. Local and international brands have capitalized on this trend by offering a wide range of flavors and formulations tailored to the preferences of Asian consumers. For instance, on February 12, 2022, Red Bull India launched new Red Edition with a refreshing taste of Watermelon. Red Bull Red Edition offers a refreshing twist on the classic Red Bull Energy Drink, providing a delightful flavor experience.
Competitive Landscape
The major global players include: Arizona Beverage Company, PepsiCo, Coca-cola, Dr. Pepper Snapple Group, Extreme Drinks Co, Living Essentials, Monster Beverage Corporation, Mountain Fuel Co, National Beverage Corp and Otsuka Holdings.
Why Purchase the Report?
- To visualize the global energy drinks market segmentation based on type, ingredients, packaging, distribution channel, and region, as well as understand key commercial assets and players.
- Identify commercial opportunities by analyzing trends and co-development.
- Excel data sheet with numerous data points of Energy drinks market-level with all segments.
- PDF report consists of a comprehensive analysis after exhaustive qualitative interviews and an in-depth study.
- Product mapping available as excel consisting of key products of all the major players.
The global energy drinks market report would provide approximately 77 tables, 80 figures and 195 Pages.
Target Audience 2023
- Manufacturers/ Buyers
- Industry Investors/Investment Bankers
- Research Professionals
- Emerging Companies
Table of Contents
1. Methodology and Scope
- 1.1. Research Methodology
- 1.2. Research Objective and Scope of the Report
2. Definition and Overview
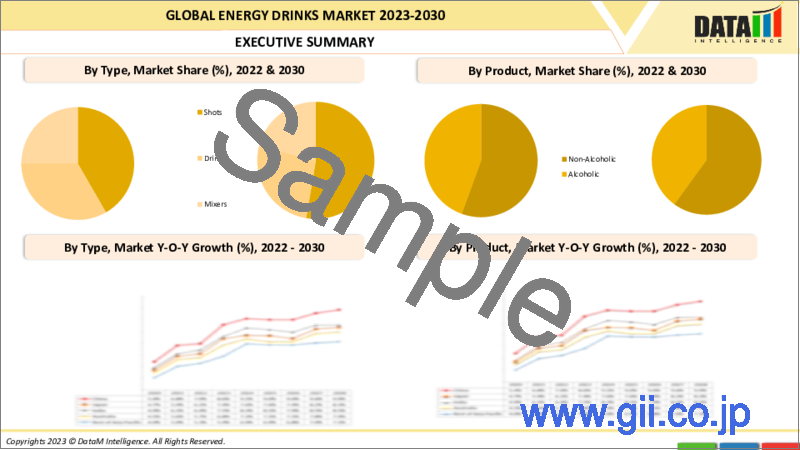
3. Executive Summary
- 3.1. Snippet by Type
- 3.2. Snippet by Ingredients
- 3.3. Snippet by Packaging
- 3.4. Snippet by Distribution Channel
- 3.5. Snippet by Region
4. Dynamics
- 4.1. Impacting Factors
- 4.1.1. Drivers
- 4.1.1.1. Consumers increasingly prefer low-sugar or sugar-free beverages
- 4.1.2. Restraints
- 4.1.2.1. The high caffeine content limits the consumption of energy drinks
- 4.1.3. Opportunity
- 4.1.3.1. The increasing demand for energy drinks due to population growth
- 4.1.4. Impact Analysis
- 4.1.1. Drivers
5. Industry Analysis
- 5.1. Porter's Five Force Analysis
- 5.2. Supply Chain Analysis
- 5.3. Pricing Analysis
- 5.4. Regulatory Analysis
6. COVID-19 Analysis
- 6.1. Analysis of COVID-19
- 6.1.1. Scenario Before COVID-19
- 6.1.2. Scenario During COVID-19
- 6.1.3. Post COVID-19 and Future Scenario
- 6.2. Pricing Dynamics Amid COVID-19
- 6.3. Demand-Supply Spectrum
- 6.4. Government Initiatives Related to the Market During Pandemic
- 6.5. Manufacturers Strategic Initiatives
- 6.6. Conclusion
7. By Type
- 7.1. Introduction
- 7.1.1. Market Size Analysis and Y-o-Y Growth Analysis (%), By Type
- 7.1.2. Market Attractiveness Index, By Type
- 7.2. Hypertonic *
- 7.2.1. Introduction
- 7.2.2. Market Size Analysis and Y-o-Y Growth Analysis (%)
- 7.3. Hypotonic
- 7.4. Isotonic
8. By Ingredients
- 8.1. Introduction
- 8.1.1. Market Size Analysis and Y-o-Y Growth Analysis (%), By Ingredients
- 8.1.2. Market Attractiveness Index, By Ingredients
- 8.2. Aqua/water *
- 8.2.1. Introduction
- 8.2.2. Market Size Analysis and Y-o-Y Growth Analysis (%)
- 8.3. Additives
- 8.3.1. Sweeteners
- 8.3.2. Polysaccharides and Oligosaccharides
- 8.3.3. Flavours
- 8.3.4. Acidulants
- 8.3.5. Others
9. By Packaging
- 9.1. Introduction
- 9.1.1. Market Size Analysis and Y-o-Y Growth Analysis (%), By Packaging
- 9.1.2. Market Attractiveness Index, By Packaging
- 9.2. Cans *
- 9.2.1. Introduction
- 9.2.2. Market Size Analysis and Y-o-Y Growth Analysis (%)
- 9.3. Bottle (Pet/Glass)
- 9.4. Others
10. By Distribution Channel
- 10.1. Introduction
- 10.1.1. Market Size Analysis and Y-o-Y Growth Analysis (%), By Distribution Channel
- 10.1.2. Market Attractiveness Index, By Distribution Channel
- 10.2. Supermarkets/Hypermarkets *
- 10.2.1. Introduction
- 10.2.2. Market Size Analysis and Y-o-Y Growth Analysis (%)
- 10.3. Online Retail Stores
- 10.4. Convenience Stores
- 10.5. Specialty Stores
- 10.6. Others
11. By Region
- 11.1. Introduction
- 11.1.1. Market Size Analysis and Y-o-Y Growth Analysis (%), By Region
- 11.1.2. Market Attractiveness Index, By Region
- 11.2. North America
- 11.2.1. Introduction
- 11.2.2. Key Region-Specific Dynamics
- 11.2.3. Market Size Analysis and Y-o-Y Growth Analysis (%), By Type
- 11.2.4. Market Size Analysis and Y-o-Y Growth Analysis (%), By Ingredients
- 11.2.5. Market Size Analysis and Y-o-Y Growth Analysis (%), By Packaging
- 11.2.6. Market Size Analysis and Y-o-Y Growth Analysis (%), By Distribution Channel
- 11.2.7. Market Size Analysis and Y-o-Y Growth Analysis (%), By Country
- 11.2.7.1. The U.S.
- 11.2.7.2. Canada
- 11.2.7.3. Mexico
- 11.3. Europe
- 11.3.1. Introduction
- 11.3.2. Key Region-Specific Dynamics
- 11.3.3. Market Size Analysis and Y-o-Y Growth Analysis (%), By Type
- 11.3.4. Market Size Analysis and Y-o-Y Growth Analysis (%), By Ingredients
- 11.3.5. Market Size Analysis and Y-o-Y Growth Analysis (%), By Packaging
- 11.3.6. Market Size Analysis and Y-o-Y Growth Analysis (%), By Distribution Channel
- 11.3.7. Market Size Analysis and Y-o-Y Growth Analysis (%), By Country
- 11.3.7.1. Germany
- 11.3.7.2. The U.K.
- 11.3.7.3. France
- 11.3.7.4. Italy
- 11.3.7.5. Spain
- 11.3.7.6. Rest of Europe
- 11.4. South America
- 11.4.1. Introduction
- 11.4.2. Key Region-Specific Dynamics
- 11.4.3. Market Size Analysis and Y-o-Y Growth Analysis (%), By Type
- 11.4.4. Market Size Analysis and Y-o-Y Growth Analysis (%), By Ingredients
- 11.4.5. Market Size Analysis and Y-o-Y Growth Analysis (%), By Packaging
- 11.4.6. Market Size Analysis and Y-o-Y Growth Analysis (%), By Distribution Channel
- 11.4.7. Market Size Analysis and Y-o-Y Growth Analysis (%), By Country
- 11.4.7.1. Brazil
- 11.4.7.2. Argentina
- 11.4.7.3. Rest of South America
- 11.5. Asia-Pacific
- 11.6. Introduction
- 11.7. Key Region-Specific Dynamics
- 11.7.1. Market Size Analysis and Y-o-Y Growth Analysis (%), By Type
- 11.7.2. Market Size Analysis and Y-o-Y Growth Analysis (%), By Ingredients
- 11.7.3. Market Size Analysis and Y-o-Y Growth Analysis (%), By Packaging
- 11.7.4. Market Size Analysis and Y-o-Y Growth Analysis (%), By Distribution Channel
- 11.7.5. Market Size Analysis and Y-o-Y Growth Analysis (%), By Country
- 11.7.5.1. China
- 11.7.5.2. India
- 11.7.5.3. Japan
- 11.7.5.4. Australia
- 11.7.5.5. Rest of Asia-Pacific
- 11.8. Middle East and Africa
- 11.8.1. Introduction
- 11.8.2. Key Region-Specific Dynamics
- 11.8.3. Market Size Analysis and Y-o-Y Growth Analysis (%), By Type
- 11.8.4. Market Size Analysis and Y-o-Y Growth Analysis (%), By Ingredients
- 11.8.5. Market Size Analysis and Y-o-Y Growth Analysis (%), By Packaging
- 11.8.6. Market Size Analysis and Y-o-Y Growth Analysis (%), By Distribution Channel
12. Competitive Landscape
- 12.1. Competitive Scenario
- 12.2. Market Positioning/Share Analysis
- 12.3. Mergers and Acquisitions Analysis
13. Company Profiles
- 13.1. Arizona Beverage Company*
- 13.1.1. Company Overview
- 13.1.2. Grade Portfolio and Description
- 13.1.3. Financial Overview
- 13.1.4. Key Developments
- 13.2. PepsiCo
- 13.3. Coca-cola
- 13.4. Dr. Pepper Snapple Group
- 13.5. Extreme Drinks Co
- 13.6. Living Essentials
- 13.7. Monster Beverage Corporation
- 13.8. Mountain Fuel Co
- 13.9. National Beverage Corp
- 13.10. Otsuka Holdings
LIST NOT EXHAUSTIVE
14. Appendix
- 14.1. About Us and Services
- 14.2. Contact Us