|
|
市場調査レポート
商品コード
1304533
浮体式海洋石油・ガス生産貯蔵積出設備(FPSO)の世界市場-2023年~2030年Global Floating Production Storage and Offloading (FPSO) Market - 2023-2030 |
||||||
|
|
|||||||
|
● お客様のご希望に応じて、既存データの加工や未掲載情報(例:国別セグメント)の追加などの対応が可能です。 詳細はお問い合わせください。 |
|||||||


| 浮体式海洋石油・ガス生産貯蔵積出設備(FPSO)の世界市場-2023年~2030年 |
|
出版日: 2023年07月07日
発行: DataM Intelligence
ページ情報: 英文 215 Pages
納期: 約2営業日
|
- 全表示
- 概要
- 目次
市場概要
浮体式海洋石油・ガス生産貯蔵積出設備(FPSO)の世界市場は、2022年に142億米ドルに達し、2023-2030年の予測期間中にCAGR 6.5%で成長し、2030年までに235億米ドルに達すると予測されています。
現在の地政学的状況は、世界のFPSO市場の成長に大きく寄与しています。中東の伝統的な輸出国からの供給がアジア諸国に買い占められる中、欧州諸国はエネルギー輸入のギャップを埋めるために南米やアフリカの新興輸出国に頼っています。アフリカでのオフショア石油・ガス生産の拡大は、中長期的にFPSOの新たな需要を生み出すと思われます。
海洋エンジニアリング会社は、FPSOのエネルギー効率と全体的な性能を向上させるための新しい設計を開発しています。例えば、2023年5月、マレーシアの海洋エンジニアリング会社MISCは、システム統合を改善し、持続可能な技術を可能にするメガモジュールのトップサイドを利用した新しいFPSO設計を発表しました。
市場力学
世界のLNG需要の拡大
LNGは石炭・石油よりもクリーンな燃焼燃料とされ、温室効果ガスの排出量が少ないです。LNGを含む天然ガスは、低炭素の未来に向けた過渡的な燃料とみなされることが多いです。さらに、ロシア・ウクライナ戦争によってロシアの天然ガス供給が途絶えたことで、欧州諸国はエネルギー需要を満たすために液化天然ガス(LNG)への依存を強めています。
LNG需要の高まりは、海底ガス田の探査と開発の増加につながっています。これらの油田の多くは、従来の固定式プラットフォームでは実現不可能な、遠隔地の厳しい海洋環境に位置しています。FPSOは、こうしたオフショアガス田におけるLNG生産、貯蔵、オフローディングのための柔軟でコスト効率の高いソリューションを提供します。
FPSOには、ガス処理と液化のための先進技術を組み込むことができます。この技術により、天然ガスをLNGに変換することが可能になり、輸送と貯蔵がより簡単で費用対効果が高くなります。FPSOにおけるガス処理と液化機能の統合は、生産プロセス全体を合理化し、世界のLNG市場の成長を支えます。
オフショアプラットフォームの廃止措置
オフショアプラットフォームの生産寿命が尽きると、デコミッショニングが必要になります。油田を完全に放棄する代わりに、FPSOを配備して残存埋蔵量を抽出し、油田の生産寿命を延ばすことができます。FPSOは、炭化水素の継続的な生産、貯蔵、積出を可能にし、海洋資産の価値を最大化し、プラットフォームの完全撤去の必要性を低減します。
FPSOは、固定式オフショア・プラットフォームの廃止に代わるコスト効率の高い選択肢を提供します。オフショアプラットフォームの撤去は、重量物の吊り上げや解体作業を伴い、高価で複雑なものとなる可能性があります。FPSOを油田に配備することで、オペレーターはコストのかかるプラットフォームの撤去・廃棄プロセスを回避することができます。その代わり、既存のインフラや設備を利用しながら生産を継続することができます。
高い資本コスト
FPSOの開発と配備には、多額の先行資本投資が必要です。FPSOのエンジニアリング、建設、設置、試運転に関連するコストは相当なものになります。パンデミック後の新規FPSOは特に高額になっています。例えば、ブラジルの国営エネルギー会社ペトロブラスは2021年6月、韓国の造船会社DSMEに新しいFPSO P-79を23億米ドルで発注しました。
FPSOプロジェクトにかかる多額の資本支出は、投資利益率と収益性に影響します。初期投資を回収するのに必要な投資回収期間が長いため、世界の原油価格やプロジェクト実績の不確実性と相まって、資金提供者にとって魅力的な提案ではなくなる可能性があります。これはオペレーターの慎重なアプローチにつながり、世界のFPSO市場の成長に影響を与える可能性があります。
COVID-19の影響分析
パンデミックは、石油・ガス業界を含む世界経済全体に混乱をもたらしました。その結果、多くのオペレーターが投資決定を延期し、計画されていたFPSOプロジェクトを延期または中止しました。パンデミックの期間と深刻度に関する不確実性は、不安定な原油価格と相まって、業界における資本支出の減少につながっています。
パンデミックは世界のサプライチェーンに混乱をもたらしました。海外渡航の制限、施錠措置、製造施設の一時的な操業停止は、FPSOプロジェクトに必要な重要部品・機器の入手・納入に影響を与えました。パンデミックによる短期的な課題にもかかわらず、FPSO市場の長期的な見通しは引き続き明るいです。
ウクライナ・ロシア紛争の影響
ロシア・ウクライナ紛争は、欧州連合(EU)と米国がロシアに厳しい経済制裁を課すきっかけとなっています。この制裁により、欧米からロシアへの技術移転は完全に遮断されました。この制裁によってロシアは、北極圏の海洋石油・ガス埋蔵量を探査するための最新鋭FPSOへのアクセスを奪われました。
欧州では、ロシアから米国や中東へのエネルギー供給の方向性が根本的に変わっています。この地域の多くの国々は、ロシアのエネルギー供給が途絶えたことで生じたギャップを埋めるため、国際市場で液化天然ガス(LNG)の大量購入を開始しました。長期貯蔵施設が陸上に建設される間、安全なLNG貯蔵を確保するためのFPSOに対する一時的な需要が生まれました。
目次
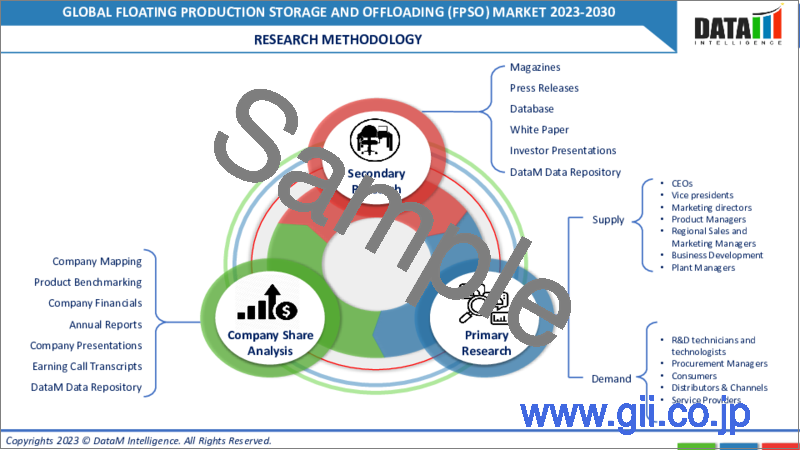
第1章 調査手法と調査範囲
第2章 定義と概要
第3章 エグゼクティブサマリー
第4章 市場力学
- 影響要因
- 促進要因
- 石油・ガス需要の増加
- オフショアガス処理と液化の増加
- 世界のLNG需要の増加
- オフショアプラットフォームの廃止
- 抑制要因
- 高い資本コスト
- 他の生産システムとの競合
- 機会
- 影響分析
- 促進要因
第5章 産業分析
- ポーターのファイブフォース分析
- サプライチェーン分析
- 価格分析
- 規制分析
第6章 COVID-19分析
第7章 タイプ別
- 石油
- LPG
- LNG
- その他
第8章 船型別
- 改造船
- 新造船
- 再配備船
第9章 水深別
- 浅海
- 深海・超深海
第10章 船型別
- シングルハル
- ダブルハル
第11章 地域別
- 北米
- 米国
- カナダ
- メキシコ
- 欧州
- ドイツ
- 英国
- フランス
- イタリア
- スペイン
- その他欧州
- 南米
- ブラジル
- アルゼンチン
- その他南米
- アジア太平洋
- 中国
- インド
- 日本
- オーストラリア
- その他アジア太平洋地域
- 中東・アフリカ
第12章 競合情勢
- 競合シナリオ
- 市況/シェア分析
- M&A分析
第13章 企業プロファイル
- BP Plc
- 会社概要
- 製品ポートフォリオと概要
- 財務概要
- 最近の動向
- Aker Solutions AS
- Shell Global
- Bluewater Energy Services B.V.
- Bumi Armada Berhad
- BW Offshore
- Chevron
- ExxonMobil Corporation
- MODEC, Inc.
- Petrobras
第14章 付録
Market Overview
The Global Floating Production Storage and Offloading (FPSO) Market reached US$ 14.2 billion in 2022 and is expected to reach US$ 23.5 billion by 2030, growing with a CAGR of 6.5% during the forecast period 2023-2030.
The current geopolitical situation has been highly conducive to the growth of the global FPSO market. With supplies from traditional exporters in the Middle East being bought up by Asian countries, European countries are relying upon newly emerging exporters in South America and Africa to fill gaps in its energy imports. Expanding offshore oil and gas production in Africa will create new demand for FPSOs in the medium and long-term.
Marine engineering companies are developing new designs to improve the energy efficiency and overall performance of FPSOs. For instance, in May 2023, MISC, a Malaysian marine engineering company unveiled a new FPSO design that utilizes mega-module topsides , improving systems integration and allowing for sustainable technologies.
Market Dynamics
Growing Global LNG Demand
LNG is considered a cleaner-burning fuel than coal and oil, resulting in lower greenhouse gas emissions. Natural gas, including LNG, is often considered a transitional fuel towards a low-carbon future. Furthermore, with the disruption in Russian natural gas supplies due to the Russia-Ukraine war, European countries are increasingly turning to liquified natural gas (LNG) to fulfill their energy demand.
The rising demand for LNG has led to increased exploration and development of offshore gas fields. Many of these fields are located in remote and challenging offshore environments where traditional fixed platforms are not feasible. FPSOs offer a flexible and cost-effective solution for LNG production, storage, and offloading in these offshore gas fields.
FPSOs can incorporate advanced technologies for gas processing and liquefaction on board. The technologies enable the conversion of natural gas into LNG, making it easier and more cost-effective to transport and store. The integration of gas processing and liquefaction capabilities on FPSOs streamlines the overall production process and supports the growth of the global LNG market.
Decommissioning of Offshore Platforms
Decommissioning becomes necessary as offshore platforms reach the end of their production life. Instead of altogether abandoning the field, FPSOs can be deployed to extract remaining reserves and extend the field's productive life. FPSOs enable continued production, storage, and offloading of hydrocarbons, maximizing the value of offshore assets and reducing the need for full platform removal.
FPSOs offer a cost-effective alternative to decommissioning fixed offshore platforms. Removing offshore platforms can be expensive and complex, involving heavy lifting and dismantling operations. By deploying an FPSO to the field, operators can avoid the costly platform removal and disposal process. Instead, they can continue production while using the existing infrastructure and facilities.
High Capital Costs
Developing and deploying an FPSO involves substantial upfront capital investment. The costs associated with engineering, construction, installation, and commissioning of FPSOs can be considerable. New FPSOs in the post-pandemic period have become especially expensive. For instance, in June 2021, Petrobras, Brazil's state-owned energy company, ordered a new FPSO P-79 from South Korea's DSME shipbuilding company for US$ 2.3 billion.
The significant capital outlay for FPSO projects affects the return on investment and profitability. The long payback period required to recoup the initial investment, coupled with uncertainties in global oil prices and project performance, can make it a less attractive proposition for financers. It can lead to a cautious approach from operators and impact the growth of the global FPSO market.
COVID-19 Impact Analysis
The pandemic caused disruptions across the global economy, including the oil and gas industry. As a result, many operators postponed their investment decisions and delayed or canceled planned FPSO projects. Uncertainty regarding the duration and severity of the pandemic, coupled with volatile oil prices, led to reduced capital expenditure in the industry.
The pandemic resulted in disruptions to global supply chains. Restrictions on international travel, lockdown measures, and temporary shutdowns of manufacturing facilities affected the availability and delivery of critical components and equipment necessary for FPSO projects. Despite the short-term challenges caused by the pandemic, the long-term outlook for the FPSO market remains positive.
Ukraine-Russia War Impact
The Russia-Ukraine conflict led to European Union (EU) and the U.S. imposing stringent economic sanctions on Russia. The sanctions caused the complete blockage of Western technology transfer to Russia. The sanctions deprived Russia of access to advanced FPSOs for the exploration of offshore oil and gas reserves in the Arctic.
A radical reorientation of energy supplies from Russia to the U.S. and the Middle East occurred in Europe. Many countries in the region started buying large cargoes of liquified natural gas (LNG) on the international markets to fill the gap left by the disruption of Russian energy supplies. It created a temporary demand for FPSOs to ensure secure LNG storage while long-term storage facilities were built onshore.
Segment Analysis
The Global FPSO Market is segmented based on type, carrier type, water depth, hull type and region.
Double-Hulled Ships are the Most Widely Used for FPSO
The primary advantage of double-hulled ships is their improved safety and environmental protection features. The double hull design provides an extra layer of protection, reducing the risk of oil spills in the event of a collision or grounding. The outer hull acts as a protective barrier, minimizing the chances of oil leakage and offering increased resistance to damage.
Double-hulled tankers meet or exceed stringent regulatory requirements set by international maritime organizations and environmental agencies. Regulations such as the International Maritime Organization's (IMO) MARPOL Convention mandate the phase-out of single-hulled tankers and the use of double-hulled vessels to prevent oil pollution. By using double-hulled ships, FPSOs can comply with these regulations and ensure higher environmental protection.
FPSOs are long-term investments, with operational lifetimes spanning 15-20 years. Double-hulled ships are generally more durable and have longer service lives than single-hulled vessels. The added protection provided by the double hull design helps extend the life of the FPSO, reducing the risks of structural fatigue, corrosion and potential failures associated with aging single-hulled tankers.
Geographical Analysis
Commercial Production from New Reserves Will Propel Demand from South America
New commercial offshore reserves have been discovered in South America, mainly off the coast of Guyana and Brazil. The discovery of retail oil and gas deposits has increased demand for FPSOs as companies scramble to exploit these reserves. Traditional South American producers such as Venezuela are increasing their capacity. For instance, in January 2023, a Trinidad and Tobago company was awarded a license to develop a new offshore gas field in Venezuela.
In May 2023, SBM Offshore, a Dutch oilfield services company, signed a long-term maintenance contract with the multinational energy company Exxon Mobil Corporation for the company's FPSO fleet servicing the Starboek offshore block near Guyana. In December 2022, Petrobras, the Brazilian state-owned oil and gas company, announced that it had begun the tendering process to obtain two new FPSOs for operation in the Atapu and Sepia deepwater oil fields.
Competitive Landscape
The major global players include: BP Plc, Aker Solutions AS, Shell Global, Bluewater Energy Services B.V., Bumi Armada Berhad, BW Offshore, Chevron, ExxonMobil Corporation, MODEC, Inc. and Petrobras.
Why Purchase the Report?
- To visualize the Global FPSO Market segmentation based on type, carrier type, water depth, hull type and region, and understand critical commercial assets and players.
- Identify commercial opportunities by analyzing trends and co-development.
- Excel data sheet with numerous diamond art painting market-level data points with all segments.
- PDF report consists of a comprehensive analysis after exhaustive qualitative interviews and an in-depth study.
- Product mapping available as Excel consisting of key products of all the major players.
The Global FPSO Market Report Would Provide Approximately 64 Tables, 66 Figures And 215 Pages.
Target Audience 2023
- Oil and Gas Companies
- Energy Trading Companies
- Marine Engineering Companies
- Industry Investors/Investment Bankers
- Research Professionals
Table of Contents
1. Methodology and Scope
- 1.1. Research Methodology
- 1.2. Research Objective and Scope of the Report
2. Definition and Overview
3. Executive Summary
- 3.1. Snippet by Type
- 3.2. Snippet by Carrier Type
- 3.3. Snippet by Water Depth
- 3.4. Snippet by Hull Type
- 3.5. Snippet by Region
4. Dynamics
- 4.1. Impacting Factors
- 4.1.1. Drivers
- 4.1.1.1. Rising Demand for Oil and Gas
- 4.1.1.2. Increase in Offshore Gas Processing and Liquefaction
- 4.1.1.3. Growing Global LNG Demand
- 4.1.1.4. Decommissioning of Offshore Platforms
- 4.1.2. Restraints
- 4.1.2.1. High Capital Costs
- 4.1.2.2. Competition from Other Production Systems
- 4.1.3. Opportunity
- 4.1.4. Impact Analysis
- 4.1.1. Drivers
5. Industry Analysis
- 5.1. Porter's Five Force Analysis
- 5.2. Supply Chain Analysis
- 5.3. Pricing Analysis
- 5.4. Regulatory Analysis
6. COVID-19 Analysis
- 6.1. Analysis of COVID-19
- 6.1.1. Scenario Before COVID
- 6.1.2. Scenario During COVID
- 6.1.3. Scenario Post COVID
- 6.2. Pricing Dynamics Amid COVID-19
- 6.3. Demand-Supply Spectrum
- 6.4. Government Initiatives Related to the Market During Pandemic
- 6.5. Manufacturers Strategic Initiatives
- 6.6. Conclusion
7. By Type
- 7.1. Introduction
- 7.1.1. Market Size Analysis and Y-o-Y Growth Analysis (%), By Type
- 7.1.2. Market Attractiveness Index, By Type
- 7.2. Oil*
- 7.2.1. Introduction
- 7.2.2. Market Size Analysis and Y-o-Y Growth Analysis (%)
- 7.3. LPG
- 7.4. LNG
- 7.5. Others
8. By Carrier Type
- 8.1. Introduction
- 8.1.1. Market Size Analysis and Y-o-Y Growth Analysis (%), By Carrier Type
- 8.1.2. Market Attractiveness Index, By Carrier Type
- 8.2. Converted Ship*
- 8.2.1. Introduction
- 8.2.2. Market Size Analysis and Y-o-Y Growth Analysis (%)
- 8.3. New Built Ship
- 8.4. Redeployed
9. By Water Depth
- 9.1. Introduction
- 9.1.1. Market Size Analysis and Y-o-Y Growth Analysis (%), By Water Depth
- 9.1.2. Market Attractiveness Index, By Water Depth
- 9.2. Shallow Water*
- 9.2.1. Introduction
- 9.2.2. Market Size Analysis and Y-o-Y Growth Analysis (%)
- 9.3. Deep and Ultra-deep Water
10. By Hull Type
- 10.1. Introduction
- 10.1.1. Market Size Analysis and Y-o-Y Growth Analysis (%), By Hull Type
- 10.1.2. Market Attractiveness Index, By Hull Type
- 10.2. Single Hull*
- 10.2.1. Introduction
- 10.2.2. Market Size Analysis and Y-o-Y Growth Analysis (%)
- 10.3. Double Hull
11. By Region
- 11.1. Introduction
- 11.1.1. Market Size Analysis and Y-o-Y Growth Analysis (%), By Region
- 11.1.2. Market Attractiveness Index, By Region
- 11.2. North America
- 11.2.1. Introduction
- 11.2.2. Key Region-Specific Dynamics
- 11.2.3. Market Size Analysis and Y-o-Y Growth Analysis (%), By Type
- 11.2.4. Market Size Analysis and Y-o-Y Growth Analysis (%), By Carrier Type
- 11.2.5. Market Size Analysis and Y-o-Y Growth Analysis (%), By Water Depth
- 11.2.6. Market Size Analysis and Y-o-Y Growth Analysis (%), By Hull Type
- 11.2.7. Market Size Analysis and Y-o-Y Growth Analysis (%), By Country
- 11.2.7.1. The U.S.
- 11.2.7.2. Canada
- 11.2.7.3. Mexico
- 11.3. Europe
- 11.3.1. Introduction
- 11.3.2. Key Region-Specific Dynamics
- 11.3.3. Market Size Analysis and Y-o-Y Growth Analysis (%), By Type
- 11.3.4. Market Size Analysis and Y-o-Y Growth Analysis (%), By Carrier Type
- 11.3.5. Market Size Analysis and Y-o-Y Growth Analysis (%), By Water Depth
- 11.3.6. Market Size Analysis and Y-o-Y Growth Analysis (%), By Hull Type
- 11.3.7. Market Size Analysis and Y-o-Y Growth Analysis (%), By Country
- 11.3.7.1. Germany
- 11.3.7.2. The UK
- 11.3.7.3. France
- 11.3.7.4. Italy
- 11.3.7.5. Spain
- 11.3.7.6. Rest of Europe
- 11.4. South America
- 11.4.1. Introduction
- 11.4.2. Key Region-Specific Dynamics
- 11.4.3. Market Size Analysis and Y-o-Y Growth Analysis (%), By Type
- 11.4.4. Market Size Analysis and Y-o-Y Growth Analysis (%), By Carrier Type
- 11.4.5. Market Size Analysis and Y-o-Y Growth Analysis (%), By Water Depth
- 11.4.6. Market Size Analysis and Y-o-Y Growth Analysis (%), By Hull Type
- 11.4.7. Market Size Analysis and Y-o-Y Growth Analysis (%), By Country
- 11.4.7.1. Brazil
- 11.4.7.2. Argentina
- 11.4.7.3. Rest of South America
- 11.5. Asia-Pacific
- 11.5.1. Introduction
- 11.5.2. Key Region-Specific Dynamics
- 11.5.3. Market Size Analysis and Y-o-Y Growth Analysis (%), By Type
- 11.5.4. Market Size Analysis and Y-o-Y Growth Analysis (%), By Carrier Type
- 11.5.5. Market Size Analysis and Y-o-Y Growth Analysis (%), By Water Depth
- 11.5.6. Market Size Analysis and Y-o-Y Growth Analysis (%), By Hull Type
- 11.5.7. Market Size Analysis and Y-o-Y Growth Analysis (%), By Country
- 11.5.7.1. China
- 11.5.7.2. India
- 11.5.7.3. Japan
- 11.5.7.4. Australia
- 11.5.7.5. Rest of Asia-Pacific
- 11.6. Middle East and Africa
- 11.6.1. Introduction
- 11.6.2. Key Region-Specific Dynamics
- 11.6.3. Market Size Analysis and Y-o-Y Growth Analysis (%), By Type
- 11.6.4. Market Size Analysis and Y-o-Y Growth Analysis (%), By Carrier Type
- 11.6.5. Market Size Analysis and Y-o-Y Growth Analysis (%), By Water Depth
- 11.6.6. Market Size Analysis and Y-o-Y Growth Analysis (%), By Hull Type
12. Competitive Landscape
- 12.1. Competitive Scenario
- 12.2. Market Positioning/Share Analysis
- 12.3. Mergers and Acquisitions Analysis
13. Company Profiles
- 13.1. BP Plc*
- 13.1.1. Company Overview
- 13.1.2. Type Portfolio and Description
- 13.1.3. Financial Overview
- 13.1.4. Recent Developments
- 13.2. Aker Solutions AS
- 13.3. Shell Global
- 13.4. Bluewater Energy Services B.V.
- 13.5. Bumi Armada Berhad
- 13.6. BW Offshore
- 13.7. Chevron
- 13.8. ExxonMobil Corporation
- 13.9. MODEC, Inc.
- 13.10. Petrobras
LIST NOT EXHAUSTIVE
14. Appendix
- 14.1. About Us and Services
- 14.2. Contact Us